Chapter 11: Chi-Square Tests and ANOVA
359
Chapter 11: Chi-Square and ANOVA Tests
This chapter presents material on three more hypothesis tests. One is used to determine
significant relationship between two qualitative variables, the second is used to determine
if the sample data has a particular distribution, and the last is used to determine
significant relationships between means of 3 or more samples.
Section 11.1: Chi-Square Test for Independence
Remember, qualitative data is where you collect data on individuals that are categories or
names. Then you would count how many of the individuals had particular qualities. An
example is that there is a theory that there is a relationship between breastfeeding and
autism. To determine if there is a relationship, researchers could collect the time period
that a mother breastfed her child and if that child was diagnosed with autism. Then you
would have a table containing this information. Now you want to know if each cell is
independent of each other cell. Remember, independence says that one event does not
affect another event. Here it means that having autism is independent of being breastfed.
What you really want is to see if they are not independent. In other words, does one
affect the other? If you were to do a hypothesis test, this is your alternative hypothesis
and the null hypothesis is that they are independent. There is a hypothesis test for this
and it is called the Chi-Square Test for Independence. Technically it should be called
the Chi-Square Test for Dependence, but for historical reasons it is known as the test for
independence. Just as with previous hypothesis tests, all the steps are the same except for
the assumptions and the test statistic.
Hypothesis Test for Chi-Square Test
1. State the null and alternative hypotheses and the level of significance
Ho : the two variables are independent (this means that the one variable is not
affected by the other)
HA : the two variables are dependent (this means that the one variable is affected
by the other)
Also, state your α level here.
2. State and check the assumptions for the hypothesis test
a. A random sample is taken.
b. Expected frequencies for each cell are greater than or equal to 5 (The expected
frequencies, E, will be calculated later, and this assumption means E ≥ 5 ).
3. Find the test statistic and p-value
Finding the test statistic involves several steps. First the data is collected and
counted, and then it is organized into a table (in a table each entry is called a cell).
These values are known as the observed frequencies, which the symbol for an
observed frequency is O. Each table is made up of rows and columns. Then each
row is totaled to give a row total and each column is totaled to give a column
total.
Chapter 11: Chi-Squared Tests and ANOVA
360
The null hypothesis is that the variables are independent. Using the multiplication.
Please Subscribe to this Channel for more solutions and lectures
http://www.youtube.com/onlineteaching
Chapter 11: Goodness-of-Fit and Contingency Tables
11.2: Contingency Tables
36086 Topic Discussion3Number of Pages 2 (Double Spaced).docxrhetttrevannion
36086 Topic: Discussion3
Number of Pages: 2 (Double Spaced)
Number of sources: 1
Writing Style: APA
Type of document: Essay
Academic Level:Master
Category: Psychology
Language Style: English (U.S.)
Order Instructions: Attached
I will upload the instructions
Reference/Module
Learning Objectives
•Explain what the x2 goodness-of-fit test is and what it does.
•Calculate a x2 goodness-of-fit test.
•List the assumptions of the x2 goodness-of-fit test.
•Calculate the x2 test of independence.
•Interpret the x2 test of independence.
•Explain the assumptions of the x2 test of independence.
The Chi-Square (x2) Goodness-of-Fit test: What It Is and What It Does
The chi-square (x2) goodness-of-fit test is used for comparing categorical information against what we would expect based on previous knowledge. As such, it tests what are called observed frequencies (the frequency with which participants fall into a category) against expected frequencies (the frequency expected in a category if the sample data represent the population). It is a nondirectional test, meaning that the alternative hypothesis is neither one-tailed nor two-tailed. The alternative hypothesis for a x2 goodness-of-fit test is that the observed data do not fit the expected frequencies for the population, and the null hypothesis is that they do fit the expected frequencies for the population. There is no conventional way to write these hypotheses in symbols, as we have done with the previous statistical tests. To illustrate the x2 goodness-of-fit test, let's look at a situation in which its use would be appropriate.
chi-square (x2) goodness-of-fit test A nonparametric inferential procedure that determines how well an observed frequency distribution fits an expected distribution.
observed frequencies The frequency with which participants fall into a category.
expected frequencies The frequency expected in a category if the sample data represent the population.
Calculations for the x2 Goodness-of-Fit Test
Suppose that a researcher is interested in determining whether the teenage pregnancy rate at a particular high school is different from the rate statewide. Assume that the rate statewide is 17%. A random sample of 80 female students is selected from the target high school. Seven of the students are either pregnant now or have been pregnant previously. The χ2goodness-of-fit test measures the observed frequencies against the expected frequencies. The observed and expected frequencies are presented in Table 21.1.
TABLE 21.1Observed and expected frequencies for χ2 goodness-of-fit example
FREQUENCIES
PREGNANT
NOT PREGNANT
Observed
7
73
Expected
14
66
As can be seen in the table, the observed frequencies represent the number of high school females in the sample of 80 who were pregnant versus not pregnant. The expected frequencies represent what we would expect based on chance, given what is known about the population. In this case, we would expect 17% of the females to be pregnant .
Please Subscribe to this Channel for more solutions and lectures
http://www.youtube.com/onlineteaching
Chapter 11: Goodness-of-Fit and Contingency Tables
11.1: Goodness of Fit Notation
Please Subscribe to this Channel for more solutions and lectures
http://www.youtube.com/onlineteaching
Elementary Statistics Practice Test 5
Module 5
Chapter 10: Correlation and Regression
Chapter 11: Goodness of Fit and Contingency Tables
Chapter 12: Analysis of Variance
Categorical Data and Statistical AnalysisMichael770443
In this presentation, we will introduce two tests and hypothesis testing based on it, and different non-parametric methods such as the Kolmogorov-Smirnov test, the Wilcoxon’s signed-rank test, the Mann-Whitney U test, and the Kruskal-Wallis test.
The ppt cover General Introduction to the topic,
Description of CHI-SQUARE TEST, Contingency table, Degree of Freedom, Determination of Chi – square test, Assumption for validity of chi - square test, Characteristics , Applications, Limitations
A chi-squared test (χ2) is basically a data analysis on the basis of observations of a random set of variables. Usually, it is a comparison of two statistical data sets. This test was introduced by Karl Pearson in 1900 for categorical data analysis and distribution. So, it was mentioned as Pearson’s chi-squared test.
In general, a factorial experiment involves several variables.
One variable is the response variable, which is sometimes called the outcome variable or the dependent variable.
The other variables are called factors.
CompetencyAnalyze how human resource standards and practices.docxbartholomeocoombs
Competency
Analyze how human resource standards and practices within the healthcare field support organizational mission, visions, and values.
Scenario
Wynn Regional Medical Center (WRMC) is the premier hospital in your area. The hospital has been in your city for over 100 years. Over the past decade, the hospital has been losing money for various reasons, though primarily due to uncompensated care. You were recently hired as the Vice President for Human Resources at WRMC, and part of your responsibilities include presenting historical information to participants of the new employee orientation.
Instructions
Create a PowerPoint presentation detailing the changing nature of the healthcare workforce. The presentation should contain speaker notes for each slide or voiceover narration. The presentation should address the following topics and questions:
Historical information on the changing healthcare workforce
How have legislation and policies changed in the past decade?
How have patient demographics changed in the past decade (baby boomers, generation X, millennials, ethnicities)?
How have patient centric approaches changed in the past decade (use of the Internet and social media to gather health information)?
Challenges associated with the changing healthcare workforce
What are some of the challenges associated with the policy and legislative changes?
What are some challenges associated with demographic changes?
What are some of the challenges associated with patients “researching” their own health instead of going to the doctor?
Current state of healthcare
What have been some of the improvements to the healthcare system over the last decade?
Resources
This
link
has information for creating a PowerPoint presentation.
Here is a
link
to information about adding speaker notes.
Here is a
link
to information about creating a voiceover narration using Screencast-O-Matic.
GRADING RUBRICS:
1.Clear and thorough explanation of the history of the changing healthcare workforce. Includes comprehensive descriptions with multiple supporting examples for each of the SUB-BULLET POINTS.
2. Clear and thorough discussion of the challenges associated with the changing healthcare workforce. Includes comprehensive descriptions with multiple supporting examples for each of the SUB-BULLET POINTS.
3. Comprehensive analysis of the current state of healthcare.
Includes a clear and thorough assessment of improvements to the healthcare system over the last decade and supports assertions with multiple supporting examples.
.
CompetencyAnalyze financial statements to assess performance.docxbartholomeocoombs
Competency
Analyze financial statements to assess performance and to ensure organizational improvement and long-term viability
.
Scenario
In an ongoing effort to explore the feasibility of expanding services into rural areas of the state, leadership at Memorial Hospital has determined that conducting a review of its financial condition will be essential to ensuring the organization’s ability to successfully achieve its expansion goals.
Instructions
The CFO has provided you with a copy of the organization’s
financial statements
. This information will be critical in evaluating the organization’s financial capacity to support the proposed expansion of services into the rural areas of the state.
You are asked to review these financial statements (which include the Income Statement, Statement of Cash Flows, and the Balance Sheet) and prepare an executive summary outlining the financial strength of the organization and evidence to support the expansion. Your executive summary should include the following:
An overview of the issue.
A review of critical financial ratios (Liquidity, Solvency, Profitability, and Efficiency) based on financial statements.
Inferences of forecasts, estimates, interpretations, and conclusions based on the key ratios.
Provide a recommendation based on ration analysis.
Resources
This
link
has information for creating an executive summary.
Grading Rubric:
1.
Comprehensive identification of summary of the issue. Includes multiple examples or supporting details.
2. Clear and thorough review of critical financial ratios--Liquidity, Solvency, Profitability, and Efficiency--based on financial statements. Includes multiple examples or supporting details per topic.
3. Clear and thorough inferences of forecasts, estimates, interpretations, and conclusions based on the key ratios. Includes multiple examples or supporting details per topic.
4. Comprehensive recommendation, based on ration analysis. Includes multiple examples or supporting details.
.
More Related Content
Similar to Chapter 11 Chi-Square Tests and ANOVA 359 Chapter .docx
Please Subscribe to this Channel for more solutions and lectures
http://www.youtube.com/onlineteaching
Chapter 11: Goodness-of-Fit and Contingency Tables
11.1: Goodness of Fit Notation
Please Subscribe to this Channel for more solutions and lectures
http://www.youtube.com/onlineteaching
Elementary Statistics Practice Test 5
Module 5
Chapter 10: Correlation and Regression
Chapter 11: Goodness of Fit and Contingency Tables
Chapter 12: Analysis of Variance
Categorical Data and Statistical AnalysisMichael770443
In this presentation, we will introduce two tests and hypothesis testing based on it, and different non-parametric methods such as the Kolmogorov-Smirnov test, the Wilcoxon’s signed-rank test, the Mann-Whitney U test, and the Kruskal-Wallis test.
The ppt cover General Introduction to the topic,
Description of CHI-SQUARE TEST, Contingency table, Degree of Freedom, Determination of Chi – square test, Assumption for validity of chi - square test, Characteristics , Applications, Limitations
A chi-squared test (χ2) is basically a data analysis on the basis of observations of a random set of variables. Usually, it is a comparison of two statistical data sets. This test was introduced by Karl Pearson in 1900 for categorical data analysis and distribution. So, it was mentioned as Pearson’s chi-squared test.
In general, a factorial experiment involves several variables.
One variable is the response variable, which is sometimes called the outcome variable or the dependent variable.
The other variables are called factors.
CompetencyAnalyze how human resource standards and practices.docxbartholomeocoombs
Competency
Analyze how human resource standards and practices within the healthcare field support organizational mission, visions, and values.
Scenario
Wynn Regional Medical Center (WRMC) is the premier hospital in your area. The hospital has been in your city for over 100 years. Over the past decade, the hospital has been losing money for various reasons, though primarily due to uncompensated care. You were recently hired as the Vice President for Human Resources at WRMC, and part of your responsibilities include presenting historical information to participants of the new employee orientation.
Instructions
Create a PowerPoint presentation detailing the changing nature of the healthcare workforce. The presentation should contain speaker notes for each slide or voiceover narration. The presentation should address the following topics and questions:
Historical information on the changing healthcare workforce
How have legislation and policies changed in the past decade?
How have patient demographics changed in the past decade (baby boomers, generation X, millennials, ethnicities)?
How have patient centric approaches changed in the past decade (use of the Internet and social media to gather health information)?
Challenges associated with the changing healthcare workforce
What are some of the challenges associated with the policy and legislative changes?
What are some challenges associated with demographic changes?
What are some of the challenges associated with patients “researching” their own health instead of going to the doctor?
Current state of healthcare
What have been some of the improvements to the healthcare system over the last decade?
Resources
This
link
has information for creating a PowerPoint presentation.
Here is a
link
to information about adding speaker notes.
Here is a
link
to information about creating a voiceover narration using Screencast-O-Matic.
GRADING RUBRICS:
1.Clear and thorough explanation of the history of the changing healthcare workforce. Includes comprehensive descriptions with multiple supporting examples for each of the SUB-BULLET POINTS.
2. Clear and thorough discussion of the challenges associated with the changing healthcare workforce. Includes comprehensive descriptions with multiple supporting examples for each of the SUB-BULLET POINTS.
3. Comprehensive analysis of the current state of healthcare.
Includes a clear and thorough assessment of improvements to the healthcare system over the last decade and supports assertions with multiple supporting examples.
.
CompetencyAnalyze financial statements to assess performance.docxbartholomeocoombs
Competency
Analyze financial statements to assess performance and to ensure organizational improvement and long-term viability
.
Scenario
In an ongoing effort to explore the feasibility of expanding services into rural areas of the state, leadership at Memorial Hospital has determined that conducting a review of its financial condition will be essential to ensuring the organization’s ability to successfully achieve its expansion goals.
Instructions
The CFO has provided you with a copy of the organization’s
financial statements
. This information will be critical in evaluating the organization’s financial capacity to support the proposed expansion of services into the rural areas of the state.
You are asked to review these financial statements (which include the Income Statement, Statement of Cash Flows, and the Balance Sheet) and prepare an executive summary outlining the financial strength of the organization and evidence to support the expansion. Your executive summary should include the following:
An overview of the issue.
A review of critical financial ratios (Liquidity, Solvency, Profitability, and Efficiency) based on financial statements.
Inferences of forecasts, estimates, interpretations, and conclusions based on the key ratios.
Provide a recommendation based on ration analysis.
Resources
This
link
has information for creating an executive summary.
Grading Rubric:
1.
Comprehensive identification of summary of the issue. Includes multiple examples or supporting details.
2. Clear and thorough review of critical financial ratios--Liquidity, Solvency, Profitability, and Efficiency--based on financial statements. Includes multiple examples or supporting details per topic.
3. Clear and thorough inferences of forecasts, estimates, interpretations, and conclusions based on the key ratios. Includes multiple examples or supporting details per topic.
4. Comprehensive recommendation, based on ration analysis. Includes multiple examples or supporting details.
.
CompetencyAnalyze ethical and legal dilemmas that healthcare.docxbartholomeocoombs
Competency
Analyze ethical and legal dilemmas that healthcare workers may encounter in the medical field.
Instructions
You have recently been promoted to Health Services Manager at Three Mountains Regional Hospital, a small hospital located in a mid-size city in the Midwest. Three Mountains is a general medical and surgical facility with 400 beds. Last year there were approximately 62,000 emergency visits and 15,000 admissions. More than 6,000 outpatient and 10,000 inpatient surgeries were performed.
An important aspect of the provider/patient relationship pertains to open communication and trust. Patients want to know that their doctors and the support staff associated with their care understand their wishes and will abide by them. Ideally, these conversations happen well before an emergency or procedure takes place; however, often times this information is missing from a patient's file. As part of Three Mountains' initiative to build trust with their patients, an increased emphasis has been placed on obtaining living wills from the patient as part of the intake process to ensure that the healthcare team has written directives of the patient's wishes in case of incapacitation. You will be creating a living will for a patient and provide educational information as to why the patient should fill it out during the admission process before a procedure.
Introduction:
Explain the definition of a living will and its key components. This section will provide an educational overview of the document for the patient.
Living Will Template:
Create a living will that can serve as a template to the patients. This should cover the basic treatment issues such as resuscitation, feeding tubes, ventilation, organ and tissue donations, etc. Provide instructions in the template that can be easily altered, depending on each patient's wishes.
Summary:
In this section, you will discuss the importance of this document and encourage patients to complete it. Address how this document ensures that a patient's wishes are known and followed by the healthcare team.
NOTE
- APA formatting and proper grammar, punctuation, and form required. APA help is available
here.
.
CompetencyAnalyze ethical and legal dilemmas that healthcare wor.docxbartholomeocoombs
Competency
Analyze ethical and legal dilemmas that healthcare workers may encounter in the medical field.
Instructions
You have recently been promoted to Health Services Manager at Three Mountains Regional Hospital, a small hospital located in a mid-size city in the Midwest. Three Mountains is a general medical and surgical facility with 400 beds. Last year there were approximately 62,000 emergency visits and 15,000 admissions. More than 6,000 outpatient and 10,000 inpatient surgeries were performed.
An important aspect of the provider/patient relationship pertains to open communication and trust. Patients want to know that their doctors and the support staff associated with their care understand their wishes and will abide by them. Ideally, these conversations happen well before an emergency or procedure takes place; however, often times this information is missing from a patient's file. As part of Three Mountains' initiative to build trust with their patients, an increased emphasis has been placed on obtaining living wills from the patient as part of the intake process to ensure that the healthcare team has written directives of the patient's wishes in case of incapacitation. You will be creating a living will for a patient and provide educational information as to why the patient should fill it out during the admission process before a procedure.
Introduction:
Explain the definition of a living will and its key components. This section will provide an educational overview of the document for the patient.
Living Will Template:
Create a living will that can serve as a template to the patients. This should cover the basic treatment issues such as resuscitation, feeding tubes, ventilation, organ and tissue donations, etc. Provide instructions in the template that can be easily altered, depending on each patient's wishes.
Summary:
In this section, you will discuss the importance of this document and encourage patients to complete it. Address how this document ensures that a patient's wishes are known and followed by the healthcare team.
NOTE
- APA formatting and proper grammar, punctuation, and form required.
.
CompetencyAnalyze collaboration tools to support organizatio.docxbartholomeocoombs
Competency
Analyze collaboration tools to support organizational goals.
Scenario
You are a new manager at Elliot Building Supplies International who has seen huge success in managing your global team remotely. This success has been shown in the team outcomes/production and employee satisfaction and engagement. Senior leadership has taken notice of your success and has asked you to create a presentation to share with your peers, who also manage remotely, that explains the best collaboration tools for remote teams. Also, you will explain the best way to manage effectively and create a motivating and satisfying work environment that supports collaboration.
Instructions
You will need to include the following in your PowerPoint presentation.
Presentation welcome/introduction slide.
Collaboration tools that you have used to be successful.
This should include at least 4 different types of tools.
Each type should be explained in detail, along with the benefits it provides.
Critical skills to successfully manage remote employees.
Closing slide to share final thoughts and ideas.
.
Competency Checklist and Professional Development Resources .docxbartholomeocoombs
Competency Checklist and Professional Development Resources
An important and yet often overlooked function of leadership in an early childhood program is the ability to positively influence the people in the program. For this group assignment, consider the characteristics of a leader who can support and lead teachers in reflective teaching. This type of self-reflection is the first step to understanding how a supervisor supports teachers to accomplish their goals through mentoring. For this assignment, your group will need to address the following two components:
Part 1
: Consider the following question as your group completes the competency checklist below: What might be evidence that a teacher leader possesses the competence to also be a mentor? You are encouraged to evenly divide the competencies among your group, so that each member contributes to providing brief examples of interactions while highlighting the characteristic(s) that demonstrates each competency. While this portion can be completed independently, you should then collaborate to ensure that each group member provides feedback before submitting the full collaborative document.
Competency Checklist
Competency
Describe an example of a teacher-leader with children (when acting as a teacher)
Describe an example of a teacher-leader with adults (when acting as a supervisor)
Listens well, does not interrupt, and respects the pace of the other person
Is able to wait for others to discover solutions, form own ideas, and reflect
Asks questions that encourage details
Is aware of and comfortable with his or her feelings and the emotions of others
Is responsive to others
Guides, nurtures, supports, and empathizes
Integrates emotion and intellect
Fosters reflection or wondering by others
Is aware of how others’ reactions affect a process of dialogue and reflection, including sensitivity to bias and cultural context
Is willing to have consistent and predictable meeting times and places
Is flexible and available
Is able to form trusting relationships
Part 2:
Professional Development Resources Document
–Early childhood programs have numerous curriculum options which may contribute to a need to support teachers and staff in a curriculum context they are not familiar with. Therefore, as we prepare to support protégés, we can refer to the National Association of the Education of Young Children core standards for professional development, to promote the use of best practices. These six core standards, briefly describe what early childhood professionals should know and be able to do. After reading each of the
NAEYC Standards for Early Childhood Professional Preparation Programs (Links to an external site.)
, focus on the first four standards:
STANDARD 1.
PROMOTING CHILD DEVELOPMENT AND LEARNING
STANDARD 2.
BUILDING FAMILY AND COMMUNITY RELATIONSHIPS
STANDARD 3.
OBSERVING, DOCUMENTING, AND ASSESSING TO SUPPORT YOUNG CHILDREN AND FAMILIES
STANDARD 4.
US.
Competency 6 Enagage with Communities and Organizations (3 hrs) (1 .docxbartholomeocoombs
Competency 6: Enagage with Communities and Organizations (3 hrs) (1 to 2 Pages)
Behavior: use empathy, reflection, and interpersonal skills to effectively engage diverse clients and constituencies.
For this assignment, you are to explore how your community is addressing the needs of its citizens during the CoVID 19 situation. Explore how you can consult and connect with community leaders and organizations to be a part of solutions in your community. Provide a detailed account of your exploration of community needs, as well as how you participated at the community level to address the needs of your community.
.
Competency 2 Examine the organizational behavior within busines.docxbartholomeocoombs
Competency 2: Examine the organizational behavior within business systems
Provide the name of the corporation you will be using as the basis for this project.
Provide the organization’s purpose or mission statement.
Describe the organization's industry.
Provide the name and position of the person interviewed during this portion of the assignment (indicate as much pertinent information (e.g., length of service with company, previous roles in the company, educational background, etc.).
Provide the list of interview questions you asked the manager/executive.
Indicate which two - three of the following concepts from this competency that you intend to evaluate the organization/team on and describe the company’s/team’s current situation with each topic you’ve selected:
Motivational theories
Psychological contract
Job design
Use of evaluation, feedback and rewards
Misbehavior
Individual or organizational stress
Provide citations in APA format for any references
.
CompetenciesEvaluate the challenges and benefits of employ.docxbartholomeocoombs
Competencies
Evaluate the challenges and benefits of employing a diverse workforce.
Design a plan for conducting business and managing employees in a global society.
Critique the actions of organizations as they integrate diverse perspectives into their cultures.
Evaluate the role of identity, diverse segments, and cultural backgrounds within organizations.
Attribute different cultural perspectives to current social-cultural dimensions.
Analyze the importance of managing a diverse workforce.
Scenario Information
Your company has been nominated for a national diversity award associated with your efforts and dedication to diversity initiatives in the workplace and their impact on the organization and community. You have been asked to summarize your efforts for the year in a slide presentation for the diversity committee who selects the winner. Be sure to include details of the changes you made in your organization and the impact the changes made.
Instructions
As part of your nomination, you have been asked to create a slide presentation including a voice recording for your entry (Voice Recording not needed). Remember your audience when giving your presentation and include the following slides:
Title slide
Highlighting the importance of workplace diversity
Discussing the points that were included in your diversity plan
Describing how culture and inclusion impact your organization
Providing examples of how diverse workgroups work together in the workplace
Gives examples of strategies used to incorporate Hofstede's cultural dimensions in a global workforce
Provides best practices for managers associated with managing a diverse, global workforce
Conclusion slide that includes a summary of why you should win this award
Any additional, relevant information
References
.
CompetenciesDescribe the supply chain management principle.docxbartholomeocoombs
Competencies
Describe the supply chain management principles through the flow of information, materials, services, and resources.
Analyze the external and internal drivers that influence supply chain principles.
Evaluate supply chain management operational best practices.
Compare the nature of logistics operations and services in both international and domestic contexts.
Apply strategic supply chain management to logistics systems.
Analyze different software systems and technology strategies used in supply chain management.
Scenario
You have just been promoted to Senior Analyst at Mitchell Consulting, a firm that specializes in providing managerial expertise in supply chain management. After completing many assignments under the supervision of a Senior Analyst, your role now allows you to make selections for clients. You are assigned a new client, Scent
Solution
s. Your new manager, Partner Ronda Anderson, has directed you to work on this case and provide analysis and options to resolve the problems directly to the client.
Scent
.
CompetenciesABCDF1.1 Create oral, written, or visual .docxbartholomeocoombs
Competencies
A
B
C
D
F
1.1: Create oral, written, or visual communications appropriate to the audience, purpose, and context.
4 points
Key Criteria: Tailors communication to purpose, context, and target audience. Clearly articulates the thesis and purpose, and supports the thesis and purpose with authentic and appropriate evidence. Provides smooth transitions and leaves no awkward gaps from point to point. Shows coherent progress from the introduction to the conclusion with no unnecessary sections.
3 points
Key Criteria: Tailors communication to purpose, context, and target audience. Articulates the thesis and purpose, and supports the thesis and purpose with authentic and appropriate evidence. Generally provides smooth transitions and leaves few awkward gaps from point to point. Shows identifiable progress from the introduction to the conclusion with no unnecessary sections.
2 points
Key Criteria: Considers the purpose, context, and target audience. Articulates the thesis and purpose, and shows some evidence supporting both. Some transitions are not smooth, and there are occasional gaps or awkward connections from point to point. There is a sense of progress from the introduction through the conclusion, but the organization may not be completely clear.
1 point
Key Criteria: Does not tailor communication well in terms of purpose, context, and target audience. Provides a weak thesis, unclear purpose, and little or no evidence to support points. Transitions may be rough or nonexistent, and there are significant gaps or connections between points that leave sections incomprehensible. Progress from the introduction through the conclusion is difficult to decipher, and there may be some material that is unrelated to thesis and purpose.
0 points
Key Criteria: Does not tailor communication in terms of purpose, context, and target audience. Lacks a good thesis and has little or no evidence to support a thesis. Transitions are rough or nonexistent, and there are few discernable connections from point to point. There is no identifiable progress from the introduction through the conclusion, and/or there is substantial material that is unrelated to thesis and purpose.
1.2: Communicate using appropriate writing conventions, including spelling, grammar, mechanics, word choice, and format.
4 points
Uses a format that is highly appropriate to the writing task and carefully tailors the style and tone to the specific audience. Aligns both the writing style and grammar usage to standards appropriate to the task.
3 points
Uses a format that is appropriate to the writing task and tailors the style and tone to the specific audience. Aligns both the writing style and grammar usage to standards appropriate to the task.
2 points
Generally has a clear purpose, but there may be a gap between the format used and the writing task. Fails to fully align the style and tone to the audience, or fails to fully define the audience for the writing task. Has some style or grammar.
COMPETENCIES734.3.4 Healthcare Utilization and Finance.docxbartholomeocoombs
COMPETENCIES
734.3.4
:
Healthcare Utilization and Finance
The graduate analyzes financial implications related to healthcare delivery, reimbursement, access, and national initiatives.
INTRODUCTION
It is essential that nurses understand the issues related to healthcare financing, including local, state, and national healthcare policies and initiatives that affect healthcare delivery. As a patient advocate, the professional nurse is in a position to work with patients and families to access available resources to meet their healthcare needs.
REQUIREMENTS
Your submission must be your original work. No more than a combined total of 30% of the submission and no more than a 10% match to any one individual source can be directly quoted or closely paraphrased from sources, even if cited correctly. An originality report is provided when you submit your task that can be used as a guide.
You must use the rubric to direct the creation of your submission because it provides detailed criteria that will be used to evaluate your work. Each requirement below may be evaluated by more than one rubric aspect. The rubric aspect titles may contain hyperlinks to relevant portions of the course.
A. Compare the U.S. healthcare system with the healthcare system of Great Britain, Japan, Germany, or Switzerland, by doing the following:
1. Identify
one
country from the following list whose healthcare system you will compare to the U.S. healthcare system: Great Britain, Japan, Germany, or Switzerland.
2. Compare access between the
two
healthcare systems for children, people who are unemployed, and people who are retired.
a. Discuss coverage for medications in the two healthcare systems.
b. Determine the requirements to get a referral to see a specialist in the two healthcare systems.
c. Discuss coverage for preexisting conditions in the two healthcare systems.
3. Explain
two
financial implications for patients with regard to the healthcare delivery differences between the two countries (i.e.; how are the patients financially impacted).
B. Acknowledge sources, using in-text citations and references, for content that is quoted, paraphrased, or summarized.
C. Demonstrate professional communication in the content and presentation of your submission.
File Restrictions
File name may contain only letters, numbers, spaces, and these symbols: ! - _ . * ' ( )
File size limit: 200 MB
File types allowed: doc, docx, rtf, xls, xlsx, ppt, pptx, odt, pdf, txt, qt, mov, mpg, avi, mp3, wav, mp4, wma, flv, asf, mpeg, wmv, m4v, svg, tif, tiff, jpeg, jpg, gif, png, zip, rar, tar, 7z
RUBRIC
A1:COUNTRY TO COMPARE
NOT EVIDENT
A country for comparison is not identified.
APPROACHING COMPETENCE
The identified country for comparison is not from the given list.
COMPETENT
The identified country for comparison is from the given list.
A2:ACCESS
NOT EVIDENT
A comparison of healthcare system access is not provided.
APPROACHING COMPETENCE
The comparison does not acc.
Competencies and KnowledgeWhat competencies were you able to dev.docxbartholomeocoombs
Competencies and Knowledge
What competencies were you able to develop in researching and writing the course Comprehensive Project? How did you leverage knowledge gained in the assignments (Units 1–4) in completing the Comprehensive Project? How will these competencies and knowledge support your career advancement in management
.
Competencies and KnowledgeThis assignment has 2 parts.docxbartholomeocoombs
Competencies and Knowledge
This assignment has 2 parts:
What competencies were you able to develop in researching and writing the course Comprehensive Project? How did you leverage knowledge gained in the intellipath assignments (Units 1- 4) in completing the Comprehensive Project? How will these competencies and knowledge support your career advancement in management?
Discuss the similarities and differences between shareholder wealth maximization and stakeholder wealth maximization.
.
Competencies and KnowledgeThis assignment has 2 partsWhat.docxbartholomeocoombs
Competencies and Knowledge
This assignment has 2 parts:
What competencies were you able to develop in researching and writing the course Comprehensive Project? How did you leverage knowledge gained in the intellipath assignments (Units 1- 4) in completing the Comprehensive Project? How will these competencies and knowledge support your career advancement in management?
Discuss the similarities and differences between shareholder wealth maximization and stakeholder wealth maximization.
.
Competences, Learning Theories and MOOCsRecent Developments.docxbartholomeocoombs
Competences, Learning Theories and MOOCs:
Recent Developments in Lifelong Learning
Karl Steffens
Introduction
We think of our societies as ‘knowledge societies’ in which lifelong learning is
becoming increasingly important. Lifelong learning refers to the idea that people
not only learn in schools and universities, but also in non-formal and informal
ways during their lifespan.The concepts of lifelong learning and lifelong education
began to enter the discourse on educational policies in the late 1960s (Tuijnman
& Boström, 2002). However, these are related, but distinct concepts. As Lee (2014,
p. 472) notes ‘the terminological change (from lifelong education, continuing
education and adult education, to lifelong learning) reflects a conceptual departure
from the idea of organised educational provision to that of a more individualised
pursuit of learning’.
One of the first important documents on lifelong learning was the report of the
International Commission on the Development of Education to UNESCO in
1972, titled ‘Learning to be. The world of education today and tomorrow’. In his
introductory letter to the Director-General of UNESCO, the chairman of the
Commission, Edgar Faure, stated that the work of the Commission was based on
four assumptions (see Elfert pp. and Carneiro pp. in this issue). The first was
related to the idea that there was an international community which was united by
common aspirations and the second was the belief in democracy and in education
as its keystones. The third was ‘that the aim of development is the complete
fulfilment of man, in all the richness of his personality, the complexity of his forms
of expression and his various commitments — as individual, member of a family
and of a community, citizen and producer, inventor of techniques and creative
dreamer’. The last assumption was that ‘only an over-all, lifelong education can
produce the kind of complete man, the need for whom is increasing with the
continually more stringent constraints tearing the individual asunder’ (Faure,
1972, p. vi).
Following the Faure Report, the UNESCO Institute for Education, which
was founded in Germany in 1951, started to focus on lifelong learning and
subsequently became the UNESCO Institute for Lifelong Learning (UIL, http://
uil.unesco.org/home/). It was under its leadership that a formal model of lifelong
education was developed and published in the book ‘Towards a System of Life-
long Education’ (Cropley, 1980). The concept of lifelong learning also became
manifest in the ‘Education for All’ (EFA) agenda that was launched at the World
Conference on Education for All which took place in Jomtien (Thailand) in
1990 (Inter-Agency Commission, 1990). Ten years later, at the World Education
Forum in Dakar (Senegal) in 2000, the Dakar Framework for Action was
designed ‘to enable all individuals to realize their right to learn and to fulfil their
responsibility to contribute to the development of their society’ (UNESCO,
2000, p..
Compensation & Benefits Class 700 words with referencesA stra.docxbartholomeocoombs
Compensation & Benefits Class 700 words with references
A strategic purpose for a well-blended compensation program, one that includes various types of direct compensation, is gaining employee commitment and productivity. One of the most effective tactics for this strategy is designing a process for linking individual achievement to organizational goals.
Prepare a report to senior leaders addressing the following:
·
Explain the concept of tying performance to organizational goals.
·
Describe the different types of individual and group-level performance measurements.
·
What are the advantages and disadvantages of individual versus group-level performance recognition?
·
Discuss the options an organization has to link individual or group monetary rewards to organizational success.
·
Develop recommendations for how to implement, monitor, and evaluate such a program.
.
Compensation, Benefits, Reward & Recognition Plan for V..docxbartholomeocoombs
Compensation, Benefits, Reward & Recognition Plan for V.P. Operations
Learning Team B
HRM 595
December 19, 2017
Rosalie M. Lopez
Running head: COMPENSATION, BENEFITS, REWARD & RECOGNITION PLAN
1
COMPENSATION, BENEFITS, REWARD & RECOGNITION PLAN
2
Compensation, Benefits, Reward & Recognition Plan for V.P. Operations
Introduction
Base Salary Range
For the position of VP of Operations, the National Average Salary is $122,624. In San Francisco, the average is higher and placed at $155,946. This amount is 16% higher than the National Average (Payscale, 2016). The reason for this increase is because of experience and geography. These are the two prime factors that impact the pay scale. Another major factor is the employer. Most employers base their decision to hire an individual on the experience they bring with them. Of course, with more experience, higher pay is required. With our company cutting cost a less experienced individual would be the best fit for the position.
Standard Employee Benefit
In many cases, your employee benefits could be the turning point for a prospective employee. This benefit is a vital portion of any employee packet. These valuable benefits are used as a blanket of security in the case of any sickness, injury, unemployment, old age, or death (Gomez-Mejia, Balkin & Cardy, 2015, p. 362). There is a significant difference between incentives and benefits: benefits are financial and nonfinancial compensations that are indirect to the employee. To have a competitive strategy Blossoms Up! must align their profits with the compensation package that has been already put in place. This action will help provide flexibility to the amount and the benefits available (Gomez-Mejia et al., 2015).
There are also some benefits that most companies are legally obligated to provide. Three benefits are required regardless of the number of employees that the company has. These interests involve social security, workers compensation, and unemployment insurance (Gomez-Mejia et al., 2015). Other laws must be adhered to when dealing with a certain number of individuals. When a company has 50 or more employee they must have the Family and Medical Leave Act in place and since its induction in 2015 the Affordable Care Act for Health Insurance for companies with 20 or more employees. For the health insurance to be considered standard medical, vision and dental plans must be made available to the business. These programs that must be regarded as being under the Health Maintenance Organization (HMO) or a Preferred Provider Organization (PPO) (Gomez-Mejia et al., 2015).
There are some voluntary benefits that we can include. We are already looking into adding a pension package using the Defined Contribution Plan as well as the 401(K) plan (Gomez-Mejia et al., 2015). Life insurance is another excellent benefit that could be added to the package as well as short-term and long-term disability insurance. Adding Vacation and PTO, and Holiday pay is .
Compete the following tablesTheoryKey figuresKey concepts o.docxbartholomeocoombs
Compete the following tables:
Theory
Key figures
Key concepts of personality formation
Explanation of the disordered personality
Scientific credibility
Comprehensiveness
Applicability
Attachment
Complete the following...200-300 words..
Is Freud's theory a viable theory for this century?
Provide reasons for
your
view.
.
The Indian economy is classified into different sectors to simplify the analysis and understanding of economic activities. For Class 10, it's essential to grasp the sectors of the Indian economy, understand their characteristics, and recognize their importance. This guide will provide detailed notes on the Sectors of the Indian Economy Class 10, using specific long-tail keywords to enhance comprehension.
For more information, visit-www.vavaclasses.com
Instructions for Submissions thorugh G- Classroom.pptxJheel Barad
This presentation provides a briefing on how to upload submissions and documents in Google Classroom. It was prepared as part of an orientation for new Sainik School in-service teacher trainees. As a training officer, my goal is to ensure that you are comfortable and proficient with this essential tool for managing assignments and fostering student engagement.
The French Revolution, which began in 1789, was a period of radical social and political upheaval in France. It marked the decline of absolute monarchies, the rise of secular and democratic republics, and the eventual rise of Napoleon Bonaparte. This revolutionary period is crucial in understanding the transition from feudalism to modernity in Europe.
For more information, visit-www.vavaclasses.com
Operation “Blue Star” is the only event in the history of Independent India where the state went into war with its own people. Even after about 40 years it is not clear if it was culmination of states anger over people of the region, a political game of power or start of dictatorial chapter in the democratic setup.
The people of Punjab felt alienated from main stream due to denial of their just demands during a long democratic struggle since independence. As it happen all over the word, it led to militant struggle with great loss of lives of military, police and civilian personnel. Killing of Indira Gandhi and massacre of innocent Sikhs in Delhi and other India cities was also associated with this movement.
The Art Pastor's Guide to Sabbath | Steve ThomasonSteve Thomason
What is the purpose of the Sabbath Law in the Torah. It is interesting to compare how the context of the law shifts from Exodus to Deuteronomy. Who gets to rest, and why?
Unit 8 - Information and Communication Technology (Paper I).pdfThiyagu K
This slides describes the basic concepts of ICT, basics of Email, Emerging Technology and Digital Initiatives in Education. This presentations aligns with the UGC Paper I syllabus.
Ethnobotany and Ethnopharmacology:
Ethnobotany in herbal drug evaluation,
Impact of Ethnobotany in traditional medicine,
New development in herbals,
Bio-prospecting tools for drug discovery,
Role of Ethnopharmacology in drug evaluation,
Reverse Pharmacology.
Palestine last event orientationfvgnh .pptxRaedMohamed3
An EFL lesson about the current events in Palestine. It is intended to be for intermediate students who wish to increase their listening skills through a short lesson in power point.
This is a presentation by Dada Robert in a Your Skill Boost masterclass organised by the Excellence Foundation for South Sudan (EFSS) on Saturday, the 25th and Sunday, the 26th of May 2024.
He discussed the concept of quality improvement, emphasizing its applicability to various aspects of life, including personal, project, and program improvements. He defined quality as doing the right thing at the right time in the right way to achieve the best possible results and discussed the concept of the "gap" between what we know and what we do, and how this gap represents the areas we need to improve. He explained the scientific approach to quality improvement, which involves systematic performance analysis, testing and learning, and implementing change ideas. He also highlighted the importance of client focus and a team approach to quality improvement.
Chapter 11 Chi-Square Tests and ANOVA 359 Chapter .docx
1. Chapter 11: Chi-Square Tests and ANOVA
359
Chapter 11: Chi-Square and ANOVA Tests
This chapter presents material on three more hypothesis tests.
One is used to determine
significant relationship between two qualitative variables, the
second is used to determine
if the sample data has a particular distribution, and the last is
used to determine
significant relationships between means of 3 or more samples.
Section 11.1: Chi-Square Test for Independence
Remember, qualitative data is where you collect data on
individuals that are categories or
names. Then you would count how many of the individuals had
particular qualities. An
example is that there is a theory that there is a relationship
between breastfeeding and
autism. To determine if there is a relationship, researchers
could collect the time period
that a mother breastfed her child and if that child was diagnosed
with autism. Then you
would have a table containing this information. Now you want
to know if each cell is
independent of each other cell. Remember, independence says
that one event does not
affect another event. Here it means that having autism is
independent of being breastfed.
2. What you really want is to see if they are not independent. In
other words, does one
affect the other? If you were to do a hypothesis test, this is
your alternative hypothesis
and the null hypothesis is that they are independent. There is a
hypothesis test for this
and it is called the Chi-Square Test for Independence.
Technically it should be called
the Chi-Square Test for Dependence, but for historical reasons
it is known as the test for
independence. Just as with previous hypothesis tests, all the
steps are the same except for
the assumptions and the test statistic.
Hypothesis Test for Chi-Square Test
1. State the null and alternative hypotheses and the level of
significance
Ho : the two variables are independent (this means that the one
variable is not
affected by the other)
HA : the two variables are dependent (this means that the one
variable is affected
by the other)
Also, state your α level here.
2. State and check the assumptions for the hypothesis test
a. A random sample is taken.
b. Expected frequencies for each cell are greater than or equal
to 5 (The expected
frequencies, E, will be calculated later, and this assumption
means E ≥ 5 ).
3. 3. Find the test statistic and p-value
Finding the test statistic involves several steps. First the data is
collected and
counted, and then it is organized into a table (in a table each
entry is called a cell).
These values are known as the observed frequencies, which the
symbol for an
observed frequency is O. Each table is made up of rows and
columns. Then each
row is totaled to give a row total and each column is totaled to
give a column
total.
Chapter 11: Chi-Squared Tests and ANOVA
360
The null hypothesis is that the variables are independent. Using
the multiplication
rule for independent events you can calculate the probability of
being one value of
the first variable, A, and one value of the second variable, B
(the probability of a
particular cell P A and B( ) ). Remember in a hypothesis test,
you assume that H0
is true, the two variables are assumed to be independent.
P A and B( ) = P A( ) ⋅ P B( ) if A and B are independent
= number of ways A can happen
4. total number of individuals
⋅ number of ways B can happen
total number of individuals
= row total
n
*
column total
n
Now you want to find out how many individuals you expect to
be in a certain cell.
To find the expected frequencies, you just need to multiply the
probability of that
cell times the total number of individuals. Do not round the
expected frequencies.
Expected frequency cell A and B( ) = E A and B( )
= n row total
n
⋅ column total
n
⎛
⎝⎜
⎞
⎠⎟
5. = row total ⋅ column total
n
If the variables are independent the expected frequencies and
the observed
frequencies should be the same. The test statistic here will
involve looking at the
difference between the expected frequency and the observed
frequency for each
cell. Then you want to find the “total difference” of all of these
differences. The
larger the total, the smaller the chances that you could find that
test statistic given
that the assumption of independence is true. That means that
the assumption of
independence is not true. How do you find the test statistic?
First find the
differences between the observed and expected frequencies.
Because some of
these differences will be positive and some will be negative,
you need to square
these differences. These squares could be large just because the
frequencies are
large, you need to divide by the expected frequencies to scale
them. Then finally
add up all of these fractional values. This is the test statistic.
Test Statistic:
The symbol for Chi-Square is χ
2
6. χ 2 =
O − E( )2
E∑
where O is the observed frequency and E is the expected
frequency
Chapter 11: Chi-Square Tests and ANOVA
361
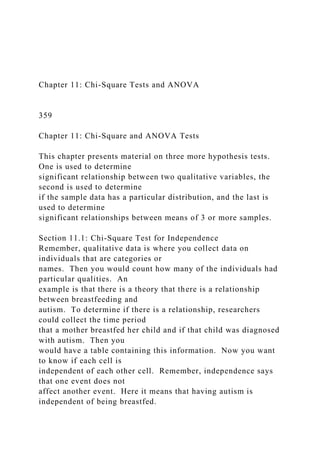
Distribution of Chi-Square
χ
2 has different curves depending on the degrees of freedom. It
is skewed to the
right for small degrees of freedom and gets more symmetric as
the degrees of
freedom increases (see figure #11.1.1). Since the test statistic
involves squaring
the differences, the test statistics are all positive. A chi-
squared test for
independence is always right tailed.
Figure #11.1.1: Chi-Square Distribution
7. p-value:
Use χcdf lower limit,1E99, df( )
Where the degrees of freedom is df = # of rows−1( )* # of
columns−1( )
4. Conclusion
This is where you write reject Ho or fail to reject Ho . The
rule is: if the p-value
< α , then reject Ho . If the p-value ≥α , then fail to reject Ho
5. Interpretation
This is where you interpret in real world terms the conclusion to
the test. The
conclusion for a hypothesis test is that you either have enough
evidence to show
HA is true, or you do not have enough evidence to show HA is
true.
Example #11.1.1: Hypothesis Test with Chi-Square Test Using
Formula
Is there a relationship between autism and breastfeeding? To
determine if there
is, a researcher asked mothers of autistic and non-autistic
children to say what
time period they breastfed their children. The data is in table
#11.1.1 (Schultz,
Klonoff-Cohen, Wingard, Askhoomoff, Macera, Ji & Bacher,
2006). Do the data
8. provide enough evidence to show that that breastfeeding and
autism are
independent? Test at the1% level.
Chapter 11: Chi-Squared Tests and ANOVA
362
Table #11.1.1: Autism Versus Breastfeeding
Autism
Breast Feeding Timelines
Row
Total
None Less
than 2
months
2 to 6
months
More
than 6
months
9. Yes 241 198 164 215 818
No 20 25 27 44 116
Column Total 261 223 191 259 934
Solution
:
1. State the null and alternative hypotheses and the level of
significance
Ho : Breastfeeding and autism are independent
HA : Breastfeeding and autism are dependent
α = 0.01
2. State and check the assumptions for the hypothesis test
a. A random sample of breastfeeding time frames and autism
incidence was
taken.
b. Expected frequencies for each cell are greater than or equal
to 5 (ie. E ≥ 5 ).
10. See step 3. All expected frequencies are more than 5.
3. Find the test statistic and p-value
Test statistic:
First find the expected frequencies for each cell.
E Autism and no breastfeeding( ) = 818 *261
934
≈ 228.585
E Autism and < 2 months( ) = 818 *223
934
≈195.304
E Autism and 2 to 6 months( ) = 818 *191
934
≈167.278
E Autism and more than 6 months( ) = 818 *259
934
11. ≈ 226.833
Others are done similarly. It is easier to do the calculations for
the test statistic
with a table, the others are in table #11.1.2 along with the
calculation for the test
statistic. (Note: the column of O − E should add to 0 or close
to 0.)
Chapter 11: Chi-Square Tests and ANOVA
363
Table #11.1.2: Calculations for Chi-Square Test Statistic
O E O − E O − E( )2 O − E( )2 E
241 228.585 12.415 154.132225 0.674288448
198 195.304 2.696 7.268416 0.03721591
164 167.278 -3.278 10.745284 0.064236086
12. 215 226.833 -11.833 140.019889 0.617281828
20 32.4154 -12.4154 154.1421572 4.755213792
25 27.6959 -2.6959 7.26787681 0.262417066
27 23.7216 3.2784 10.74790656 0.453085229
44 32.167 11.833 140.019889 4.352904809
Total 0.0001 11.2166432= χ 2
The test statistic formula is
χ 2 =
O − E( )2
E∑ , which is the total of the last
column in table #11.1.2.
p-value:
df = 2 −1( )* 4 −1( ) = 3
χcdf 11.2166432,1E99,3( ) ≈ 0.01061
4. Conclusion
13. Fail to reject Ho since the p-value is more than 0.01.
5. Interpretation
There is not enough evidence to show that breastfeeding and
autism are
dependent. This means that you cannot say that the whether a
child is breastfed or
not will indicate if that the child will be diagnosed with autism.
Example #11.1.2: Hypothesis Test with Chi-Square Test Using
TI-83/84 Calculator
Is there a relationship between autism and breastfeeding? To
determine if there
is, a researcher asked mothers of autistic and non-autistic
children to say what
time period they breastfed their children. The data is in table
#11.1.1 (Schultz,
Klonoff-Cohen, Wingard, Askhoomoff, Macera, Ji & Bacher,
2006). Do the data
provide enough evidence to show that that breastfeeding and
autism are
independent? Test at the1% level.