SlideShare a Scribd company logo
1 of 9
Inference in Regression
We can also complete a significance test to determine if a specified value of
β is plausible.
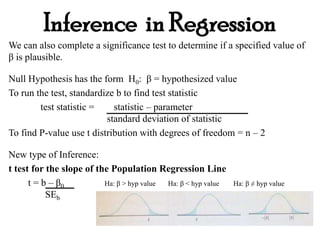
Null Hypothesis has the form H0: β = hypothesized value
To run the test, standardize b to find test statistic
test statistic = statistic – parameter
standard deviation of statistic
To find P-value use t distribution with degrees of freedom = n – 2
New type of Inference:
t test for the slope of the Population Regression Line
t = b – β0 Ha: β > hyp value Ha: β < hyp value Ha: β ≠ hyp value
SEb
Inference in Regression
H0: β = 0, a regression line with a slop of 0 is horizontal
H0 says that there is no linear relationship between x and y in the population;
the linear regression of y on x is of no value for predicting y
Regression output from statistical software usually gives t and its two-sided
P-value for a test of H0: β = 0. To find the one-sided P-value divide the
given P-value by 2.
Inference in Regression
Infants who cry easily may be more easily stimulated than others. This may
be a sign of higher IQ. Child development researchers explored the
relationship between the crying of infants 4 to 10 days old and their later IQ
test scores. A snap of a rubber band on the sole of the foot caused the infants
to cry. The researchers recorded the crying and measured its intensity by the
number of peaks in the most active 20 seconds of crying. They later
measures the children’s IQ at age three years using the Stanford-Binet IQ
test.
Inference in Regression
a. Using the scatterplot of the data with the least-squares line added,
describe what this graph tells you about the relationship between these two
variables.
Inference in Regression
What is the equation of the least-squares regression line for predicting IQ at
age 3 from the number of crying peaks?
Interpret the slope and y-intercept of the regression line in context.
Inference in Regression
Do theses data provide convincing evidence that there is a positive linear
relationship between crying counts and IQ in the population of infants?
Carry out an appropriate test.
Inference in Regression
Notice the T value in the table. It is our test statistic.
Notice the P-Value in the table. It is double the P-value in our test, because
our test is one-sided.
Remember that confidence intervals give you a little more information than
tests do. They tell you not just that is greater, but where and how much
greater.
Inference in Regression
Our bodies have a natural electrical field that is known to help wounds heal.
How does changing the field strength affect healing? A series of experiments
with frogs investigated this question. In one experiment, the two hind limbs
of 12 frogs were assigned at random to either experimental or control groups.
The electrical field in the experimental limbs was reduced to zero by
applying a voltage. The control limbs were left alone. Researchers
measured the rates at which new cells closed a razor cut in each limb in
micrometers per hour.
An examination of the data suggests that the conditions for performing
regression inference are met. A 95% confidence interval for the slope β of
the true regression line for predicting healing rates in frogs’ limbs when
exposed to zero voltage from healing rates in their limbs with normal
electrical fields is (-0.42, 0.72). Based on the interval, what conclusion
should we draw from a test of H0: β = 0 versus Ha; β ≠ 0 at the α = 0.05
significance level?
Inference in Regression
Using graphing calculators to run a t test for regression
Enter NEA change in L1 and y values in L2
STAT – TESTS – LinRegTTest
TI-84 can also do a LinRegTInt
NEA change -94 -57 -29 135 143 151 245 355 392 473 486 535 571 580 620 690
Fat gain 4.2 3.0 3.7 2.7 3.2 3.6 2.4 1.3 3.8 1.7 1.6 2.2 1.0 0.4 2.3 1.1

More Related Content

What's hot

Meaning and Importance of Statistics
Meaning and Importance of StatisticsMeaning and Importance of Statistics
Meaning and Importance of StatisticsFlipped Channel
 
Statistical Estimation
Statistical Estimation Statistical Estimation
Statistical Estimation Remyagharishs
 
Arithmetic Mean, Geometric Mean, Harmonic Mean
Arithmetic Mean, Geometric Mean, Harmonic MeanArithmetic Mean, Geometric Mean, Harmonic Mean
Arithmetic Mean, Geometric Mean, Harmonic MeanDr. Nirav Vyas
 
Regression analysis
Regression analysisRegression analysis
Regression analysissaba khan
 
Least square method
Least square methodLeast square method
Least square methodPandidurai P
 
Descriptive and Inferential Statistics
Descriptive and Inferential StatisticsDescriptive and Inferential Statistics
Descriptive and Inferential StatisticsDanica Antiquina
 
Hypothesis testing
Hypothesis testingHypothesis testing
Hypothesis testingShameer P Hamsa
 
Descriptive statistics
Descriptive statisticsDescriptive statistics
Descriptive statisticsRajesh Gunesh
 
Simple linear regression and correlation
Simple linear regression and correlationSimple linear regression and correlation
Simple linear regression and correlationShakeel Nouman
 
Time series analysis
Time series analysis Time series analysis
Time series analysis Shivam Dhawan
 
INFERENTIAL STATISTICS: AN INTRODUCTION
INFERENTIAL STATISTICS: AN INTRODUCTIONINFERENTIAL STATISTICS: AN INTRODUCTION
INFERENTIAL STATISTICS: AN INTRODUCTIONJohn Labrador
 
Introduction to statistics
Introduction to statisticsIntroduction to statistics
Introduction to statisticsSantosh Bhandari
 
Sampling and Sampling Distributions
Sampling and Sampling DistributionsSampling and Sampling Distributions
Sampling and Sampling DistributionsBk Islam Mumitul
 
Use of statistics in real life
Use of statistics in real lifeUse of statistics in real life
Use of statistics in real lifeHarsh Rajput
 
Multiple linear regression
Multiple linear regressionMultiple linear regression
Multiple linear regressionJames Neill
 
Introduction to basic concepts of statistics
Introduction to basic concepts of statisticsIntroduction to basic concepts of statistics
Introduction to basic concepts of statisticsAfsheen Affan
 

What's hot (20)

Meaning and Importance of Statistics
Meaning and Importance of StatisticsMeaning and Importance of Statistics
Meaning and Importance of Statistics
 
Statistical Estimation
Statistical Estimation Statistical Estimation
Statistical Estimation
 
Arithmetic Mean, Geometric Mean, Harmonic Mean
Arithmetic Mean, Geometric Mean, Harmonic MeanArithmetic Mean, Geometric Mean, Harmonic Mean
Arithmetic Mean, Geometric Mean, Harmonic Mean
 
Regression analysis
Regression analysisRegression analysis
Regression analysis
 
Least square method
Least square methodLeast square method
Least square method
 
Descriptive and Inferential Statistics
Descriptive and Inferential StatisticsDescriptive and Inferential Statistics
Descriptive and Inferential Statistics
 
Hypothesis testing
Hypothesis testingHypothesis testing
Hypothesis testing
 
STATISTICS.pptx
STATISTICS.pptxSTATISTICS.pptx
STATISTICS.pptx
 
Descriptive statistics
Descriptive statisticsDescriptive statistics
Descriptive statistics
 
Statistics:Probability Theory
Statistics:Probability TheoryStatistics:Probability Theory
Statistics:Probability Theory
 
Ch1 slides
Ch1 slidesCh1 slides
Ch1 slides
 
Simple linear regression and correlation
Simple linear regression and correlationSimple linear regression and correlation
Simple linear regression and correlation
 
Time series analysis
Time series analysis Time series analysis
Time series analysis
 
INFERENTIAL STATISTICS: AN INTRODUCTION
INFERENTIAL STATISTICS: AN INTRODUCTIONINFERENTIAL STATISTICS: AN INTRODUCTION
INFERENTIAL STATISTICS: AN INTRODUCTION
 
Introduction to statistics
Introduction to statisticsIntroduction to statistics
Introduction to statistics
 
Sampling and Sampling Distributions
Sampling and Sampling DistributionsSampling and Sampling Distributions
Sampling and Sampling Distributions
 
Hypothesis
HypothesisHypothesis
Hypothesis
 
Use of statistics in real life
Use of statistics in real lifeUse of statistics in real life
Use of statistics in real life
 
Multiple linear regression
Multiple linear regressionMultiple linear regression
Multiple linear regression
 
Introduction to basic concepts of statistics
Introduction to basic concepts of statisticsIntroduction to basic concepts of statistics
Introduction to basic concepts of statistics
 

Similar to Inference in regression line test

Two-Variable (Bivariate) RegressionIn the last unit, we covered
Two-Variable (Bivariate) RegressionIn the last unit, we covered Two-Variable (Bivariate) RegressionIn the last unit, we covered
Two-Variable (Bivariate) RegressionIn the last unit, we covered LacieKlineeb
 
For this assignment, use the aschooltest.sav dataset.The d
For this assignment, use the aschooltest.sav dataset.The dFor this assignment, use the aschooltest.sav dataset.The d
For this assignment, use the aschooltest.sav dataset.The dMerrileeDelvalle969
 
Parametric & non parametric
Parametric & non parametricParametric & non parametric
Parametric & non parametricANCYBS
 
Chapter12
Chapter12Chapter12
Chapter12rwmiller
 
Statistical tests of significance and Student`s T-Test
Statistical tests of significance and Student`s T-TestStatistical tests of significance and Student`s T-Test
Statistical tests of significance and Student`s T-TestVasundhraKakkar
 
HYPOTHESIS TESTING.ppt
HYPOTHESIS TESTING.pptHYPOTHESIS TESTING.ppt
HYPOTHESIS TESTING.pptsadiakhan783184
 
Qnt 275 final exam july 2017 version
Qnt 275 final exam july 2017 versionQnt 275 final exam july 2017 version
Qnt 275 final exam july 2017 versionAdams-ASs
 
Chapter 08correlation
Chapter 08correlationChapter 08correlation
Chapter 08correlationghalan
 
Categorical data analysis full lecture note PPT.pptx
Categorical data analysis full lecture note  PPT.pptxCategorical data analysis full lecture note  PPT.pptx
Categorical data analysis full lecture note PPT.pptxMinilikDerseh1
 
Chapter11
Chapter11Chapter11
Chapter11rwmiller
 
Day-2_Presentation for SPSS parametric workshop.pptx
Day-2_Presentation for SPSS parametric workshop.pptxDay-2_Presentation for SPSS parametric workshop.pptx
Day-2_Presentation for SPSS parametric workshop.pptxrjaisankar
 
Hypothesis Testing Research Methodology ppt
Hypothesis Testing Research Methodology pptHypothesis Testing Research Methodology ppt
Hypothesis Testing Research Methodology pptGayatri Chopra
 
BIOSTATISTICS T TEST Z TEST F TEST HYPOTHESIS TYPES OF ERROR.pptx
BIOSTATISTICS T TEST Z TEST F TEST HYPOTHESIS TYPES OF ERROR.pptxBIOSTATISTICS T TEST Z TEST F TEST HYPOTHESIS TYPES OF ERROR.pptx
BIOSTATISTICS T TEST Z TEST F TEST HYPOTHESIS TYPES OF ERROR.pptxPayaamvohra1
 

Similar to Inference in regression line test (20)

Two-Variable (Bivariate) RegressionIn the last unit, we covered
Two-Variable (Bivariate) RegressionIn the last unit, we covered Two-Variable (Bivariate) RegressionIn the last unit, we covered
Two-Variable (Bivariate) RegressionIn the last unit, we covered
 
The Sign Test
The Sign TestThe Sign Test
The Sign Test
 
Chapter10 Revised
Chapter10 RevisedChapter10 Revised
Chapter10 Revised
 
Chapter10 Revised
Chapter10 RevisedChapter10 Revised
Chapter10 Revised
 
Chapter10 Revised
Chapter10 RevisedChapter10 Revised
Chapter10 Revised
 
For this assignment, use the aschooltest.sav dataset.The d
For this assignment, use the aschooltest.sav dataset.The dFor this assignment, use the aschooltest.sav dataset.The d
For this assignment, use the aschooltest.sav dataset.The d
 
Parametric & non parametric
Parametric & non parametricParametric & non parametric
Parametric & non parametric
 
Chapter12
Chapter12Chapter12
Chapter12
 
Statistical tests of significance and Student`s T-Test
Statistical tests of significance and Student`s T-TestStatistical tests of significance and Student`s T-Test
Statistical tests of significance and Student`s T-Test
 
HYPOTHESIS TESTING.ppt
HYPOTHESIS TESTING.pptHYPOTHESIS TESTING.ppt
HYPOTHESIS TESTING.ppt
 
SNM-1.pdf
SNM-1.pdfSNM-1.pdf
SNM-1.pdf
 
Qnt 275 final exam july 2017 version
Qnt 275 final exam july 2017 versionQnt 275 final exam july 2017 version
Qnt 275 final exam july 2017 version
 
Chapter 08correlation
Chapter 08correlationChapter 08correlation
Chapter 08correlation
 
Categorical data analysis full lecture note PPT.pptx
Categorical data analysis full lecture note  PPT.pptxCategorical data analysis full lecture note  PPT.pptx
Categorical data analysis full lecture note PPT.pptx
 
Chapter11
Chapter11Chapter11
Chapter11
 
Nonparametric and Distribution- Free Statistics
Nonparametric and Distribution- Free Statistics Nonparametric and Distribution- Free Statistics
Nonparametric and Distribution- Free Statistics
 
Day-2_Presentation for SPSS parametric workshop.pptx
Day-2_Presentation for SPSS parametric workshop.pptxDay-2_Presentation for SPSS parametric workshop.pptx
Day-2_Presentation for SPSS parametric workshop.pptx
 
Hypothesis Testing Research Methodology ppt
Hypothesis Testing Research Methodology pptHypothesis Testing Research Methodology ppt
Hypothesis Testing Research Methodology ppt
 
Basics of Hypothesis Testing
Basics of Hypothesis Testing  Basics of Hypothesis Testing
Basics of Hypothesis Testing
 
BIOSTATISTICS T TEST Z TEST F TEST HYPOTHESIS TYPES OF ERROR.pptx
BIOSTATISTICS T TEST Z TEST F TEST HYPOTHESIS TYPES OF ERROR.pptxBIOSTATISTICS T TEST Z TEST F TEST HYPOTHESIS TYPES OF ERROR.pptx
BIOSTATISTICS T TEST Z TEST F TEST HYPOTHESIS TYPES OF ERROR.pptx
 

More from amylute

What are the odds notes
What are the odds notesWhat are the odds notes
What are the odds notesamylute
 
Logarithmic transformations
Logarithmic transformationsLogarithmic transformations
Logarithmic transformationsamylute
 
Transforming data for inference
Transforming data for inferenceTransforming data for inference
Transforming data for inferenceamylute
 
Regression inference confidence intervals
Regression inference confidence intervalsRegression inference confidence intervals
Regression inference confidence intervalsamylute
 
Using chi square wisely
Using chi square wiselyUsing chi square wisely
Using chi square wiselyamylute
 
Chi square test for homgeneity
Chi square test for homgeneityChi square test for homgeneity
Chi square test for homgeneityamylute
 
Relationships across distribution
Relationships across distributionRelationships across distribution
Relationships across distributionamylute
 
Chi square goodness of fit test
Chi square goodness of fit testChi square goodness of fit test
Chi square goodness of fit testamylute
 
Chi square distribution table c
Chi square distribution table cChi square distribution table c
Chi square distribution table camylute
 
Ap statistics chp. 11
Ap statistics chp. 11Ap statistics chp. 11
Ap statistics chp. 11amylute
 
Dividing polys
Dividing polysDividing polys
Dividing polysamylute
 
Solving triangles pp slides
Solving triangles pp slidesSolving triangles pp slides
Solving triangles pp slidesamylute
 
Conditional prob & independence
Conditional prob & independenceConditional prob & independence
Conditional prob & independenceamylute
 
Two way tables & venn diagrams
Two way tables & venn diagramsTwo way tables & venn diagrams
Two way tables & venn diagramsamylute
 
Probability models & basic rules
Probability models & basic rulesProbability models & basic rules
Probability models & basic rulesamylute
 
Simulation
SimulationSimulation
Simulationamylute
 
Mthys of probability
Mthys of probabilityMthys of probability
Mthys of probabilityamylute
 
4.3 using studies wisely
4.3 using studies wisely4.3 using studies wisely
4.3 using studies wiselyamylute
 
4.2 blocking
4.2 blocking4.2 blocking
4.2 blockingamylute
 
4.2 placebos & double blind
4.2 placebos & double blind4.2 placebos & double blind
4.2 placebos & double blindamylute
 

More from amylute (20)

What are the odds notes
What are the odds notesWhat are the odds notes
What are the odds notes
 
Logarithmic transformations
Logarithmic transformationsLogarithmic transformations
Logarithmic transformations
 
Transforming data for inference
Transforming data for inferenceTransforming data for inference
Transforming data for inference
 
Regression inference confidence intervals
Regression inference confidence intervalsRegression inference confidence intervals
Regression inference confidence intervals
 
Using chi square wisely
Using chi square wiselyUsing chi square wisely
Using chi square wisely
 
Chi square test for homgeneity
Chi square test for homgeneityChi square test for homgeneity
Chi square test for homgeneity
 
Relationships across distribution
Relationships across distributionRelationships across distribution
Relationships across distribution
 
Chi square goodness of fit test
Chi square goodness of fit testChi square goodness of fit test
Chi square goodness of fit test
 
Chi square distribution table c
Chi square distribution table cChi square distribution table c
Chi square distribution table c
 
Ap statistics chp. 11
Ap statistics chp. 11Ap statistics chp. 11
Ap statistics chp. 11
 
Dividing polys
Dividing polysDividing polys
Dividing polys
 
Solving triangles pp slides
Solving triangles pp slidesSolving triangles pp slides
Solving triangles pp slides
 
Conditional prob & independence
Conditional prob & independenceConditional prob & independence
Conditional prob & independence
 
Two way tables & venn diagrams
Two way tables & venn diagramsTwo way tables & venn diagrams
Two way tables & venn diagrams
 
Probability models & basic rules
Probability models & basic rulesProbability models & basic rules
Probability models & basic rules
 
Simulation
SimulationSimulation
Simulation
 
Mthys of probability
Mthys of probabilityMthys of probability
Mthys of probability
 
4.3 using studies wisely
4.3 using studies wisely4.3 using studies wisely
4.3 using studies wisely
 
4.2 blocking
4.2 blocking4.2 blocking
4.2 blocking
 
4.2 placebos & double blind
4.2 placebos & double blind4.2 placebos & double blind
4.2 placebos & double blind
 

Recently uploaded

Organic Name Reactions for the students and aspirants of Chemistry12th.pptx
Organic Name Reactions  for the students and aspirants of Chemistry12th.pptxOrganic Name Reactions  for the students and aspirants of Chemistry12th.pptx
Organic Name Reactions for the students and aspirants of Chemistry12th.pptxVS Mahajan Coaching Centre
 
18-04-UA_REPORT_MEDIALITERAСY_INDEX-DM_23-1-final-eng.pdf
18-04-UA_REPORT_MEDIALITERAСY_INDEX-DM_23-1-final-eng.pdf18-04-UA_REPORT_MEDIALITERAСY_INDEX-DM_23-1-final-eng.pdf
18-04-UA_REPORT_MEDIALITERAСY_INDEX-DM_23-1-final-eng.pdfssuser54595a
 
Crayon Activity Handout For the Crayon A
Crayon Activity Handout For the Crayon ACrayon Activity Handout For the Crayon A
Crayon Activity Handout For the Crayon AUnboundStockton
 
Presentation by Andreas Schleicher Tackling the School Absenteeism Crisis 30 ...
Presentation by Andreas Schleicher Tackling the School Absenteeism Crisis 30 ...Presentation by Andreas Schleicher Tackling the School Absenteeism Crisis 30 ...
Presentation by Andreas Schleicher Tackling the School Absenteeism Crisis 30 ...EduSkills OECD
 
A Critique of the Proposed National Education Policy Reform
A Critique of the Proposed National Education Policy ReformA Critique of the Proposed National Education Policy Reform
A Critique of the Proposed National Education Policy ReformChameera Dedduwage
 
Enzyme, Pharmaceutical Aids, Miscellaneous Last Part of Chapter no 5th.pdf
Enzyme, Pharmaceutical Aids, Miscellaneous Last Part of Chapter no 5th.pdfEnzyme, Pharmaceutical Aids, Miscellaneous Last Part of Chapter no 5th.pdf
Enzyme, Pharmaceutical Aids, Miscellaneous Last Part of Chapter no 5th.pdfSumit Tiwari
 
URLs and Routing in the Odoo 17 Website App
URLs and Routing in the Odoo 17 Website AppURLs and Routing in the Odoo 17 Website App
URLs and Routing in the Odoo 17 Website AppCeline George
 
CARE OF CHILD IN INCUBATOR..........pptx
CARE OF CHILD IN INCUBATOR..........pptxCARE OF CHILD IN INCUBATOR..........pptx
CARE OF CHILD IN INCUBATOR..........pptxGaneshChakor2
 
Paris 2024 Olympic Geographies - an activity
Paris 2024 Olympic Geographies - an activityParis 2024 Olympic Geographies - an activity
Paris 2024 Olympic Geographies - an activityGeoBlogs
 
mini mental status format.docx
mini    mental       status     format.docxmini    mental       status     format.docx
mini mental status format.docxPoojaSen20
 
KSHARA STURA .pptx---KSHARA KARMA THERAPY (CAUSTIC THERAPY)————IMP.OF KSHARA ...
KSHARA STURA .pptx---KSHARA KARMA THERAPY (CAUSTIC THERAPY)————IMP.OF KSHARA ...KSHARA STURA .pptx---KSHARA KARMA THERAPY (CAUSTIC THERAPY)————IMP.OF KSHARA ...
KSHARA STURA .pptx---KSHARA KARMA THERAPY (CAUSTIC THERAPY)————IMP.OF KSHARA ...M56BOOKSTORE PRODUCT/SERVICE
 
Contemporary philippine arts from the regions_PPT_Module_12 [Autosaved] (1).pptx
Contemporary philippine arts from the regions_PPT_Module_12 [Autosaved] (1).pptxContemporary philippine arts from the regions_PPT_Module_12 [Autosaved] (1).pptx
Contemporary philippine arts from the regions_PPT_Module_12 [Autosaved] (1).pptxRoyAbrique
 
Kisan Call Centre - To harness potential of ICT in Agriculture by answer farm...
Kisan Call Centre - To harness potential of ICT in Agriculture by answer farm...Kisan Call Centre - To harness potential of ICT in Agriculture by answer farm...
Kisan Call Centre - To harness potential of ICT in Agriculture by answer farm...Krashi Coaching
 
How to Make a Pirate ship Primary Education.pptx
How to Make a Pirate ship Primary Education.pptxHow to Make a Pirate ship Primary Education.pptx
How to Make a Pirate ship Primary Education.pptxmanuelaromero2013
 
Introduction to AI in Higher Education_draft.pptx
Introduction to AI in Higher Education_draft.pptxIntroduction to AI in Higher Education_draft.pptx
Introduction to AI in Higher Education_draft.pptxpboyjonauth
 
Accessible design: Minimum effort, maximum impact
Accessible design: Minimum effort, maximum impactAccessible design: Minimum effort, maximum impact
Accessible design: Minimum effort, maximum impactdawncurless
 
Alper Gobel In Media Res Media Component
Alper Gobel In Media Res Media ComponentAlper Gobel In Media Res Media Component
Alper Gobel In Media Res Media ComponentInMediaRes1
 
call girls in Kamla Market (DELHI) 🔝 >༒9953330565🔝 genuine Escort Service 🔝✔️✔️
call girls in Kamla Market (DELHI) 🔝 >༒9953330565🔝 genuine Escort Service 🔝✔️✔️call girls in Kamla Market (DELHI) 🔝 >༒9953330565🔝 genuine Escort Service 🔝✔️✔️
call girls in Kamla Market (DELHI) 🔝 >༒9953330565🔝 genuine Escort Service 🔝✔️✔️9953056974 Low Rate Call Girls In Saket, Delhi NCR
 
POINT- BIOCHEMISTRY SEM 2 ENZYMES UNIT 5.pptx
POINT- BIOCHEMISTRY SEM 2 ENZYMES UNIT 5.pptxPOINT- BIOCHEMISTRY SEM 2 ENZYMES UNIT 5.pptx
POINT- BIOCHEMISTRY SEM 2 ENZYMES UNIT 5.pptxSayali Powar
 

Recently uploaded (20)

Organic Name Reactions for the students and aspirants of Chemistry12th.pptx
Organic Name Reactions  for the students and aspirants of Chemistry12th.pptxOrganic Name Reactions  for the students and aspirants of Chemistry12th.pptx
Organic Name Reactions for the students and aspirants of Chemistry12th.pptx
 
Model Call Girl in Tilak Nagar Delhi reach out to us at 🔝9953056974🔝
Model Call Girl in Tilak Nagar Delhi reach out to us at 🔝9953056974🔝Model Call Girl in Tilak Nagar Delhi reach out to us at 🔝9953056974🔝
Model Call Girl in Tilak Nagar Delhi reach out to us at 🔝9953056974🔝
 
18-04-UA_REPORT_MEDIALITERAСY_INDEX-DM_23-1-final-eng.pdf
18-04-UA_REPORT_MEDIALITERAСY_INDEX-DM_23-1-final-eng.pdf18-04-UA_REPORT_MEDIALITERAСY_INDEX-DM_23-1-final-eng.pdf
18-04-UA_REPORT_MEDIALITERAСY_INDEX-DM_23-1-final-eng.pdf
 
Crayon Activity Handout For the Crayon A
Crayon Activity Handout For the Crayon ACrayon Activity Handout For the Crayon A
Crayon Activity Handout For the Crayon A
 
Presentation by Andreas Schleicher Tackling the School Absenteeism Crisis 30 ...
Presentation by Andreas Schleicher Tackling the School Absenteeism Crisis 30 ...Presentation by Andreas Schleicher Tackling the School Absenteeism Crisis 30 ...
Presentation by Andreas Schleicher Tackling the School Absenteeism Crisis 30 ...
 
A Critique of the Proposed National Education Policy Reform
A Critique of the Proposed National Education Policy ReformA Critique of the Proposed National Education Policy Reform
A Critique of the Proposed National Education Policy Reform
 
Enzyme, Pharmaceutical Aids, Miscellaneous Last Part of Chapter no 5th.pdf
Enzyme, Pharmaceutical Aids, Miscellaneous Last Part of Chapter no 5th.pdfEnzyme, Pharmaceutical Aids, Miscellaneous Last Part of Chapter no 5th.pdf
Enzyme, Pharmaceutical Aids, Miscellaneous Last Part of Chapter no 5th.pdf
 
URLs and Routing in the Odoo 17 Website App
URLs and Routing in the Odoo 17 Website AppURLs and Routing in the Odoo 17 Website App
URLs and Routing in the Odoo 17 Website App
 
CARE OF CHILD IN INCUBATOR..........pptx
CARE OF CHILD IN INCUBATOR..........pptxCARE OF CHILD IN INCUBATOR..........pptx
CARE OF CHILD IN INCUBATOR..........pptx
 
Paris 2024 Olympic Geographies - an activity
Paris 2024 Olympic Geographies - an activityParis 2024 Olympic Geographies - an activity
Paris 2024 Olympic Geographies - an activity
 
mini mental status format.docx
mini    mental       status     format.docxmini    mental       status     format.docx
mini mental status format.docx
 
KSHARA STURA .pptx---KSHARA KARMA THERAPY (CAUSTIC THERAPY)————IMP.OF KSHARA ...
KSHARA STURA .pptx---KSHARA KARMA THERAPY (CAUSTIC THERAPY)————IMP.OF KSHARA ...KSHARA STURA .pptx---KSHARA KARMA THERAPY (CAUSTIC THERAPY)————IMP.OF KSHARA ...
KSHARA STURA .pptx---KSHARA KARMA THERAPY (CAUSTIC THERAPY)————IMP.OF KSHARA ...
 
Contemporary philippine arts from the regions_PPT_Module_12 [Autosaved] (1).pptx
Contemporary philippine arts from the regions_PPT_Module_12 [Autosaved] (1).pptxContemporary philippine arts from the regions_PPT_Module_12 [Autosaved] (1).pptx
Contemporary philippine arts from the regions_PPT_Module_12 [Autosaved] (1).pptx
 
Kisan Call Centre - To harness potential of ICT in Agriculture by answer farm...
Kisan Call Centre - To harness potential of ICT in Agriculture by answer farm...Kisan Call Centre - To harness potential of ICT in Agriculture by answer farm...
Kisan Call Centre - To harness potential of ICT in Agriculture by answer farm...
 
How to Make a Pirate ship Primary Education.pptx
How to Make a Pirate ship Primary Education.pptxHow to Make a Pirate ship Primary Education.pptx
How to Make a Pirate ship Primary Education.pptx
 
Introduction to AI in Higher Education_draft.pptx
Introduction to AI in Higher Education_draft.pptxIntroduction to AI in Higher Education_draft.pptx
Introduction to AI in Higher Education_draft.pptx
 
Accessible design: Minimum effort, maximum impact
Accessible design: Minimum effort, maximum impactAccessible design: Minimum effort, maximum impact
Accessible design: Minimum effort, maximum impact
 
Alper Gobel In Media Res Media Component
Alper Gobel In Media Res Media ComponentAlper Gobel In Media Res Media Component
Alper Gobel In Media Res Media Component
 
call girls in Kamla Market (DELHI) 🔝 >༒9953330565🔝 genuine Escort Service 🔝✔️✔️
call girls in Kamla Market (DELHI) 🔝 >༒9953330565🔝 genuine Escort Service 🔝✔️✔️call girls in Kamla Market (DELHI) 🔝 >༒9953330565🔝 genuine Escort Service 🔝✔️✔️
call girls in Kamla Market (DELHI) 🔝 >༒9953330565🔝 genuine Escort Service 🔝✔️✔️
 
POINT- BIOCHEMISTRY SEM 2 ENZYMES UNIT 5.pptx
POINT- BIOCHEMISTRY SEM 2 ENZYMES UNIT 5.pptxPOINT- BIOCHEMISTRY SEM 2 ENZYMES UNIT 5.pptx
POINT- BIOCHEMISTRY SEM 2 ENZYMES UNIT 5.pptx
 

Inference in regression line test

  • 1. Inference in Regression We can also complete a significance test to determine if a specified value of β is plausible. Null Hypothesis has the form H0: β = hypothesized value To run the test, standardize b to find test statistic test statistic = statistic – parameter standard deviation of statistic To find P-value use t distribution with degrees of freedom = n – 2 New type of Inference: t test for the slope of the Population Regression Line t = b – β0 Ha: β > hyp value Ha: β < hyp value Ha: β ≠ hyp value SEb
  • 2. Inference in Regression H0: β = 0, a regression line with a slop of 0 is horizontal H0 says that there is no linear relationship between x and y in the population; the linear regression of y on x is of no value for predicting y Regression output from statistical software usually gives t and its two-sided P-value for a test of H0: β = 0. To find the one-sided P-value divide the given P-value by 2.
  • 3. Inference in Regression Infants who cry easily may be more easily stimulated than others. This may be a sign of higher IQ. Child development researchers explored the relationship between the crying of infants 4 to 10 days old and their later IQ test scores. A snap of a rubber band on the sole of the foot caused the infants to cry. The researchers recorded the crying and measured its intensity by the number of peaks in the most active 20 seconds of crying. They later measures the children’s IQ at age three years using the Stanford-Binet IQ test.
  • 4. Inference in Regression a. Using the scatterplot of the data with the least-squares line added, describe what this graph tells you about the relationship between these two variables.
  • 5. Inference in Regression What is the equation of the least-squares regression line for predicting IQ at age 3 from the number of crying peaks? Interpret the slope and y-intercept of the regression line in context.
  • 6. Inference in Regression Do theses data provide convincing evidence that there is a positive linear relationship between crying counts and IQ in the population of infants? Carry out an appropriate test.
  • 7. Inference in Regression Notice the T value in the table. It is our test statistic. Notice the P-Value in the table. It is double the P-value in our test, because our test is one-sided. Remember that confidence intervals give you a little more information than tests do. They tell you not just that is greater, but where and how much greater.
  • 8. Inference in Regression Our bodies have a natural electrical field that is known to help wounds heal. How does changing the field strength affect healing? A series of experiments with frogs investigated this question. In one experiment, the two hind limbs of 12 frogs were assigned at random to either experimental or control groups. The electrical field in the experimental limbs was reduced to zero by applying a voltage. The control limbs were left alone. Researchers measured the rates at which new cells closed a razor cut in each limb in micrometers per hour. An examination of the data suggests that the conditions for performing regression inference are met. A 95% confidence interval for the slope β of the true regression line for predicting healing rates in frogs’ limbs when exposed to zero voltage from healing rates in their limbs with normal electrical fields is (-0.42, 0.72). Based on the interval, what conclusion should we draw from a test of H0: β = 0 versus Ha; β ≠ 0 at the α = 0.05 significance level?
  • 9. Inference in Regression Using graphing calculators to run a t test for regression Enter NEA change in L1 and y values in L2 STAT – TESTS – LinRegTTest TI-84 can also do a LinRegTInt NEA change -94 -57 -29 135 143 151 245 355 392 473 486 535 571 580 620 690 Fat gain 4.2 3.0 3.7 2.7 3.2 3.6 2.4 1.3 3.8 1.7 1.6 2.2 1.0 0.4 2.3 1.1