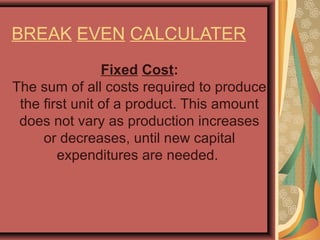
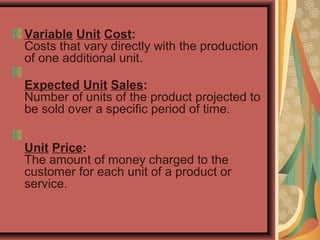
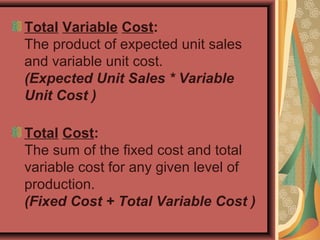
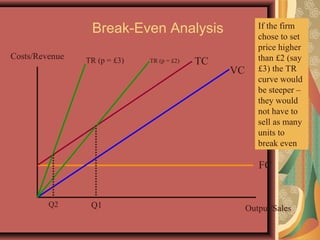
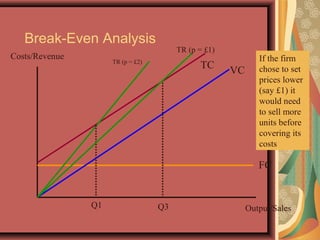
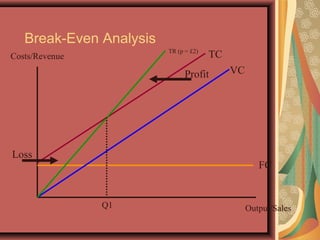
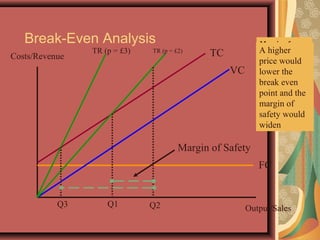
Break-Even AnalysisBreak-Even Analysis
Professor & Lawyer. Puttu Guru PrasadProfessor & Lawyer. Puttu Guru Prasad
(ICFAI Trained & Certified Management Faculty)
 
     DIDACTICAL Significance:-DIDACTICAL Significance:-
M.Com----------------------------- (Madras University)
M.B.A ------------(Dr. Ambedkar University, First Class)
TOEFL------------------- (Top Scorer, Qualified for I-20)
GMAT---------------- (Qualified for I-20 US Study Visa)
L.L .B -------(Gold Medalist, Acharya Nagarjuna University)
PGDM -----------------------(Foreign Trade Management)
M.Phil------ (Annamalai University, Distinction Holder)
F.T.P -----(ICFAI, 30th
Batch Topper and Domain Topper)
APSET----------------------- (Qualified with 68% marks)
P.h.D ----------------(Pursuing from JNJTUK, Kakinada)
INTRODUCTION
A breakeven analysis is used to 
determine how much sales volume 
your business needs to start making 
a profit. 
The breakeven analysis is especially 
useful when you're developing a 
pricing strategy, either as part of a 
marketing plan or a business plan. 
BREAK EVEN CALCULATER
Fixed Cost:
The sum of all costs required to produce 
the first unit of a product. This amount 
does not vary as production increases 
or decreases, until new capital 
expenditures are needed. 
Variable Unit Cost:
Costs that vary directly with the production 
of one additional unit.
 
Expected Unit Sales:
Number of units of the product projected to 
be sold over a specific period of time. 
Unit Price:
The amount of money charged to the 
customer for each unit of a product or 
service. 
Total Variable Cost:
The product of expected unit sales
and variable unit cost.
(Expected Unit Sales * Variable
Unit Cost )
Total Cost:
The sum of the fixed cost and total
variable cost for any given level of
production.
(Fixed Cost + Total Variable Cost )
Total Revenue:
The product of expected unit sales
and unit price.
(Expected Unit Sales * Unit Price )
Profit (or Loss):
The monetary gain (or loss) resulting
from revenues after subtracting all
associated costs. (Total Revenue -
Total Costs)
BREAK EVEN POINT:
Number of units that must be sold in
order to produce a profit of zero (but
will recover all associated costs).
Break Even Point (IN UNIT)= Fixed
Cost /S. Price- Variable Unit Cost
Break Even Point (in Rs)=Fixed
Cost/ S. Price-Variable unit
Cost*Units
For example, suppose that your fixed costs
for producing 100,000 product were 30,000
rs a year.
Your variable costs are 2.20 rs materials,
4.00 rs labour, and 0.80 rs overhead, for a
total of 7.00 rs per unit.
If you choose a selling price of 12.00 rs for
each product, then:
30,000 divided by (12.00 - 7.00) equals
6000 units.
This is the number of products that have to
be sold at a selling price of 12.00 rs before
your business will start to make a profit.
Break-Even Analysis
Costs/Revenue
Output/Sales
Initially a firm
will incur fixed
costs, these do
not depend on
output or sales.
FC
As output is
generated, the
firm will incur
variable costs –
these vary directly
with the amount
produced
VC
The total costs
therefore
(assuming
accurate
forecasts!) is the
sum of FC+VC
TC
Total revenue is
determined by the
price charged and
the quantity sold –
again this will be
determined by
expected forecast
sales initially.
TR
The lower the
price, the less
steep the total
revenue curve.
TR
Q1
The Break-even point
occurs where total
revenue equals total
costs – the firm, in
this example would
have to sell Q1 to
generate sufficient
revenue to cover its
costs.
Break-Even Analysis
Costs/Revenue
Output/Sales
FC
VC
TCTR (p = £2)
Q1
If the firm
chose to set
price higher
than £2 (say
£3) the TR
curve would
be steeper –
they would
not have to
sell as many
units to
break even
TR (p = £3)
Q2
Break-Even Analysis
Costs/Revenue
Output/Sales
FC
VC
TCTR (p = £2)
Q1
If the firm
chose to set
prices lower
(say £1) it
would need
to sell more
units before
covering its
costs
TR (p = £1)
Q3
Break-Even Analysis
Costs/Revenue
Output/Sales
FC
VC
TCTR (p = £2)
Q1
Loss
Profit
Break-Even Analysis
Costs/Revenue
Output/Sales
FC
VC
TCTR (p = £2)
Q1 Q2
Assume
current sales
at Q2
Margin of Safety
Margin of
safety shows
how far sales can
fall before losses
made. If Q1 =
1000 and Q2 =
1800, sales could
fall by 800 units
before a loss
would be made
TR (p = £3)
Q3
A higher
price would
lower the
break even
point and the
margin of
safety would
widen
USES OF BREAK EVEVN POINT
Helpful in deciding the minimum quantity of
sales
Helpful in the determination of tender price
Helpful in examining effects upon
organization’s profitability
Helpful in deciding about the substitution of
new plants
Helpful in sales price and quantity
Helpful in determining marginal cost
LIMITATIONS
Break-even analysis is only a supply side (costs
only) analysis, as it tells you nothing about what
sales are actually likely to be for the product at
these various prices.
It assumes that fixed costs (FC) are constant
It assumes average variable costs are constant
per unit of output, at least in the range of likely
quantities of sales.
It assumes that the quantity of goods produced is
equal to the quantity of goods sold (i.e., there is no
change in the quantity of goods held in inventory
at the beginning of the period and the quantity of
goods held in inventory at the end of the period.
In multi-product companies, it assumes that the
relative proportions of each product sold and
produced are constant.
CONCLUSION
Break even analysis should be distinguished from two other
managerial tools :-
Flexible budgets and standard cost the variable expense
budget is built on the same basic cost – output relationship,
but it is confined to costs and is primarily can concerned with
the components of combined cost since the purpose is to
control cost by developing expenses standards that are
flexibly to achieving rate this purpose often leads to
measures of achieving that differ among costs and operation
so that they cant be readily added or translated in to an
index of output for the enterprise as a whole standard costs
on the other hand on.

Break even-analysis-best gp

  • 1.
    Break-Even AnalysisBreak-Even Analysis Professor& Lawyer. Puttu Guru PrasadProfessor & Lawyer. Puttu Guru Prasad (ICFAI Trained & Certified Management Faculty)        DIDACTICAL Significance:-DIDACTICAL Significance:- M.Com----------------------------- (Madras University) M.B.A ------------(Dr. Ambedkar University, First Class) TOEFL------------------- (Top Scorer, Qualified for I-20) GMAT---------------- (Qualified for I-20 US Study Visa) L.L .B -------(Gold Medalist, Acharya Nagarjuna University) PGDM -----------------------(Foreign Trade Management) M.Phil------ (Annamalai University, Distinction Holder) F.T.P -----(ICFAI, 30th Batch Topper and Domain Topper) APSET----------------------- (Qualified with 68% marks) P.h.D ----------------(Pursuing from JNJTUK, Kakinada)
  • 2.
  • 3.
  • 4.
    Variable Unit Cost: Costs that vary directly with the production  of one additional unit.   ExpectedUnit Sales: Number of units of the product projected to  be sold over a specific period of time.  Unit Price: The amount of money charged to the  customer for each unit of a product or  service. 
  • 5.
    Total Variable Cost: Theproduct of expected unit sales and variable unit cost. (Expected Unit Sales * Variable Unit Cost ) Total Cost: The sum of the fixed cost and total variable cost for any given level of production. (Fixed Cost + Total Variable Cost )
  • 6.
    Total Revenue: The productof expected unit sales and unit price. (Expected Unit Sales * Unit Price ) Profit (or Loss): The monetary gain (or loss) resulting from revenues after subtracting all associated costs. (Total Revenue - Total Costs)
  • 7.
    BREAK EVEN POINT: Numberof units that must be sold in order to produce a profit of zero (but will recover all associated costs). Break Even Point (IN UNIT)= Fixed Cost /S. Price- Variable Unit Cost Break Even Point (in Rs)=Fixed Cost/ S. Price-Variable unit Cost*Units
  • 8.
    For example, supposethat your fixed costs for producing 100,000 product were 30,000 rs a year. Your variable costs are 2.20 rs materials, 4.00 rs labour, and 0.80 rs overhead, for a total of 7.00 rs per unit. If you choose a selling price of 12.00 rs for each product, then: 30,000 divided by (12.00 - 7.00) equals 6000 units. This is the number of products that have to be sold at a selling price of 12.00 rs before your business will start to make a profit.
  • 9.
    Break-Even Analysis Costs/Revenue Output/Sales Initially afirm will incur fixed costs, these do not depend on output or sales. FC As output is generated, the firm will incur variable costs – these vary directly with the amount produced VC The total costs therefore (assuming accurate forecasts!) is the sum of FC+VC TC Total revenue is determined by the price charged and the quantity sold – again this will be determined by expected forecast sales initially. TR The lower the price, the less steep the total revenue curve. TR Q1 The Break-even point occurs where total revenue equals total costs – the firm, in this example would have to sell Q1 to generate sufficient revenue to cover its costs.
  • 10.
    Break-Even Analysis Costs/Revenue Output/Sales FC VC TCTR (p= £2) Q1 If the firm chose to set price higher than £2 (say £3) the TR curve would be steeper – they would not have to sell as many units to break even TR (p = £3) Q2
  • 11.
    Break-Even Analysis Costs/Revenue Output/Sales FC VC TCTR (p= £2) Q1 If the firm chose to set prices lower (say £1) it would need to sell more units before covering its costs TR (p = £1) Q3
  • 12.
  • 13.
    Break-Even Analysis Costs/Revenue Output/Sales FC VC TCTR (p= £2) Q1 Q2 Assume current sales at Q2 Margin of Safety Margin of safety shows how far sales can fall before losses made. If Q1 = 1000 and Q2 = 1800, sales could fall by 800 units before a loss would be made TR (p = £3) Q3 A higher price would lower the break even point and the margin of safety would widen
  • 14.
    USES OF BREAKEVEVN POINT Helpful in deciding the minimum quantity of sales Helpful in the determination of tender price Helpful in examining effects upon organization’s profitability Helpful in deciding about the substitution of new plants Helpful in sales price and quantity Helpful in determining marginal cost
  • 15.
    LIMITATIONS Break-even analysis isonly a supply side (costs only) analysis, as it tells you nothing about what sales are actually likely to be for the product at these various prices. It assumes that fixed costs (FC) are constant It assumes average variable costs are constant per unit of output, at least in the range of likely quantities of sales. It assumes that the quantity of goods produced is equal to the quantity of goods sold (i.e., there is no change in the quantity of goods held in inventory at the beginning of the period and the quantity of goods held in inventory at the end of the period. In multi-product companies, it assumes that the relative proportions of each product sold and produced are constant.
  • 16.
    CONCLUSION Break even analysisshould be distinguished from two other managerial tools :- Flexible budgets and standard cost the variable expense budget is built on the same basic cost – output relationship, but it is confined to costs and is primarily can concerned with the components of combined cost since the purpose is to control cost by developing expenses standards that are flexibly to achieving rate this purpose often leads to measures of achieving that differ among costs and operation so that they cant be readily added or translated in to an index of output for the enterprise as a whole standard costs on the other hand on.