Downloaded 2,864 times
![DEPENDENCEBreak even analysis depends on the following variables:The fixed production costs for a product. The variable production costs for a product. The product's unit price. The product's expected unit sales [sometimes called projected sales.]](https://image.slidesharecdn.com/break-evenanalysis-110912042345-phpapp01/75/Break-even-analysis-14-2048.jpg)


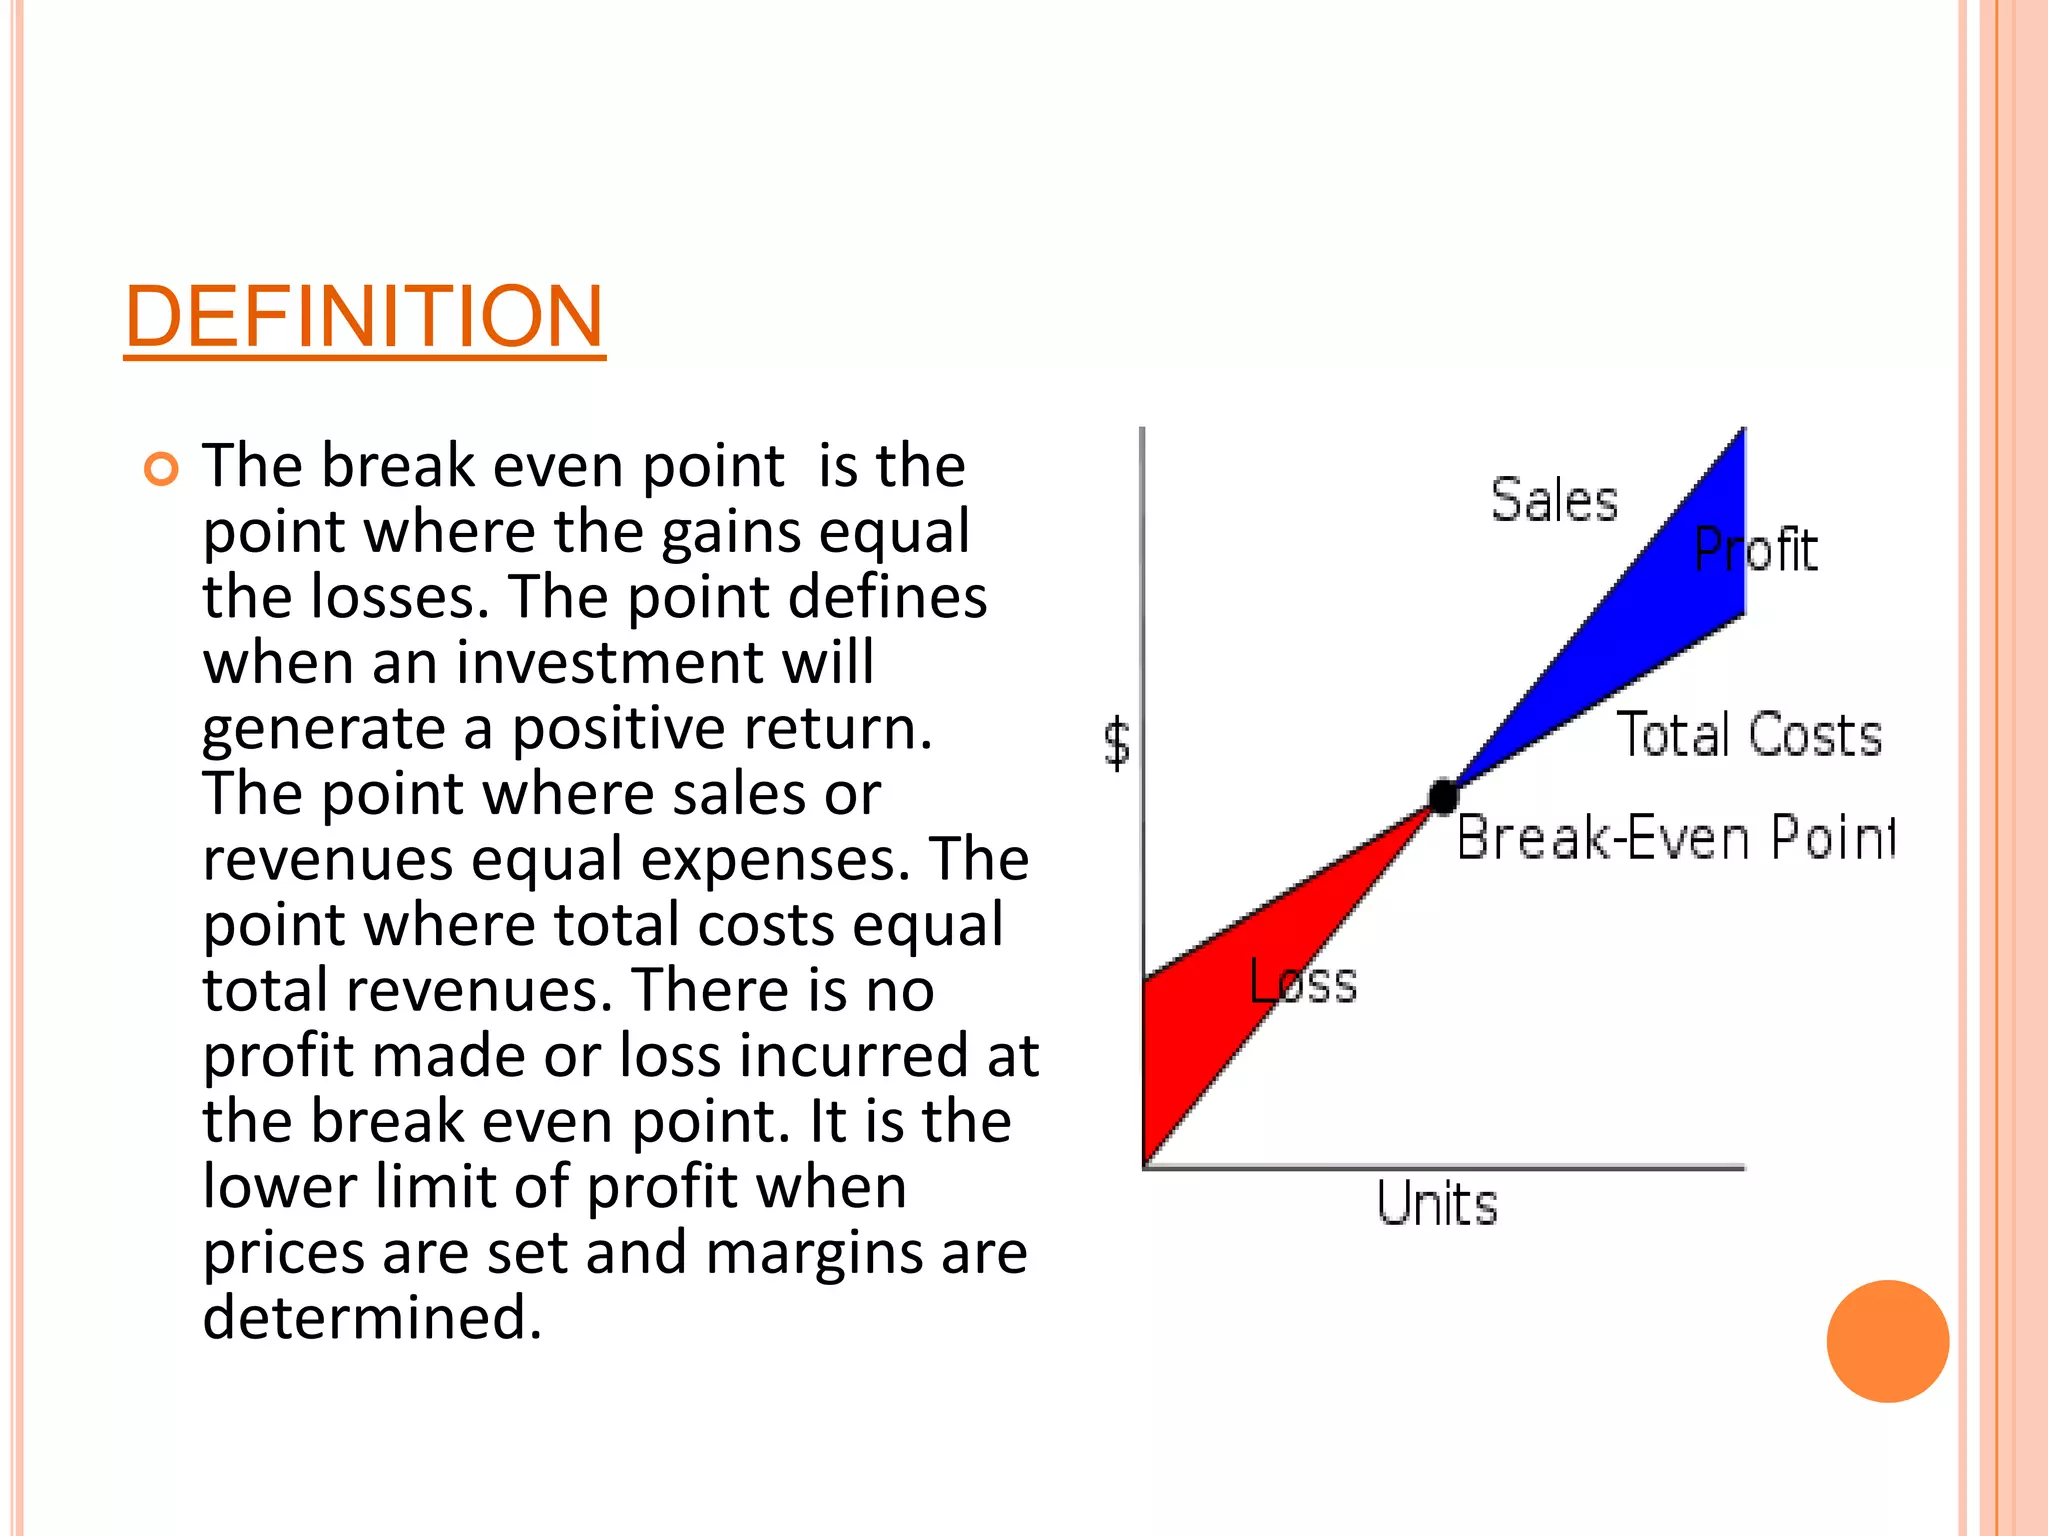
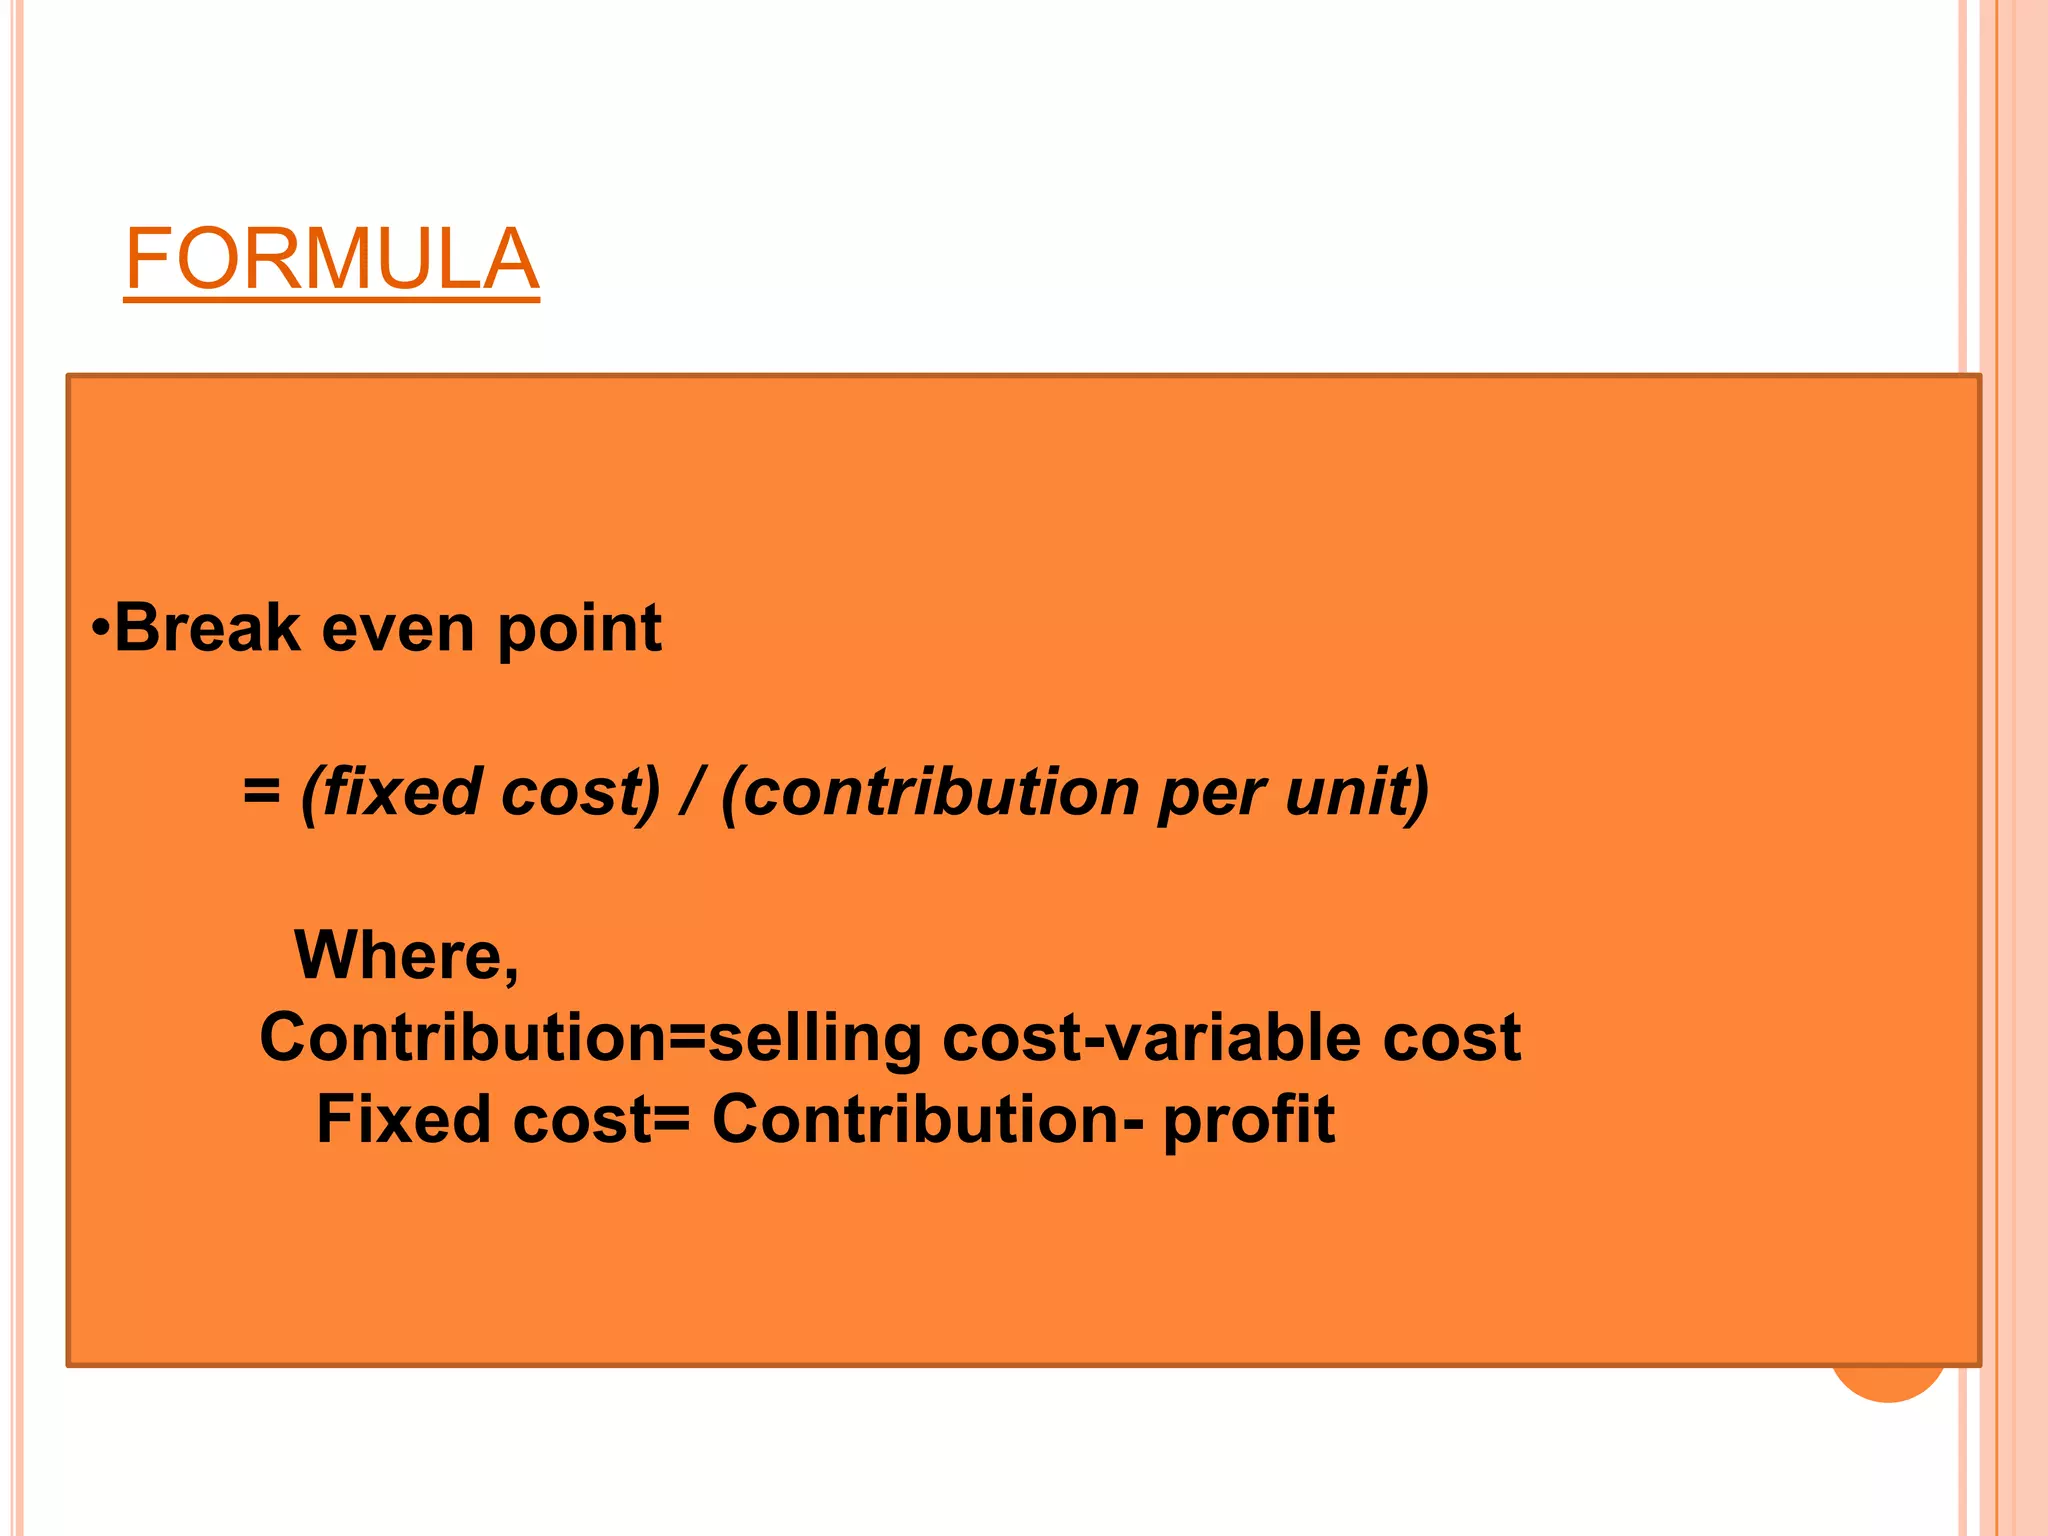
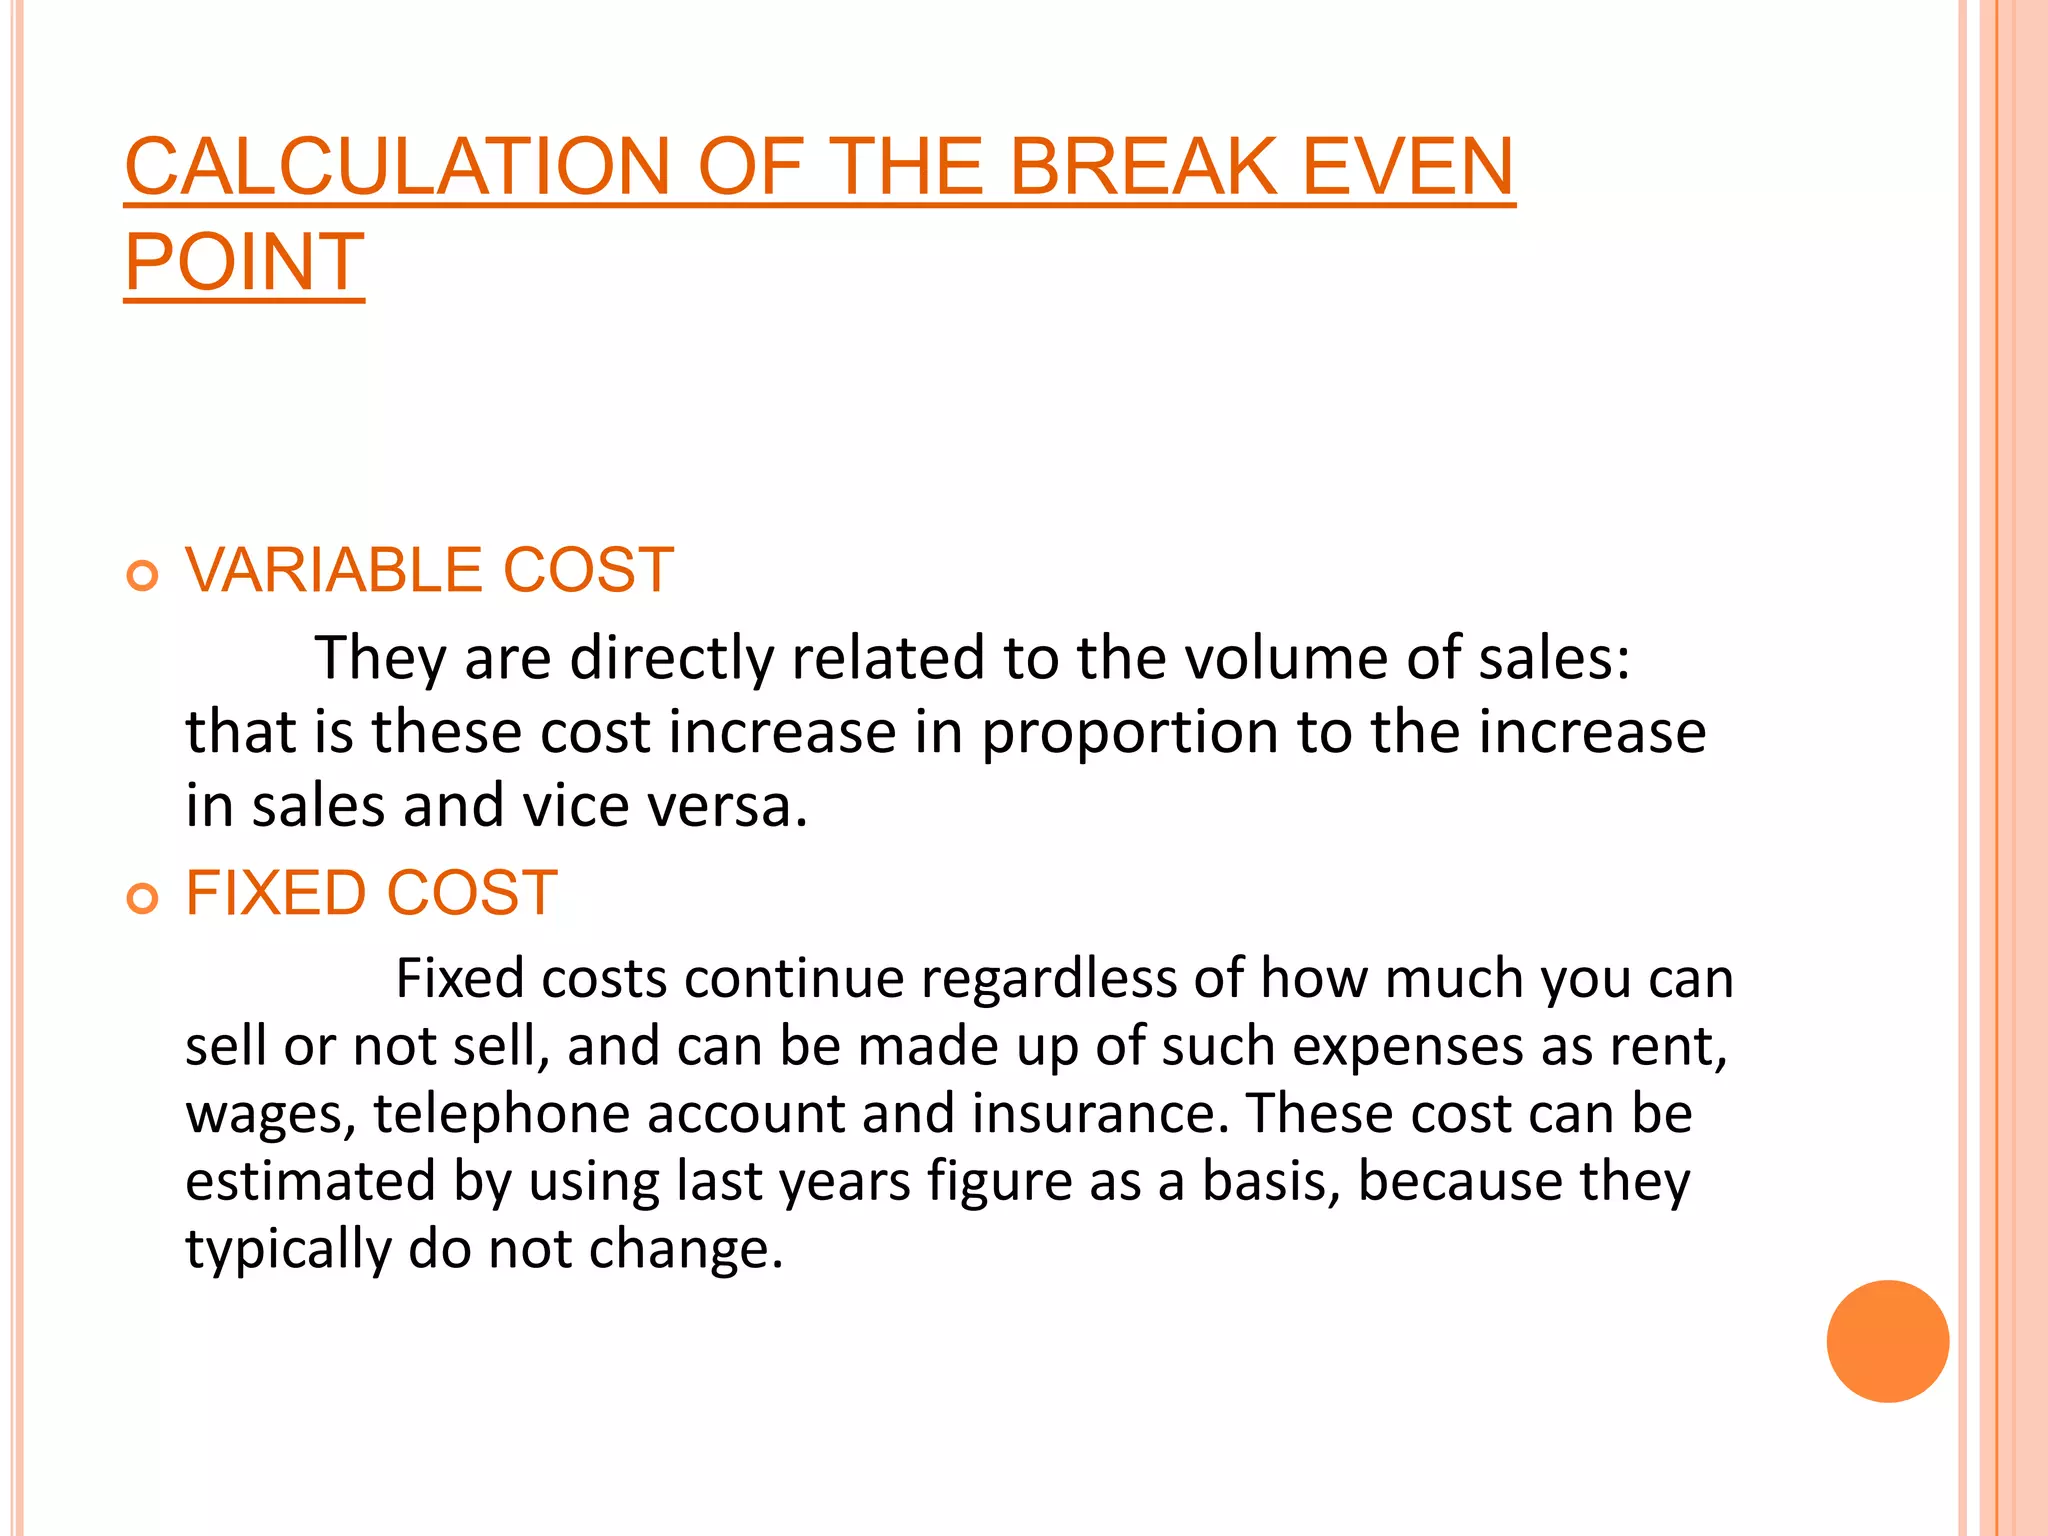
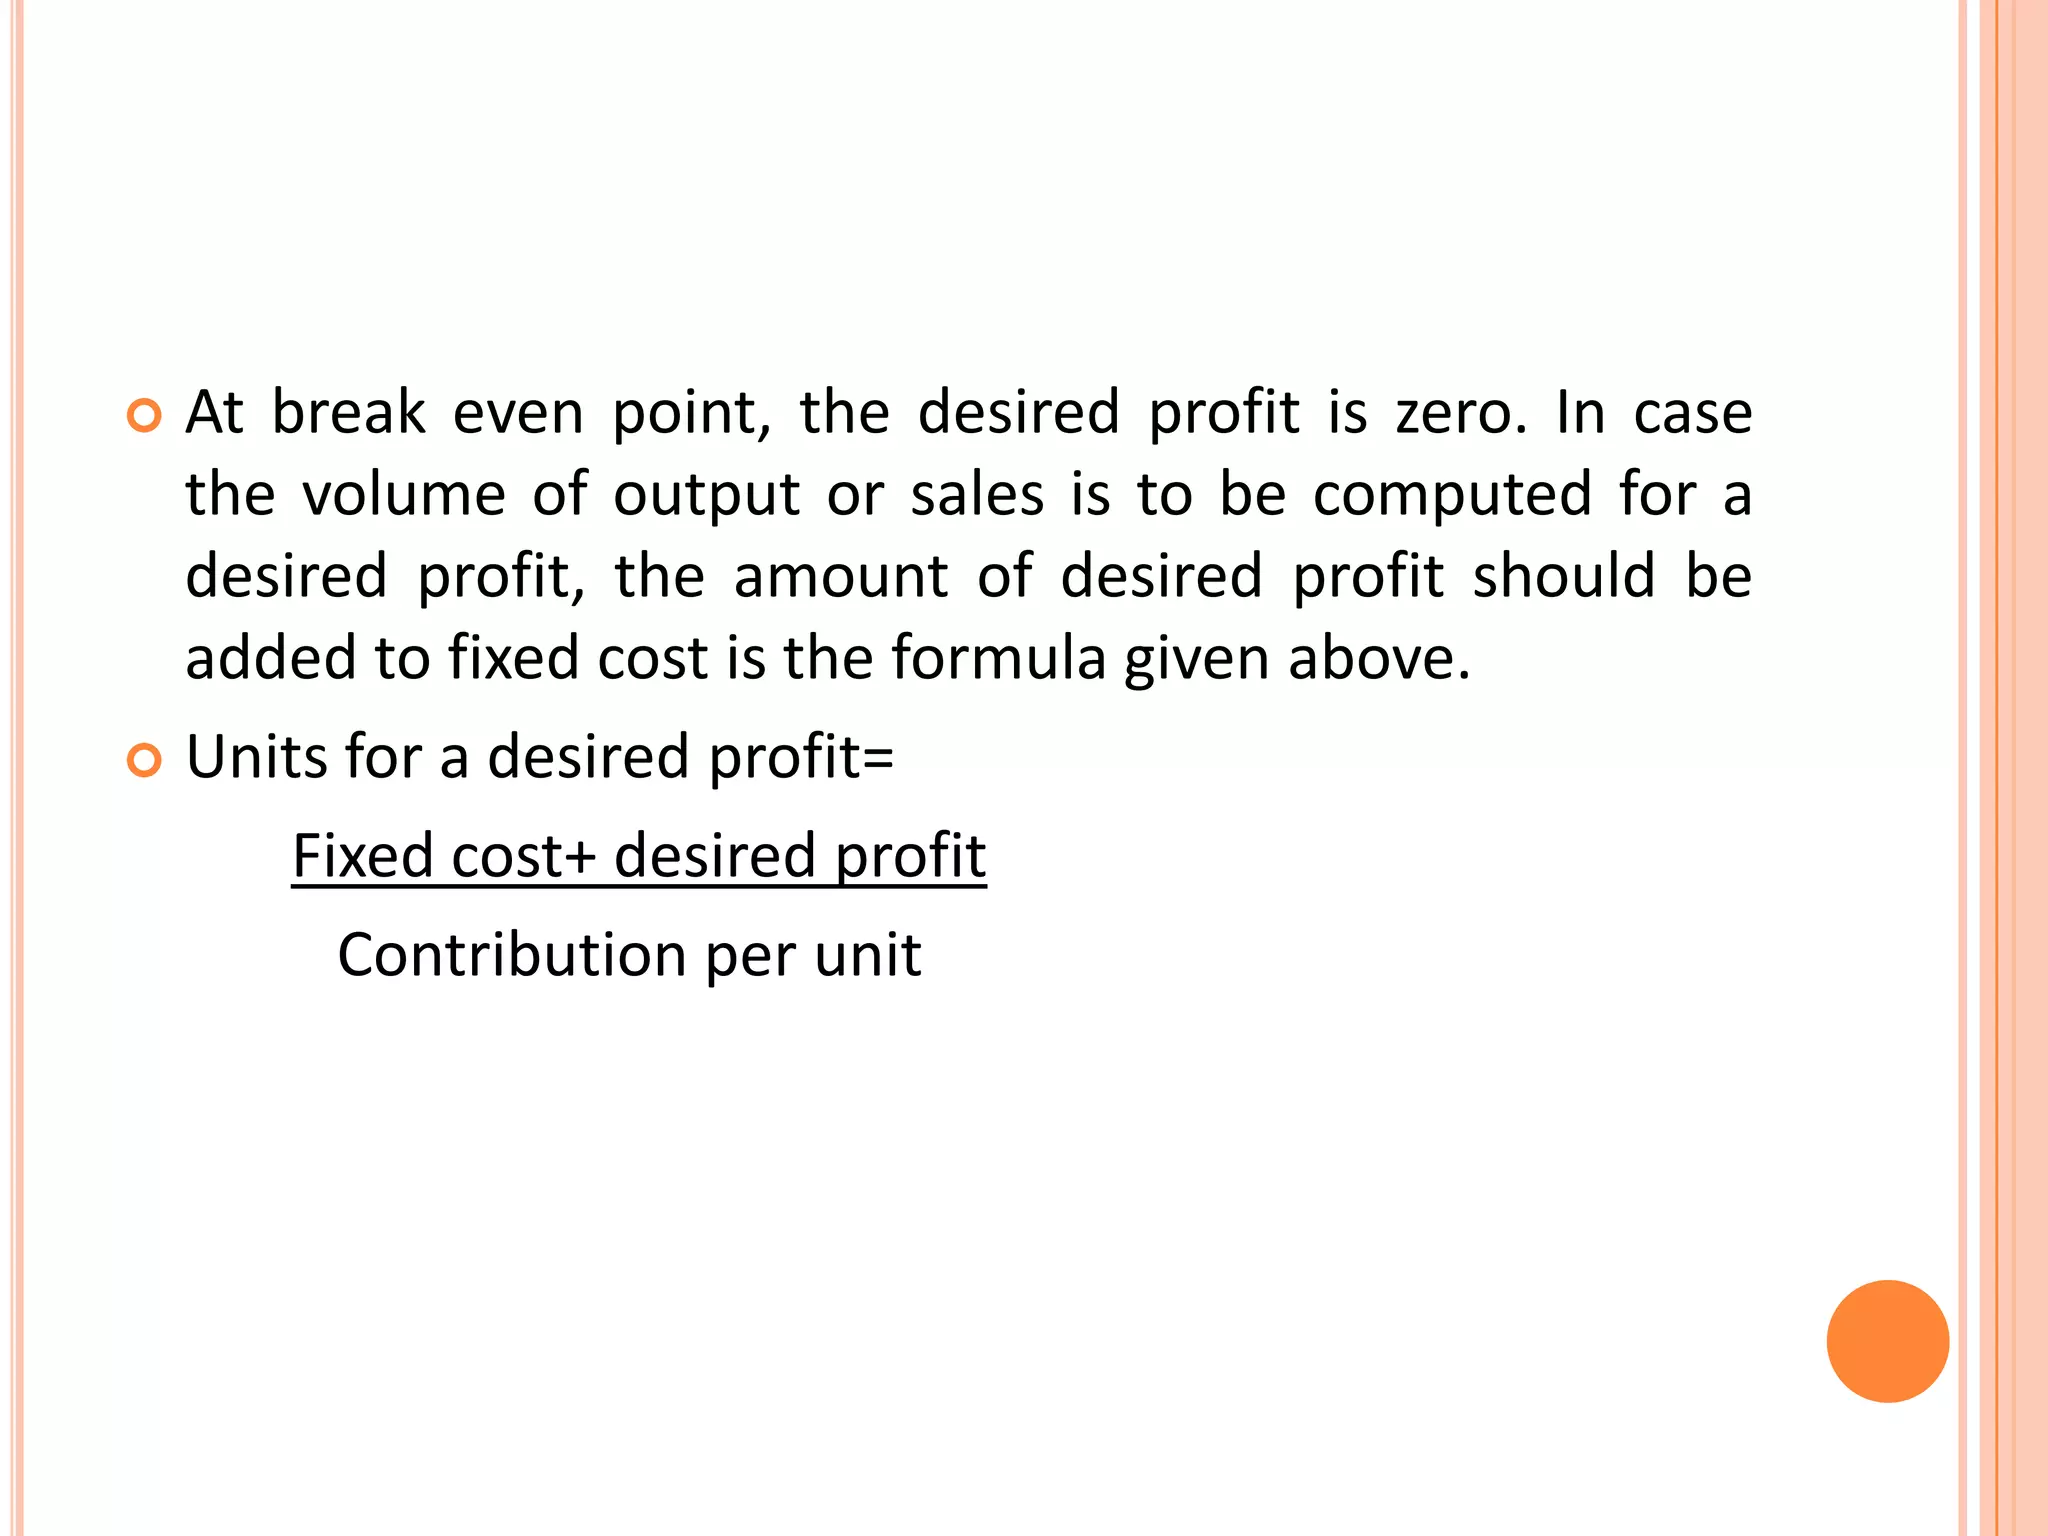
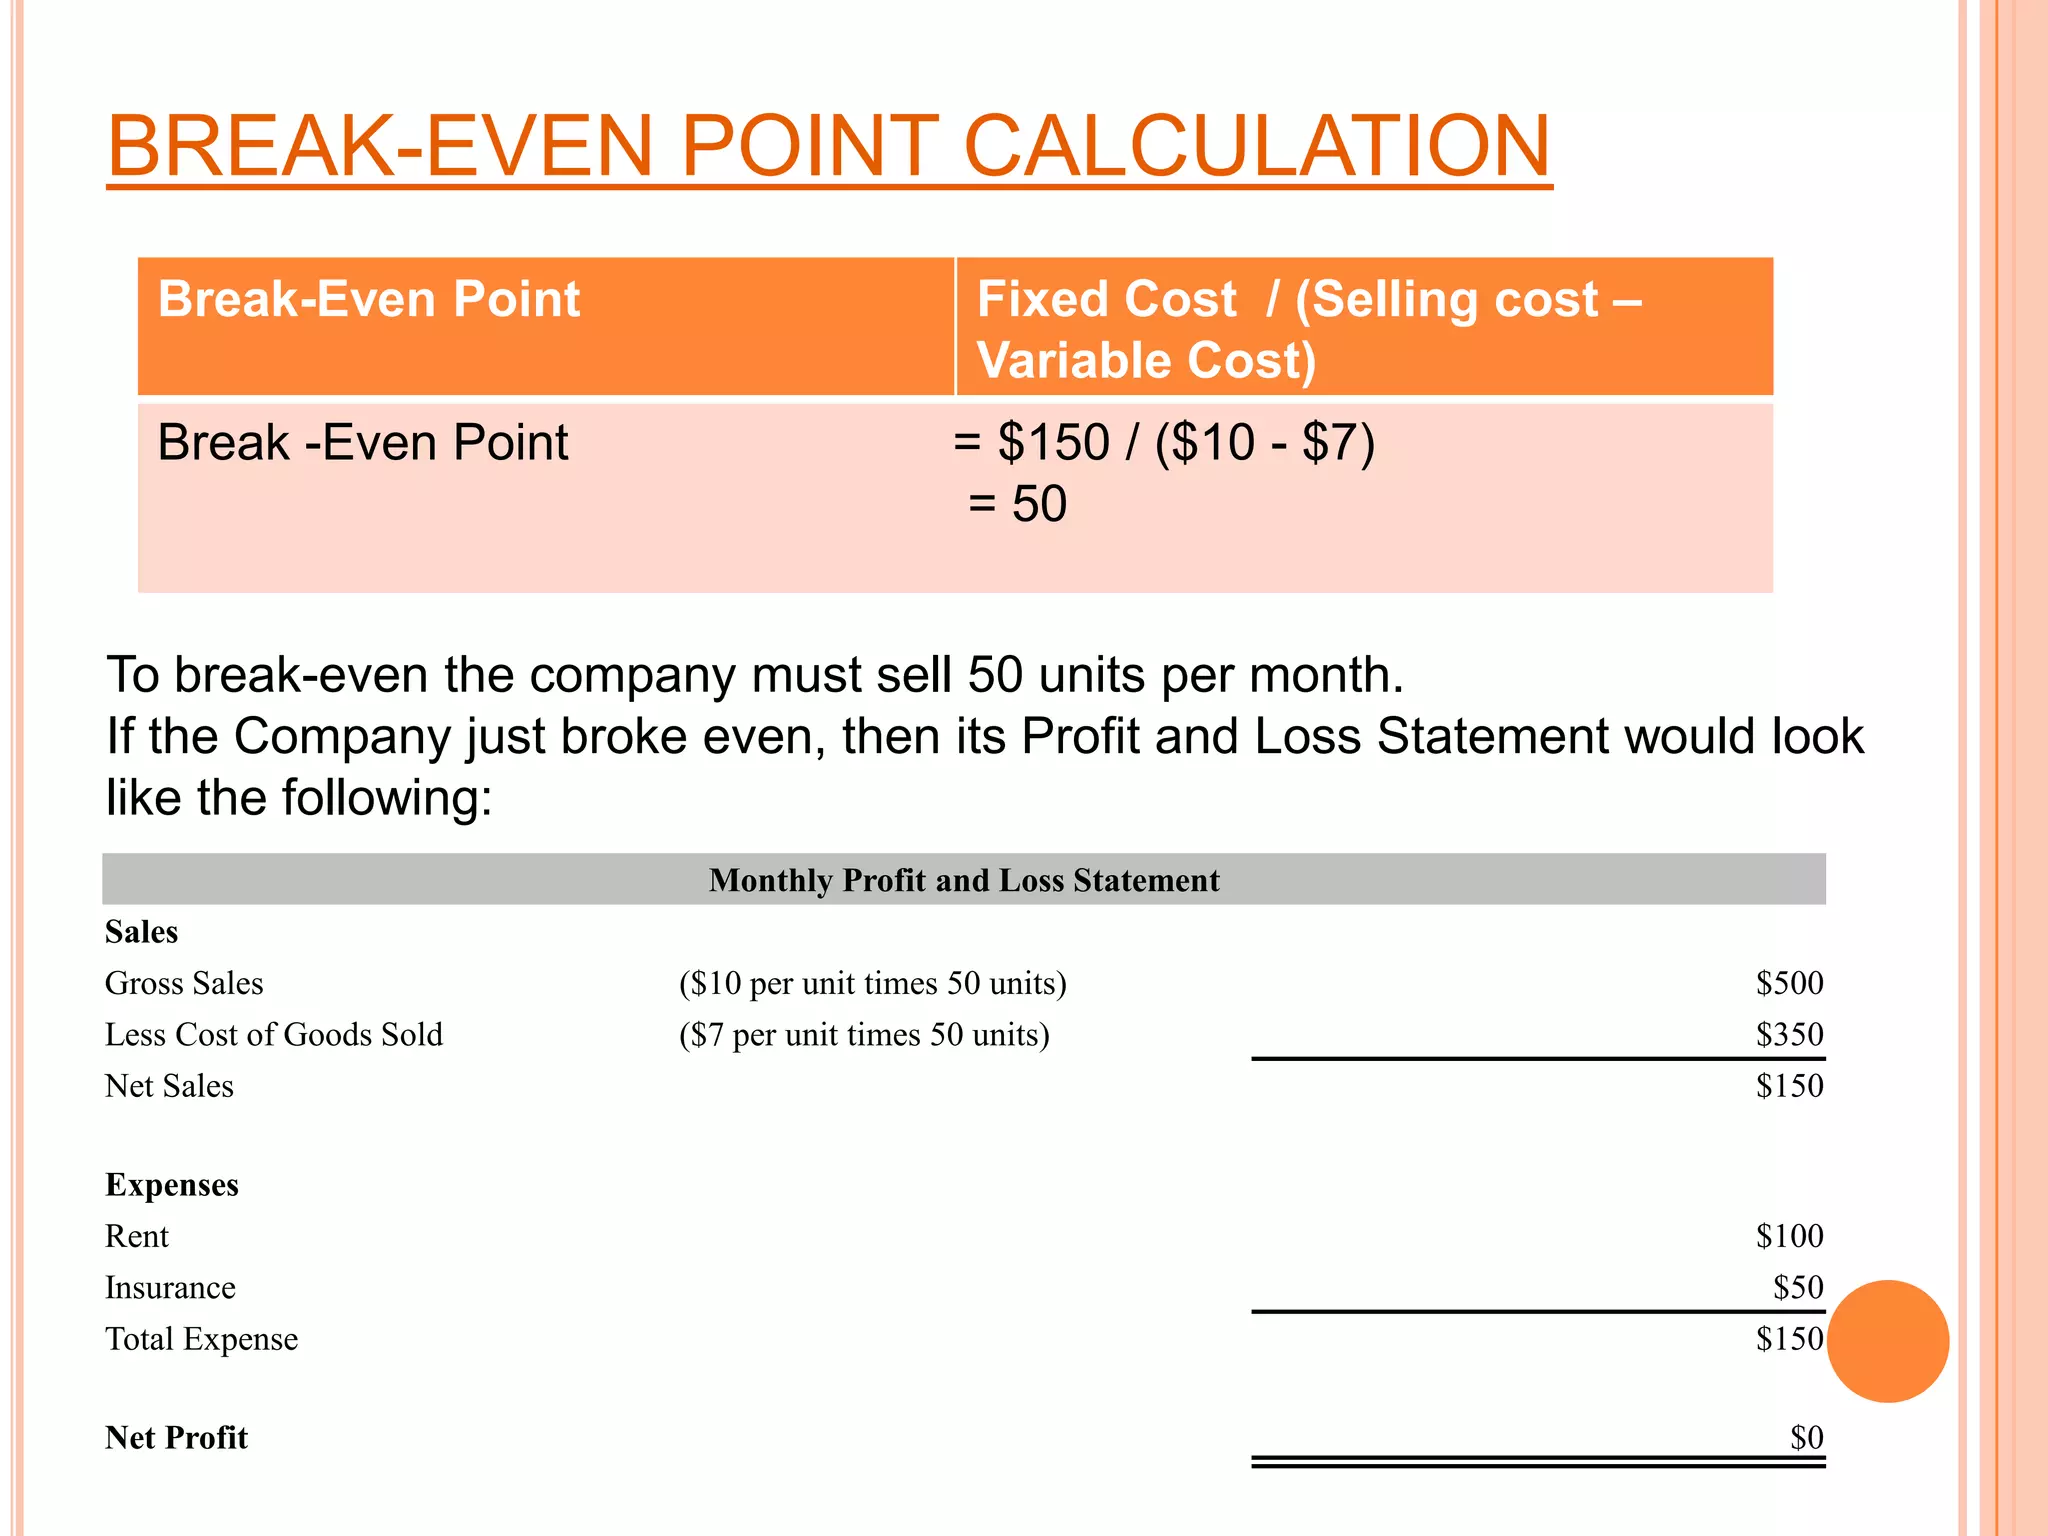
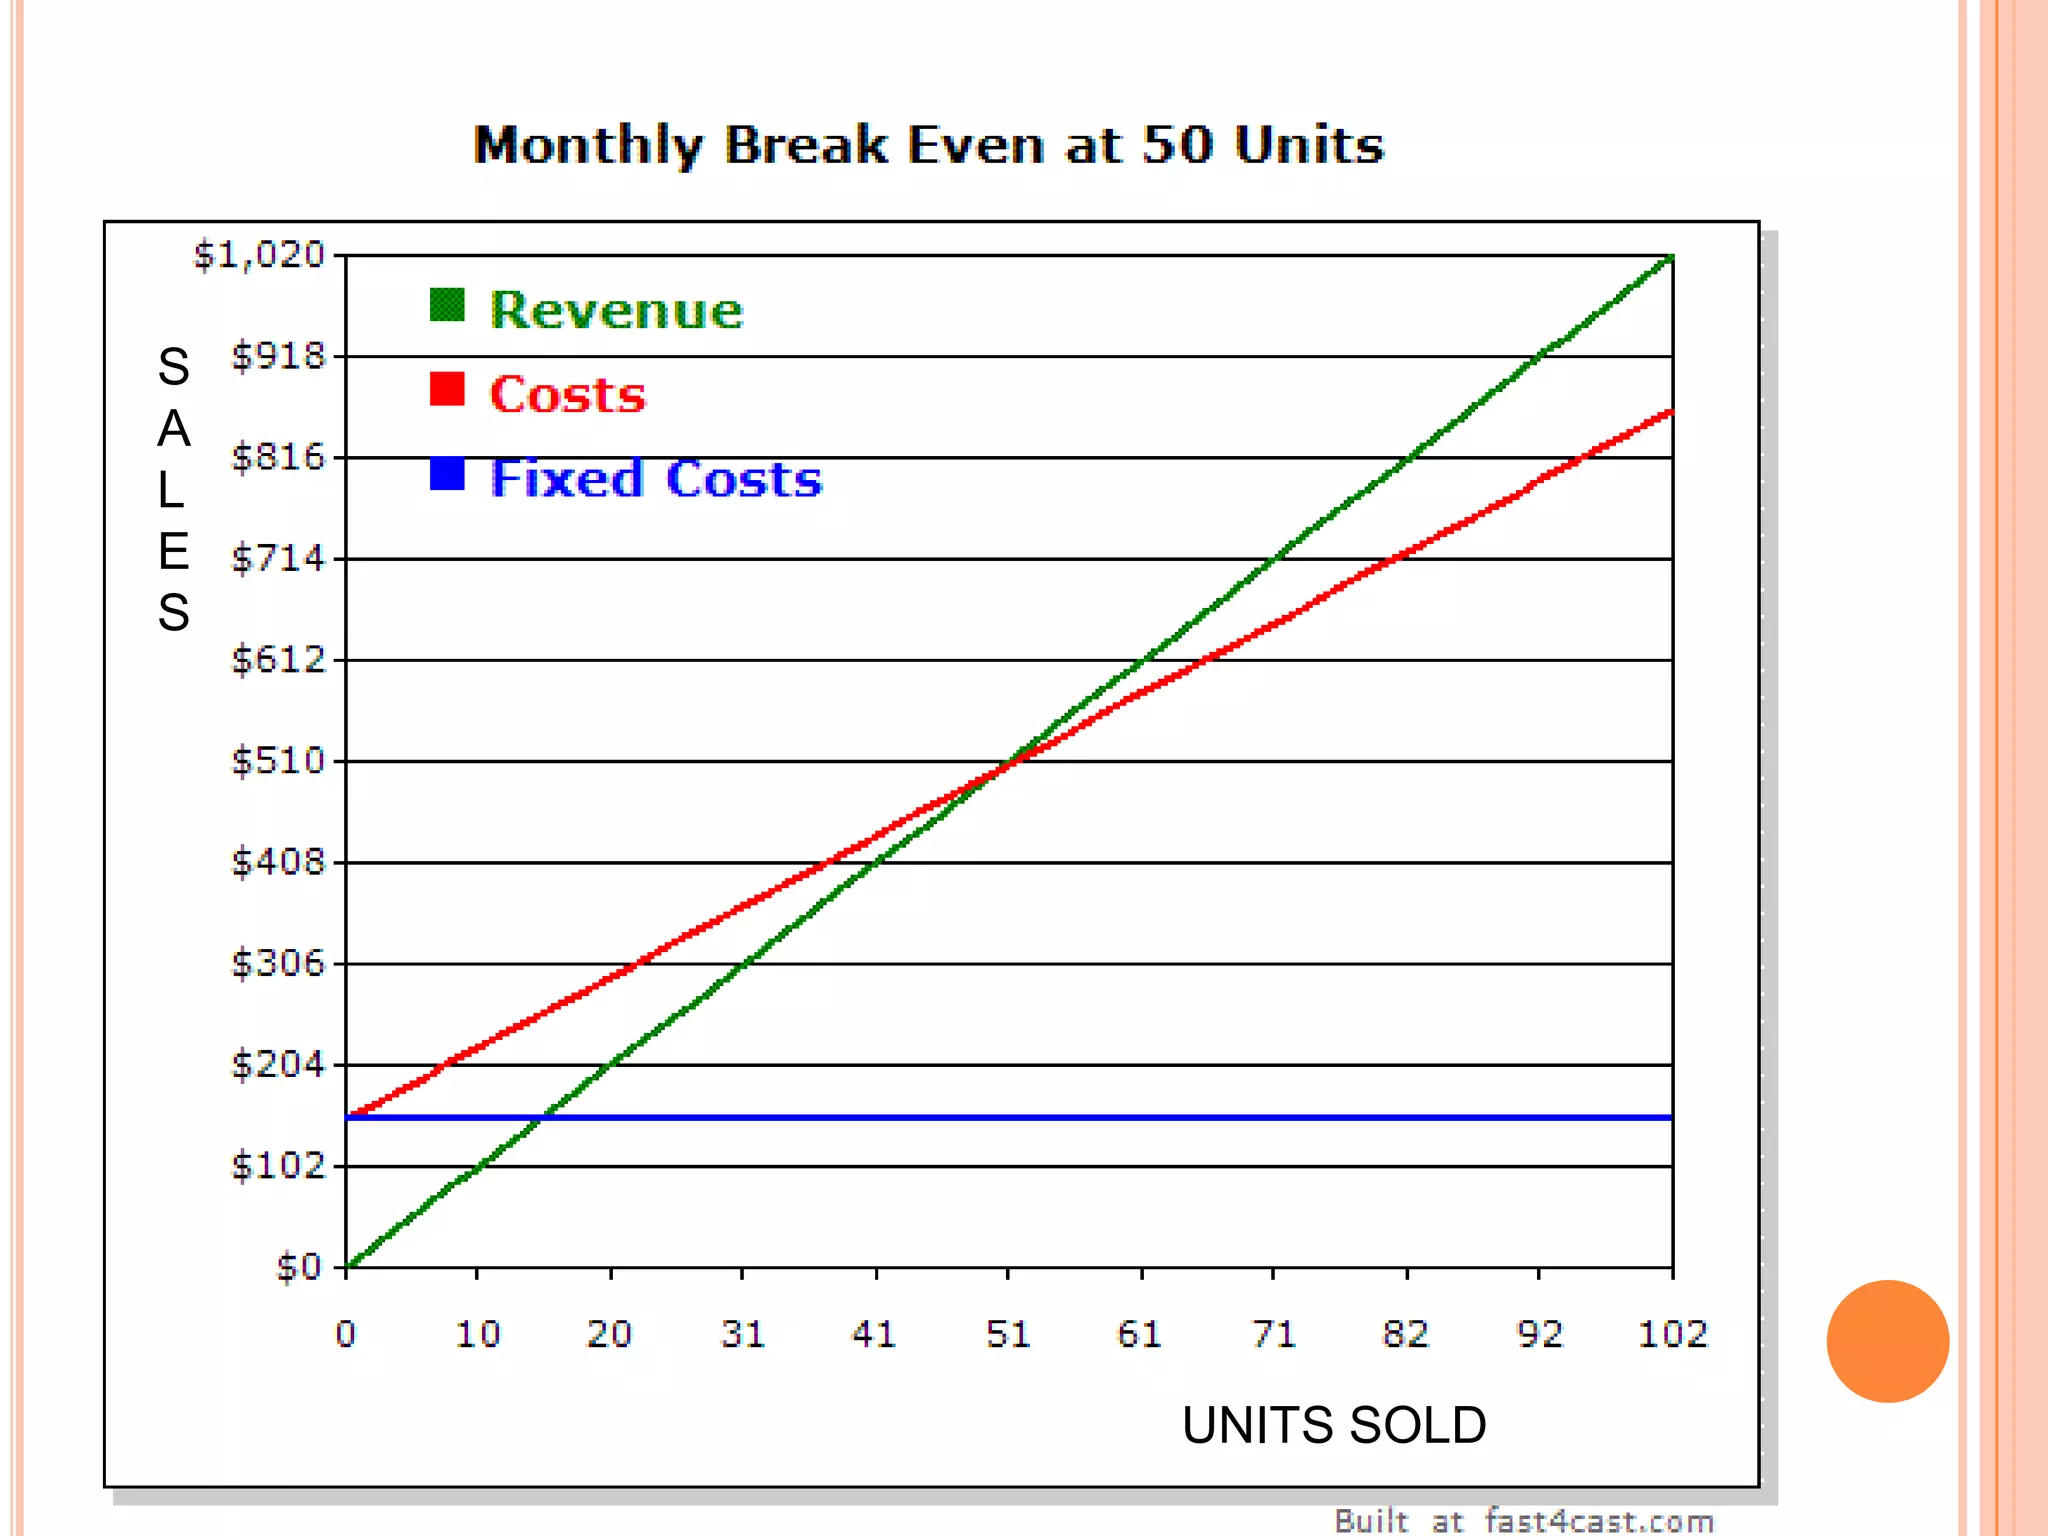
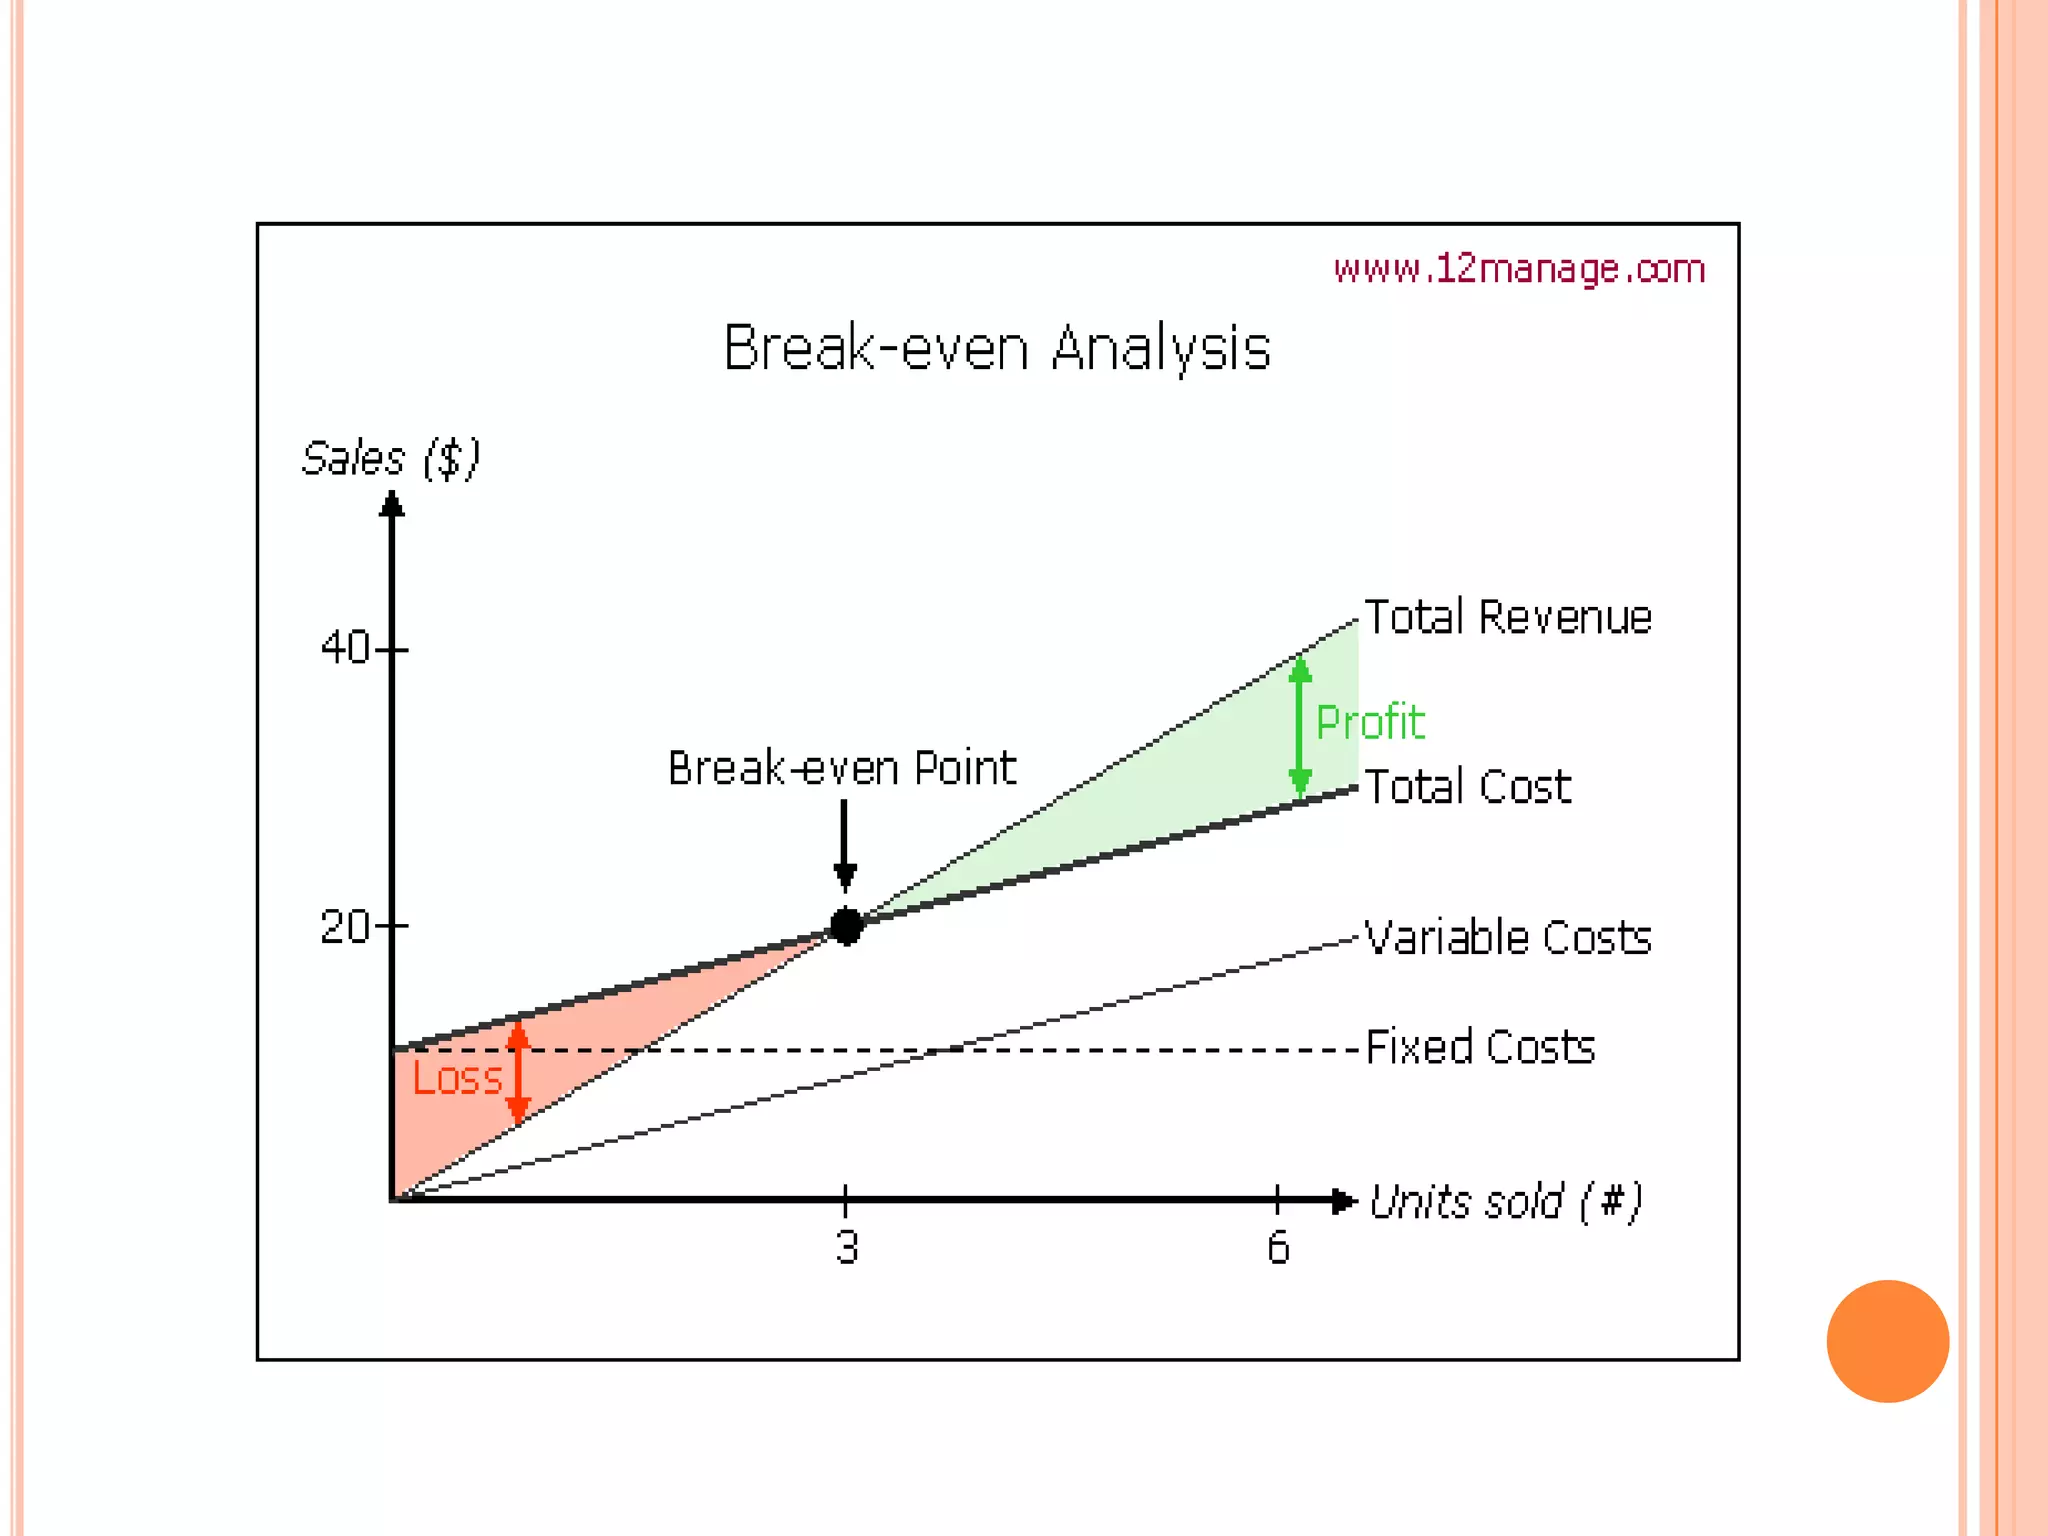
This document discusses break-even analysis, which is used to determine the sales volume needed for a company to cover its total costs. It defines break-even as the point where total revenue equals total costs, with no profit or loss. The formula for calculating break-even point is provided as fixed costs divided by contribution per unit. Examples are given of calculating break-even points based on variable costs, fixed costs, and unit price. Advantages and limitations of break-even analysis are also summarized.