Downloaded 868 times
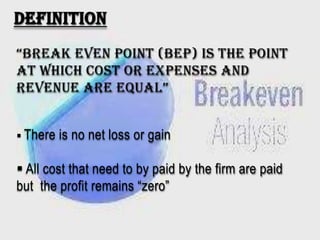
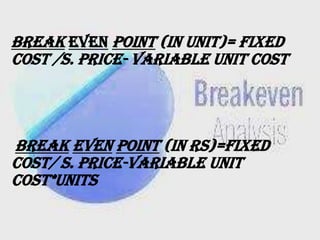
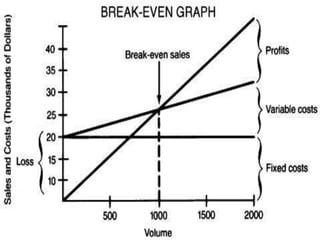
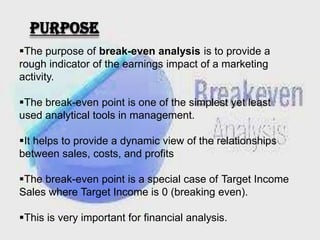
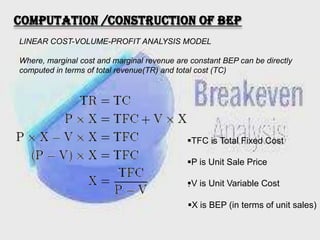
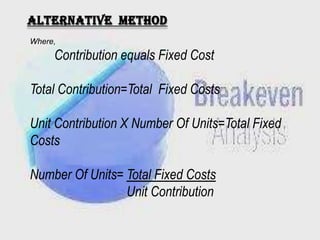
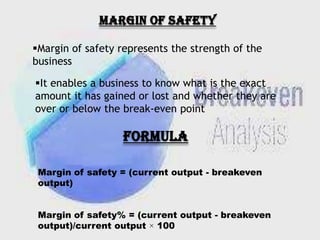
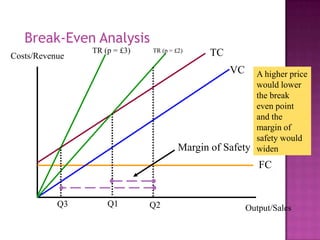

This document defines and explains break even analysis. It lists the group members and contents. Break even analysis determines the level of output needed for total revenue to equal total costs. It discusses calculating break even points using fixed and variable costs. The purpose is to provide a rough earnings indicator. Limitations include not accounting for demand changes. Calculators are available to assist with break even calculations.