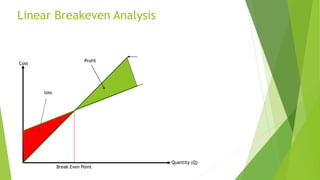
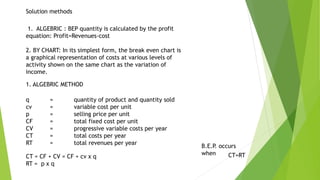
BREAK-EVEN ANALYSIS
By:
Rahat Inayat Ali
INTRODUCTION
It is a method for finding out
the minimum level of sales
necessary for a firm to just
start to make a profit
It examines the cost tradeoffs
associated with demand
volume.
Break-even analysis is analysis
of total costs-sale of product-
total revenue
Meaning
Break even analysis is actually an
analysis of break even point
Break Even Point
In economics it is the point at
which cost or expenses and
income are equal - there is no
net loss or gain, one has
"broken even".
The break even point for a product
is the point where total revenue
received equals total costs associated
with the sale of the product
i.e. CT=RT
CT = total costs
RT = total revenues
Linear Breakeven Analysis
Cost
Quantity (Q)
Break Even Point
Profit
loss
Break-even analysis
Break-even analysis can be an
effective tool in determining
the cost effectiveness of a
product.
Required quantities to avoid
loss.
When total revenue is equal to
total cost the process is at the
break-even point.
TC = TR
Use as a comparison tool for
making a decision
Solution methods
1. ALGEBRIC : BEP quantity is calculated by the profit
equation: Profit=Revenues-cost
2. BY CHART: In its simplest form, the break even chart is
a graphical representation of costs at various levels of
activity shown on the same chart as the variation of
income.
1. ALGEBRIC METHOD
q = quantity of product and quantity sold
cv = variable cost per unit
p = selling price per unit
CF = total fixed cost per unit
CV = progressive variable costs per year
CT = total costs per year
RT = total revenues per year
CT = CF + CV = CF + cv x q
RT = p x q
B.E.P. occurs
when CT=RT
Break Even Analysis

Break Even Analysis

  • 1.
  • 2.
    INTRODUCTION It is amethod for finding out the minimum level of sales necessary for a firm to just start to make a profit It examines the cost tradeoffs associated with demand volume.
  • 3.
    Break-even analysis isanalysis of total costs-sale of product- total revenue Meaning
  • 4.
    Break even analysisis actually an analysis of break even point Break Even Point In economics it is the point at which cost or expenses and income are equal - there is no net loss or gain, one has "broken even".
  • 5.
    The break evenpoint for a product is the point where total revenue received equals total costs associated with the sale of the product i.e. CT=RT CT = total costs RT = total revenues
  • 6.
    Linear Breakeven Analysis Cost Quantity(Q) Break Even Point Profit loss
  • 7.
    Break-even analysis Break-even analysiscan be an effective tool in determining the cost effectiveness of a product. Required quantities to avoid loss.
  • 8.
    When total revenueis equal to total cost the process is at the break-even point. TC = TR Use as a comparison tool for making a decision
  • 9.
    Solution methods 1. ALGEBRIC: BEP quantity is calculated by the profit equation: Profit=Revenues-cost 2. BY CHART: In its simplest form, the break even chart is a graphical representation of costs at various levels of activity shown on the same chart as the variation of income. 1. ALGEBRIC METHOD q = quantity of product and quantity sold cv = variable cost per unit p = selling price per unit CF = total fixed cost per unit CV = progressive variable costs per year CT = total costs per year RT = total revenues per year CT = CF + CV = CF + cv x q RT = p x q B.E.P. occurs when CT=RT