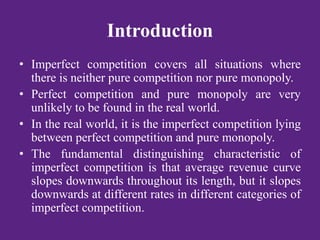
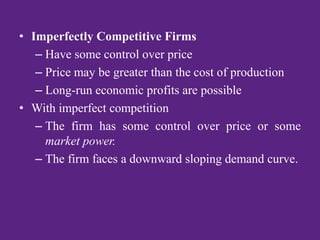
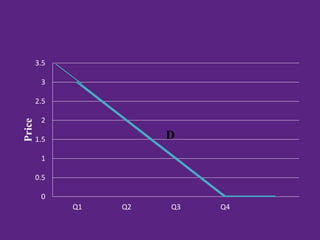
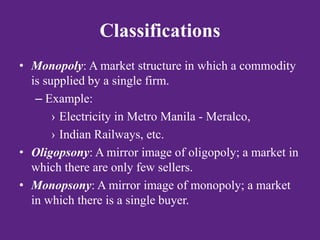
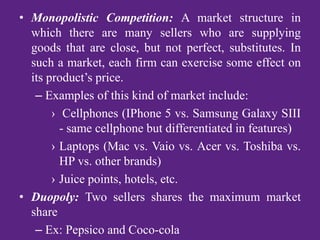
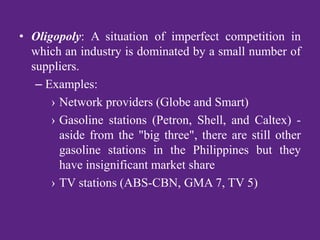
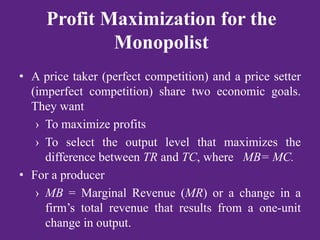
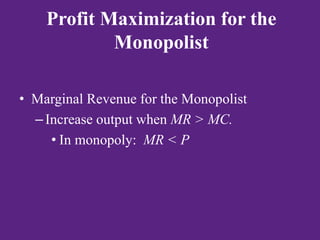
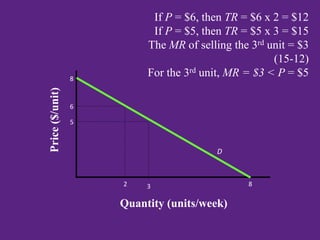
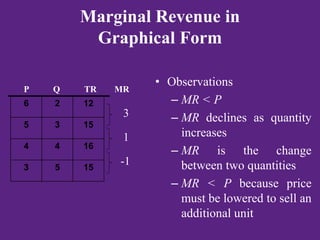
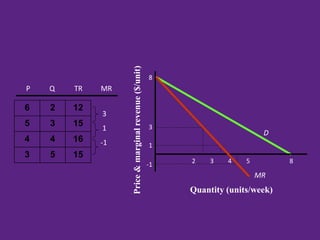
IMPERFECT
COMPETITION
Introduction
• Imperfect competition covers all situations where
there is neither pure competition nor pure monopoly.
• Perfect competition and pure monopoly are very
unlikely to be found in the real world.
• In the real world, it is the imperfect competition lying
between perfect competition and pure monopoly.
• The fundamental distinguishing characteristic of
imperfect competition is that average revenue curve
slopes downwards throughout its length, but it slopes
downwards at different rates in different categories of
imperfect competition.
• Imperfectly Competitive Firms
– Have some control over price
– Price may be greater than the cost of production
– Long-run economic profits are possible
• With imperfect competition
– The firm has some control over price or some
market power.
– The firm faces a downward sloping demand curve.
0
0.5
1
1.5
2
2.5
3
3.5
Q1 Q2 Q3 Q4
Price
D
Features
• Existence of large number of firms:
– The first important feature of monopolistic
competition is that there are a large number of
firms satisfying the market demand for the
product.
– As there are a large number of firms under
monopolistic competition, there exists stiff
competition between them. These firms do not
produce perfect substitutes. But the products are
close substitute for each other.
• Product differentiations:
– The various firms under monopolistic competition
bring out differentiated products which are
relatively close substitutes for each other. So their
prices cannot be very much different from each
other.
– Differentiation of the product may be real or
fancied.
– Real or physical differentiation is done through
differences in materials used, design, color etc.
– Further differentiation of a particular product may
be linked with the conditions of his sale, the
location of his shop, courteous behavior and fair
dealing etc.
• Absence of firm's interdependence:
– Under oligopoly, the firms are dependent upon
each other and can't fix up price independently.
But under monopolistic competition the case is not
so. Under monopolistic competition each firm acts
more or less independently. Each firm formulates
its own price-output policy upon its own demand
cost.
• Non-price competition:
– Firms under monopolistic competition incur a
considerable expenditure on advertisement and
selling costs so as to win over customers.
– In order to promote sale firms follow definite -
methods of competing rivals other than price.
– Advertisement is a prominent example of non-price
competition.
– The advertisement and other selling costs by a firm
change the demand for his product.
– The rival firms compete with each other through
advertisement by which they change the consumer's
wants for their products and attract more customers.
• Entry of the Firms is Free but not Frequent:
– In oligopolistic market, we don’t have a new firm
entering into it each day.
– E.g. In car manufacturing market, no new firm enters
frequently. As, a lot of money, a lot of product
differentiation and still greater courage to invest are
necessary.
Classifications
• Monopoly: A market structure in which a commodity
is supplied by a single firm.
– Example:
› Electricity in Metro Manila - Meralco,
› Indian Railways, etc.
• Oligopsony: A mirror image of oligopoly; a market in
which there are only few sellers.
• Monopsony: A mirror image of monopoly; a market
in which there is a single buyer.
• Monopolistic Competition: A market structure in
which there are many sellers who are supplying
goods that are close, but not perfect, substitutes. In
such a market, each firm can exercise some effect on
its product’s price.
– Examples of this kind of market include:
› Cellphones (IPhone 5 vs. Samsung Galaxy SIII
- same cellphone but differentiated in features)
› Laptops (Mac vs. Vaio vs. Acer vs. Toshiba vs.
HP vs. other brands)
› Juice points, hotels, etc.
• Duopoly: Two sellers shares the maximum market
share
– Ex: Pepsico and Coco-cola
• Oligopoly: A situation of imperfect competition in
which an industry is dominated by a small number of
suppliers.
– Examples:
› Network providers (Globe and Smart)
› Gasoline stations (Petron, Shell, and Caltex) -
aside from the "big three", there are still other
gasoline stations in the Philippines but they
have insignificant market share
› TV stations (ABS-CBN, GMA 7, TV 5)
Profit Maximization for the
Monopolist
• A price taker (perfect competition) and a price setter
(imperfect competition) share two economic goals.
They want
› To maximize profits
› To select the output level that maximizes the
difference between TR and TC, where MB= MC.
• For a producer
› MB = Marginal Revenue (MR) or a change in a
firm’s total revenue that results from a one-unit
change in output.
Profit Maximization for the
Monopolist
• Marginal Revenue for the Monopolist
–Increase output when MR > MC.
• In monopoly: MR < P
Price($/unit)
Quantity (units/week)
D
8
8
2
6
3
5
If P = $6, then TR = $6 x 2 = $12
If P = $5, then TR = $5 x 3 = $15
The MR of selling the 3rd unit = $3
(15-12)
For the 3rd unit, MR = $3 < P = $5
Marginal Revenue in
Graphical Form
• Observations
– MR < P
– MR declines as quantity
increases
– MR is the change
between two quantities
– MR < P because price
must be lowered to sell an
additional unit
6 2 12
5 3 15
4 4 16
3 5 15
P Q TR MR
3
1
-1
Price&marginalrevenue($/unit)
Quantity (units/week)
6 2 12
5 3 15
4 4 16
3 5 15
P Q TR MR
3
1
-1
8
8
D
432-1
3
5
1
MR
Price
Quantity
Observations
•The vertical intercept, a, is the same for
MR and D
•The horizontal intercept for MR, Q0/2,
is one half the demand intercept, Q0.
D
Q0
a
Q0/2
a/2
MR
Price Determination Under
Imperfect Competition
• UNDER MONOPOLISTIC COMPETITION:
– Under monopolistic competition, the firm will be in
equilibrium position when marginal revenue is equal to
marginal cost.
– So long, if the marginal revenue is greater than
marginal cost, the seller will find it profitable to
expand his output.
– And, if the MR is less than MC, it is obvious he will
reduce his output where the MR is equal to MC.
– In short run, therefore, the firm will be in equilibrium
when it is maximizing profits, i.e., when MR = MC.
Price($/unitofoutput)
Quantity (units/week)
6
D
3
12 24
Marginal Cost
2
4
MR
8
Observations
•If P = $3 & Q = 12 MR < MC and output should be reduced
•Profits are maximized at 8 units where MR = MC
•P = $4 where quantity demanded = quantity supplied
In Short Run Equilibrium
• The short run average cost is MT and short run
average revenue is MP. Since the AR curve is above
the AC curve, therefore, the profit is shown as PT. PT
is the supernormal profit per unit of output.
• Total supernormal profit will be measured by
multiplying the supernormal profit to the total output,
i.e. PT × OM or PTT’P’ as shown in figure (a). The
firm may also incur losses in the short run if it is
facing AR curve below the AC curve.
• In figure (b) MP is less than MT and TP is the loss
per unit of output. Total loss will be measured by
multiplying loss per unit of output to the total output,
i.e., TP × OM or TPP’T’.
In Long Run Equilibrium
• The supernormal profit in the long run is
disappeared as new firms are entered into the
industry.
• As the new firms are entered into the industry, the
demand curve or AR curve will shift to the left,
and therefore, the supernormal profit will be
competed away and the firms will be earning
normal profits.
• If in the short run firms are suffering from losses,
then in the long run some firms will leave the
industry so that remaining firms are earning
normal profits.
The Demand and Marginal Cost Curves for a
Monopolist
D
3
12
6
24
Marginal cost
The socially optimal
Amount occurs where
MC = D(MB) @ 12 units
Price($/unitofoutput)
Quantity (units/week)
2
4
MR
8
•The profit maximizing level of output of 8 units, where MR = MC,
is less than the socially optimal output of 12
•Between 8 and 12, MB to society > MC to society
•Cannot increase output because MR to the firms is less than MCPrice($/unitofoutput)
Quantity (units/week)
D
12
6
24
3
Marginal cost
2
4
MR
8
•Because MR < P, the monopoly produces less than the
socially optimal amount
•The deadweight loss of the monopoly to society =
(1/2)($2/unit)(4units/wk) = $4/wk.
Deadweight loss
Price($/unitofoutput)
Quantity (units/week)
D
12
6
24
3
Marginal cost
Deadweight Loss
• Difficulties in Reducing the Deadweight Loss of
Monopolies
– Enforcing antitrust laws
– Patents, copyrights, and innovation
– Natural monopolies
• Price Discrimination
– The practice of charging different buyers different
prices for essentially the same good or service
• Examples of Price Discrimination
– Senior citizens and student discounts on movie
tickets
– Supersaver discounts on air travel
– Rebate coupons
Group Equilibrium
• There are a number of firms producing
products . These collectively act as a group
and are called an Industry .
• The achievement of equilibrium and
attainment of optimum point is known as
Group Equilibrium .
• Example : Group of firms producing
Toothpastes .
30
Oligopoly
• A market with a few sellers.
• The essence of an oligopolistic industry is the need
for each firm to consider how its own actions affect
the decisions of its relatively few competitors.
• Oligopoly may be characterized by collusion or by
non-co-operation.
31
Collusion and cartels
• COLLUSION
– an explicit or implicit agreement between existing
firms to avoid or limit competition with one another.
• CARTEL
– is a situation in which formal agreements between
firms are legally permitted.
• e.g. OPEC
32
Collusion is difficult if
• There are many firms in the industry
• The product is not standardised
• Demand and cost conditions are changing
rapidly
• There are no barriers to entry
• Firms have surplus capacity
33
More on collusion
• The probability of cheating may be affected by
agreement or threats.
• Pre-commitment
– an arrangement, entered voluntarily, restricting future
options.
• Credible threat
– a threat which, after the fact, is optimal to carry out.
34
The kinked demand curve
Q0
P0
Quantity
£
Consider how a firm may
perceive its demand curve
under oligopoly.
It can observe the current
price and output,
but must try to anticipate
rival reactions to any
price change.
35
Q0
P0
Quantity
£
The kinked demand curve (2)
The firm may expect rivals
to respond if it reduces
its price, as this will be seen
as an aggressive move
… so demand in response
to a price reduction is likely
to be relatively inelastic.
The demand curve will
be steep below P0.D
36
The kinked demand curve (3)
… but for a price increase
rivals are less likely to
react,
so demand may be
relatively elastic
above P0
so the firm perceives
that it faces a kinked
demand curve.
D
Q0
P0
Quantity
£
37
The kinked demand curve (4)
Given this perception, the
firm sees that revenue will
fall whether price is increased
or decreased,
so the best strategy is to keep
price at P0.
Price will tend to be stable,
even in the face of an increase
in marginal cost.
D
Q0
P0
Quantity
£
MC1
MC2
MR
Thank You!!

Imprefect

  • 1.
  • 2.
    Introduction • Imperfect competitioncovers all situations where there is neither pure competition nor pure monopoly. • Perfect competition and pure monopoly are very unlikely to be found in the real world. • In the real world, it is the imperfect competition lying between perfect competition and pure monopoly. • The fundamental distinguishing characteristic of imperfect competition is that average revenue curve slopes downwards throughout its length, but it slopes downwards at different rates in different categories of imperfect competition.
  • 3.
    • Imperfectly CompetitiveFirms – Have some control over price – Price may be greater than the cost of production – Long-run economic profits are possible • With imperfect competition – The firm has some control over price or some market power. – The firm faces a downward sloping demand curve.
  • 4.
  • 5.
    Features • Existence oflarge number of firms: – The first important feature of monopolistic competition is that there are a large number of firms satisfying the market demand for the product. – As there are a large number of firms under monopolistic competition, there exists stiff competition between them. These firms do not produce perfect substitutes. But the products are close substitute for each other.
  • 6.
    • Product differentiations: –The various firms under monopolistic competition bring out differentiated products which are relatively close substitutes for each other. So their prices cannot be very much different from each other. – Differentiation of the product may be real or fancied. – Real or physical differentiation is done through differences in materials used, design, color etc. – Further differentiation of a particular product may be linked with the conditions of his sale, the location of his shop, courteous behavior and fair dealing etc.
  • 7.
    • Absence offirm's interdependence: – Under oligopoly, the firms are dependent upon each other and can't fix up price independently. But under monopolistic competition the case is not so. Under monopolistic competition each firm acts more or less independently. Each firm formulates its own price-output policy upon its own demand cost. • Non-price competition: – Firms under monopolistic competition incur a considerable expenditure on advertisement and selling costs so as to win over customers. – In order to promote sale firms follow definite - methods of competing rivals other than price.
  • 8.
    – Advertisement isa prominent example of non-price competition. – The advertisement and other selling costs by a firm change the demand for his product. – The rival firms compete with each other through advertisement by which they change the consumer's wants for their products and attract more customers. • Entry of the Firms is Free but not Frequent: – In oligopolistic market, we don’t have a new firm entering into it each day. – E.g. In car manufacturing market, no new firm enters frequently. As, a lot of money, a lot of product differentiation and still greater courage to invest are necessary.
  • 9.
    Classifications • Monopoly: Amarket structure in which a commodity is supplied by a single firm. – Example: › Electricity in Metro Manila - Meralco, › Indian Railways, etc. • Oligopsony: A mirror image of oligopoly; a market in which there are only few sellers. • Monopsony: A mirror image of monopoly; a market in which there is a single buyer.
  • 10.
    • Monopolistic Competition:A market structure in which there are many sellers who are supplying goods that are close, but not perfect, substitutes. In such a market, each firm can exercise some effect on its product’s price. – Examples of this kind of market include: › Cellphones (IPhone 5 vs. Samsung Galaxy SIII - same cellphone but differentiated in features) › Laptops (Mac vs. Vaio vs. Acer vs. Toshiba vs. HP vs. other brands) › Juice points, hotels, etc. • Duopoly: Two sellers shares the maximum market share – Ex: Pepsico and Coco-cola
  • 11.
    • Oligopoly: Asituation of imperfect competition in which an industry is dominated by a small number of suppliers. – Examples: › Network providers (Globe and Smart) › Gasoline stations (Petron, Shell, and Caltex) - aside from the "big three", there are still other gasoline stations in the Philippines but they have insignificant market share › TV stations (ABS-CBN, GMA 7, TV 5)
  • 12.
    Profit Maximization forthe Monopolist • A price taker (perfect competition) and a price setter (imperfect competition) share two economic goals. They want › To maximize profits › To select the output level that maximizes the difference between TR and TC, where MB= MC. • For a producer › MB = Marginal Revenue (MR) or a change in a firm’s total revenue that results from a one-unit change in output.
  • 13.
    Profit Maximization forthe Monopolist • Marginal Revenue for the Monopolist –Increase output when MR > MC. • In monopoly: MR < P
  • 14.
    Price($/unit) Quantity (units/week) D 8 8 2 6 3 5 If P= $6, then TR = $6 x 2 = $12 If P = $5, then TR = $5 x 3 = $15 The MR of selling the 3rd unit = $3 (15-12) For the 3rd unit, MR = $3 < P = $5
  • 15.
    Marginal Revenue in GraphicalForm • Observations – MR < P – MR declines as quantity increases – MR is the change between two quantities – MR < P because price must be lowered to sell an additional unit 6 2 12 5 3 15 4 4 16 3 5 15 P Q TR MR 3 1 -1
  • 16.
    Price&marginalrevenue($/unit) Quantity (units/week) 6 212 5 3 15 4 4 16 3 5 15 P Q TR MR 3 1 -1 8 8 D 432-1 3 5 1 MR
  • 17.
    Price Quantity Observations •The vertical intercept,a, is the same for MR and D •The horizontal intercept for MR, Q0/2, is one half the demand intercept, Q0. D Q0 a Q0/2 a/2 MR
  • 18.
    Price Determination Under ImperfectCompetition • UNDER MONOPOLISTIC COMPETITION: – Under monopolistic competition, the firm will be in equilibrium position when marginal revenue is equal to marginal cost. – So long, if the marginal revenue is greater than marginal cost, the seller will find it profitable to expand his output. – And, if the MR is less than MC, it is obvious he will reduce his output where the MR is equal to MC. – In short run, therefore, the firm will be in equilibrium when it is maximizing profits, i.e., when MR = MC.
  • 19.
    Price($/unitofoutput) Quantity (units/week) 6 D 3 12 24 MarginalCost 2 4 MR 8 Observations •If P = $3 & Q = 12 MR < MC and output should be reduced •Profits are maximized at 8 units where MR = MC •P = $4 where quantity demanded = quantity supplied
  • 20.
    In Short RunEquilibrium • The short run average cost is MT and short run average revenue is MP. Since the AR curve is above the AC curve, therefore, the profit is shown as PT. PT is the supernormal profit per unit of output. • Total supernormal profit will be measured by multiplying the supernormal profit to the total output, i.e. PT × OM or PTT’P’ as shown in figure (a). The firm may also incur losses in the short run if it is facing AR curve below the AC curve. • In figure (b) MP is less than MT and TP is the loss per unit of output. Total loss will be measured by multiplying loss per unit of output to the total output, i.e., TP × OM or TPP’T’.
  • 22.
    In Long RunEquilibrium • The supernormal profit in the long run is disappeared as new firms are entered into the industry. • As the new firms are entered into the industry, the demand curve or AR curve will shift to the left, and therefore, the supernormal profit will be competed away and the firms will be earning normal profits. • If in the short run firms are suffering from losses, then in the long run some firms will leave the industry so that remaining firms are earning normal profits.
  • 24.
    The Demand andMarginal Cost Curves for a Monopolist D 3 12 6 24 Marginal cost The socially optimal Amount occurs where MC = D(MB) @ 12 units Price($/unitofoutput) Quantity (units/week)
  • 25.
    2 4 MR 8 •The profit maximizinglevel of output of 8 units, where MR = MC, is less than the socially optimal output of 12 •Between 8 and 12, MB to society > MC to society •Cannot increase output because MR to the firms is less than MCPrice($/unitofoutput) Quantity (units/week) D 12 6 24 3 Marginal cost
  • 26.
    2 4 MR 8 •Because MR <P, the monopoly produces less than the socially optimal amount •The deadweight loss of the monopoly to society = (1/2)($2/unit)(4units/wk) = $4/wk. Deadweight loss Price($/unitofoutput) Quantity (units/week) D 12 6 24 3 Marginal cost
  • 27.
  • 28.
    • Difficulties inReducing the Deadweight Loss of Monopolies – Enforcing antitrust laws – Patents, copyrights, and innovation – Natural monopolies • Price Discrimination – The practice of charging different buyers different prices for essentially the same good or service • Examples of Price Discrimination – Senior citizens and student discounts on movie tickets – Supersaver discounts on air travel – Rebate coupons
  • 29.
    Group Equilibrium • Thereare a number of firms producing products . These collectively act as a group and are called an Industry . • The achievement of equilibrium and attainment of optimum point is known as Group Equilibrium . • Example : Group of firms producing Toothpastes .
  • 30.
    30 Oligopoly • A marketwith a few sellers. • The essence of an oligopolistic industry is the need for each firm to consider how its own actions affect the decisions of its relatively few competitors. • Oligopoly may be characterized by collusion or by non-co-operation.
  • 31.
    31 Collusion and cartels •COLLUSION – an explicit or implicit agreement between existing firms to avoid or limit competition with one another. • CARTEL – is a situation in which formal agreements between firms are legally permitted. • e.g. OPEC
  • 32.
    32 Collusion is difficultif • There are many firms in the industry • The product is not standardised • Demand and cost conditions are changing rapidly • There are no barriers to entry • Firms have surplus capacity
  • 33.
    33 More on collusion •The probability of cheating may be affected by agreement or threats. • Pre-commitment – an arrangement, entered voluntarily, restricting future options. • Credible threat – a threat which, after the fact, is optimal to carry out.
  • 34.
    34 The kinked demandcurve Q0 P0 Quantity £ Consider how a firm may perceive its demand curve under oligopoly. It can observe the current price and output, but must try to anticipate rival reactions to any price change.
  • 35.
    35 Q0 P0 Quantity £ The kinked demandcurve (2) The firm may expect rivals to respond if it reduces its price, as this will be seen as an aggressive move … so demand in response to a price reduction is likely to be relatively inelastic. The demand curve will be steep below P0.D
  • 36.
    36 The kinked demandcurve (3) … but for a price increase rivals are less likely to react, so demand may be relatively elastic above P0 so the firm perceives that it faces a kinked demand curve. D Q0 P0 Quantity £
  • 37.
    37 The kinked demandcurve (4) Given this perception, the firm sees that revenue will fall whether price is increased or decreased, so the best strategy is to keep price at P0. Price will tend to be stable, even in the face of an increase in marginal cost. D Q0 P0 Quantity £ MC1 MC2 MR
  • 38.