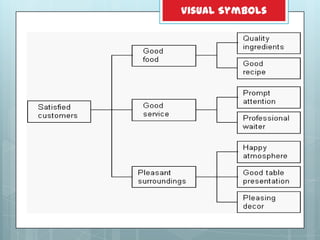
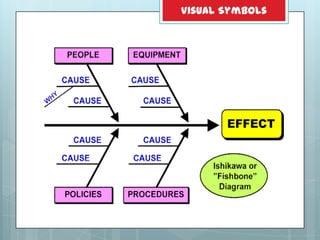
Downloaded 1,015 times


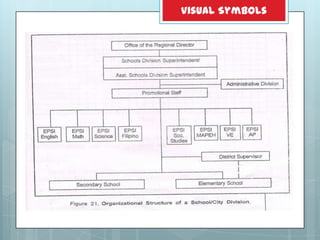
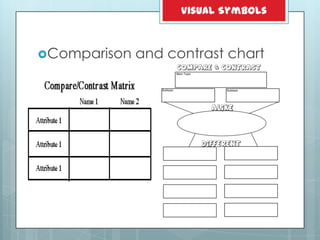

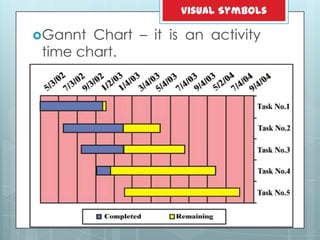


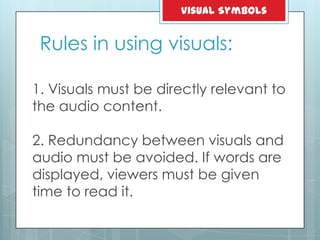

This document defines visual symbols and discusses their instructional use. It identifies various types of visual symbols like drawings, cartoons, strip drawings, diagrams, charts, graphs and maps. It provides examples and guidelines for each type. The document emphasizes that visual symbols can represent and communicate complex information more effectively than text alone. It concludes that teachers should skillfully create and incorporate relevant visual symbols to enhance student engagement and learning.


