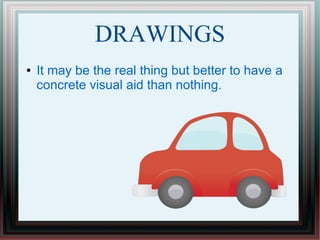
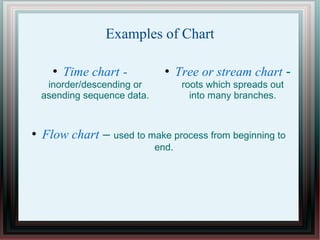
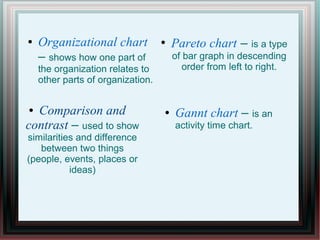
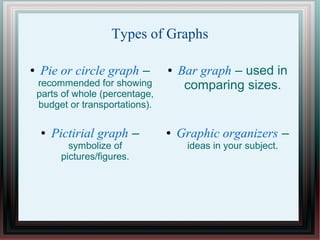
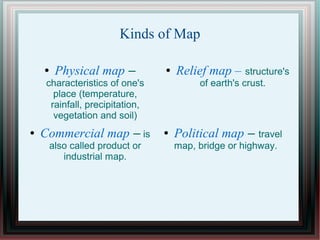
VISUAL SYMBOLS
It Includes :
● Drawings ● Cartoons ● Strip
Drawings
● Charts● Formulas● Diagrams
● Graphs ● Maps
● Globes
DRAWINGS
● It may be the real thing but better to have a
concrete visual aid than nothing.
CARTOONS
● A first–rate cartoon tells its story
metaphorically. The perfect cartoon needs
no caption. The less the artists depends on
words, the more effective the symbolism.
The symbolism conveys the message.
STRIP DRAWINGS
● These are commonly called comics or
comic strip.
DIAGRAMS
● It is “ any line drawings that shows
arrangement and relations as of parts to the
whole, relative values, origins and
development, chronological fluctuations,
distribution.”
Types of Diagram
●
Affinity diagram -
used to cluster complex
apparently unrelated data
into a natural and
meaningful groups.
●
Tree diagram - used to
chart out.
● Fishbone diagram – it is also called cause-and-effect
diagram. It is most commonly used to analyze work-
related problems.
CHARTS
● Is a diagrammatic representation of
relationships among individuals within an
organization.
Examples of Chart
●
Time chart -
inorder/descending or
asending sequence data.
●
Tree or stream chart -
roots which spreads out
into many branches.
●
Flow chart – used to make process from beginning to
end.
● Organizational chart
– shows how one part of
the organization relates to
other parts of organization.
●
Pareto chart – is a type
of bar graph in descending
order from left to right.
● Gannt chart – is an
activity time chart.
● Comparison and
contrast – used to show
similarities and difference
between two things
(people, events, places or
ideas)
GRAPHS
Types of Graphs
● Pie or circle graph –
recommended for showing
parts of whole (percentage,
budget or transportations).
● Bar graph – used in
comparing sizes.
● Graphic organizers –
ideas in your subject.
● Pictirial graph –
symbolize of
pictures/figures.
MAPS
● Is a “ representation of the surface of the
earth or some part of it...”
Kinds of Map
● Physical map –
characteristics of one's
place (temperature,
rainfall, precipitation,
vegetation and soil)
● Relief map – structure's
of earth's crust.
● Political map – travel
map, bridge or highway.
● Commercial map – is
also called product or
industrial map.
● Visual symbols come in many forms –
drawings,cartoons, strip drawing (comic strip) diagram,
map, chart, graph. For these visual symbols to be at your
finger tips, you ought to be skilled at making them.
● The collection, preparation and use of these various visual
symbols depend to a great extent on your own
resourcefulness and creativity.
● They may be used in different ways and in different phases
of the lesson depending on your purpose.
Questions
● What is visual symbols? What are the 9 forms of it?
● What are the types of diagram?
● Give the 7 examples of charts.
● What are the types of graphs and describe each types?
● Define what is map.
● Kinds of map.
● Make a tree chart by creating your own genealogy tree. Go
as many generations as you can go. Interview your parents
and grandparents.
Prepared by :
Jhannice Stephanie M. Gonzales
2EED – 2A
Submitted to :
Mam Jaydee De Leon

Edtech slide share

  • 1.
  • 2.
    It Includes : ●Drawings ● Cartoons ● Strip Drawings ● Charts● Formulas● Diagrams
  • 3.
    ● Graphs ●Maps ● Globes
  • 4.
    DRAWINGS ● It maybe the real thing but better to have a concrete visual aid than nothing.
  • 5.
    CARTOONS ● A first–ratecartoon tells its story metaphorically. The perfect cartoon needs no caption. The less the artists depends on words, the more effective the symbolism. The symbolism conveys the message.
  • 6.
    STRIP DRAWINGS ● Theseare commonly called comics or comic strip.
  • 7.
    DIAGRAMS ● It is“ any line drawings that shows arrangement and relations as of parts to the whole, relative values, origins and development, chronological fluctuations, distribution.”
  • 8.
    Types of Diagram ● Affinitydiagram - used to cluster complex apparently unrelated data into a natural and meaningful groups. ● Tree diagram - used to chart out. ● Fishbone diagram – it is also called cause-and-effect diagram. It is most commonly used to analyze work- related problems.
  • 9.
    CHARTS ● Is adiagrammatic representation of relationships among individuals within an organization.
  • 10.
    Examples of Chart ● Timechart - inorder/descending or asending sequence data. ● Tree or stream chart - roots which spreads out into many branches. ● Flow chart – used to make process from beginning to end.
  • 11.
    ● Organizational chart –shows how one part of the organization relates to other parts of organization. ● Pareto chart – is a type of bar graph in descending order from left to right. ● Gannt chart – is an activity time chart. ● Comparison and contrast – used to show similarities and difference between two things (people, events, places or ideas)
  • 12.
  • 13.
    Types of Graphs ●Pie or circle graph – recommended for showing parts of whole (percentage, budget or transportations). ● Bar graph – used in comparing sizes. ● Graphic organizers – ideas in your subject. ● Pictirial graph – symbolize of pictures/figures.
  • 14.
    MAPS ● Is a“ representation of the surface of the earth or some part of it...”
  • 15.
    Kinds of Map ●Physical map – characteristics of one's place (temperature, rainfall, precipitation, vegetation and soil) ● Relief map – structure's of earth's crust. ● Political map – travel map, bridge or highway. ● Commercial map – is also called product or industrial map.
  • 16.
    ● Visual symbolscome in many forms – drawings,cartoons, strip drawing (comic strip) diagram, map, chart, graph. For these visual symbols to be at your finger tips, you ought to be skilled at making them. ● The collection, preparation and use of these various visual symbols depend to a great extent on your own resourcefulness and creativity. ● They may be used in different ways and in different phases of the lesson depending on your purpose.
  • 17.
    Questions ● What isvisual symbols? What are the 9 forms of it? ● What are the types of diagram? ● Give the 7 examples of charts. ● What are the types of graphs and describe each types? ● Define what is map. ● Kinds of map. ● Make a tree chart by creating your own genealogy tree. Go as many generations as you can go. Interview your parents and grandparents.
  • 18.
    Prepared by : JhanniceStephanie M. Gonzales 2EED – 2A Submitted to : Mam Jaydee De Leon