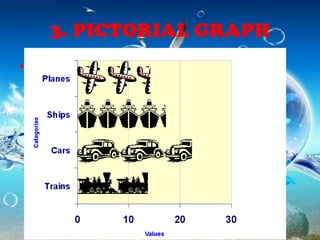
TEACHING WITH VISUAL
      SYMBOLS
GRAPH
• A graph is worth a thousand words
  such as
  – drawings,
  – cartoons,
  – strip drawings,
  – diagrams,
  – and maps
• They are more clearly understood
  than mere words.
A. DRAWINGS
• It may not be a real thing but better
  to have a concrete visual aid than
  nothing.
• It is good that our drawing correctly
  represents the real thing.
• Example is stick drawings
B. CARTOONS
• A first-rate cartoon tells its story
  metaphorically.
• The perfect cartoon needs no
  caption.
• The symbolism conveys the message.
C. STRIP DRAWINGS
• It is commonly called comic or comic
  strip.
Where to Use Strip Drawing
     in instruction?


       MOTIVATION

         ACTIVITY
SOURCES OF STRIP DRAWING


NEWSPAPERS
             MAGAZINES   BOOKS
D. DIAGRAMS
• Any line drawing that shows
  arrangement and relations as of
  parts to the whole, relative values,
  origins and development,
  chronological fluctuations, and
  distribution.
• To emphasize the key points in your
  diagram, make use of color.
TYPES OF A DIAGRAM
A.AFFINITY DIAGRAM
Used to cluster complex apparently
 unrelated data into natural and
 meaningful groups.
B. TREE DIAGRAM
Used to chart out, in increasing
 detail, the various tasks that must
 be accomplished to complete a
 project or achieve a specific goal.
C. FISHBONE DIAGRAM
It is also called cause-and-effect
 diagram.
It is structured form of brainstorming
 that graphically shows the relationship
 of possible causes and sub causes
 directly related to an identified
 effect/problem.
It is commonly used to analyze work-
 related problems.
E. CHARTS
• A diagrammatic representation of
  relations among individuals within an
  organization.
 We have 7 charts:
 1.Time chart
 2.Tree or Stream chart
 3.Flow chart
 4.Organizational chart
 5.Comparison and contrast chart
 6.Pareto chart
 7.Gantt chart
1. TIME CHART
• Is a tabular time chart that presents
  data in ordinal sequence
2. TREE or STREAM CHART
• Depicts development, growth and
  change by beginning with a single
  course (the trunk) which spreads
  out into many branches; or by
  beginning with the many tributaries
  which c then coverage into a single
  channel.
3. FLOW CHART
• Is visual way of charting or showing
  a process from beginning to end.
• It is means of analyzing a process.
• By outlining every step in a process,
  you can begin to find inefficiencies
  or problems.
4. ORGANIZATIONAL CHART
• Shows how one part of the
  organization relates to other parts of
  the organization.
5. COMPARISON and
     CONTRAST
6. PARETO CHART
• A type of bar chart, prioritized in
  descending order of magnitude or
  importance from left to right.
• It shows at a glance which factors
  are occuring.
7. GANNT CHART
• Is an activity time chart.
F. GRAPHS
• FOUR TYPES OF GRAPHS
1. Circle or Pie graph
2. Bar graph
3. Pictorial graph
4. Line graph
2. BAR GRAPH
• Used in comparing the magnitude of
  similar items at different ties or seeing
  relative sizes of the parts of a whole.
1. PIE GRAPH
• Recommended for showing parts of
  whole.
3. PICTORIAL GRAPH
• Makes use of picture symbols.
4. LINE GRAPH
G. MAPS
• A representation of the surface of
  the earth or some part of it.
Kinds of Map
1. Physical map
Combines in a single projection data
  like altitude, temperature, rainfall,
  precipitation, vegetation, and soil.
2. Relief map
Has three dimensional
  representations and show contours
  of the physical data of the earth or
  part of the earth.
3. Commercial or economic map
Also called product or industrial
  map since they show land areas in
  relation to the economy.
4. Political map
Gives detailed information about
  country, province, cities and towns,
  roads and highways.
Oceans, rivers and lakes are the main
  features of most political maps.
MAP LANGUAGE

Scale
Symbols
Color
Geographic grids
Understanding maps and graphs
1. Read the titles and subtitles
2. Read the key, and/or the legend, and
   the scale of miles whenever any of
   these is present
3. Read the information shown along the
   side and the bottom of graphs and
   charts and tables, if any.
4. Determine your purpose for reading
   the map, chart, table, or graph.
Eductechreport

Eductechreport

  • 1.
  • 2.
    GRAPH • A graphis worth a thousand words such as – drawings, – cartoons, – strip drawings, – diagrams, – and maps • They are more clearly understood than mere words.
  • 3.
    A. DRAWINGS • Itmay not be a real thing but better to have a concrete visual aid than nothing. • It is good that our drawing correctly represents the real thing. • Example is stick drawings
  • 4.
    B. CARTOONS • Afirst-rate cartoon tells its story metaphorically. • The perfect cartoon needs no caption. • The symbolism conveys the message.
  • 5.
    C. STRIP DRAWINGS •It is commonly called comic or comic strip.
  • 6.
    Where to UseStrip Drawing in instruction? MOTIVATION ACTIVITY
  • 7.
    SOURCES OF STRIPDRAWING NEWSPAPERS MAGAZINES BOOKS
  • 8.
    D. DIAGRAMS • Anyline drawing that shows arrangement and relations as of parts to the whole, relative values, origins and development, chronological fluctuations, and distribution. • To emphasize the key points in your diagram, make use of color.
  • 9.
    TYPES OF ADIAGRAM A.AFFINITY DIAGRAM Used to cluster complex apparently unrelated data into natural and meaningful groups.
  • 10.
    B. TREE DIAGRAM Usedto chart out, in increasing detail, the various tasks that must be accomplished to complete a project or achieve a specific goal.
  • 11.
    C. FISHBONE DIAGRAM Itis also called cause-and-effect diagram. It is structured form of brainstorming that graphically shows the relationship of possible causes and sub causes directly related to an identified effect/problem. It is commonly used to analyze work- related problems.
  • 12.
    E. CHARTS • Adiagrammatic representation of relations among individuals within an organization. We have 7 charts: 1.Time chart 2.Tree or Stream chart 3.Flow chart 4.Organizational chart 5.Comparison and contrast chart 6.Pareto chart 7.Gantt chart
  • 13.
    1. TIME CHART •Is a tabular time chart that presents data in ordinal sequence
  • 14.
    2. TREE orSTREAM CHART • Depicts development, growth and change by beginning with a single course (the trunk) which spreads out into many branches; or by beginning with the many tributaries which c then coverage into a single channel.
  • 15.
    3. FLOW CHART •Is visual way of charting or showing a process from beginning to end. • It is means of analyzing a process. • By outlining every step in a process, you can begin to find inefficiencies or problems.
  • 16.
    4. ORGANIZATIONAL CHART •Shows how one part of the organization relates to other parts of the organization.
  • 17.
  • 18.
    6. PARETO CHART •A type of bar chart, prioritized in descending order of magnitude or importance from left to right. • It shows at a glance which factors are occuring.
  • 19.
    7. GANNT CHART •Is an activity time chart.
  • 20.
    F. GRAPHS • FOURTYPES OF GRAPHS 1. Circle or Pie graph 2. Bar graph 3. Pictorial graph 4. Line graph
  • 21.
    2. BAR GRAPH •Used in comparing the magnitude of similar items at different ties or seeing relative sizes of the parts of a whole.
  • 22.
    1. PIE GRAPH •Recommended for showing parts of whole.
  • 23.
    3. PICTORIAL GRAPH •Makes use of picture symbols.
  • 24.
  • 25.
    G. MAPS • Arepresentation of the surface of the earth or some part of it.
  • 26.
    Kinds of Map 1.Physical map Combines in a single projection data like altitude, temperature, rainfall, precipitation, vegetation, and soil.
  • 27.
    2. Relief map Hasthree dimensional representations and show contours of the physical data of the earth or part of the earth.
  • 28.
    3. Commercial oreconomic map Also called product or industrial map since they show land areas in relation to the economy.
  • 29.
    4. Political map Givesdetailed information about country, province, cities and towns, roads and highways. Oceans, rivers and lakes are the main features of most political maps.
  • 30.
  • 31.
    Understanding maps andgraphs 1. Read the titles and subtitles 2. Read the key, and/or the legend, and the scale of miles whenever any of these is present 3. Read the information shown along the side and the bottom of graphs and charts and tables, if any. 4. Determine your purpose for reading the map, chart, table, or graph.