Downloaded 237 times
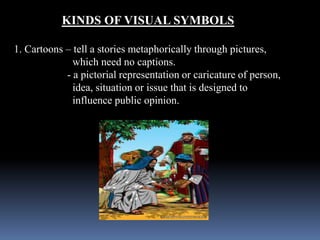

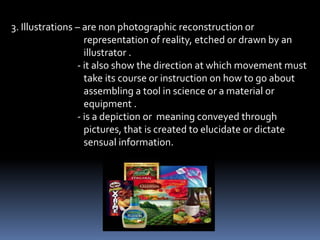
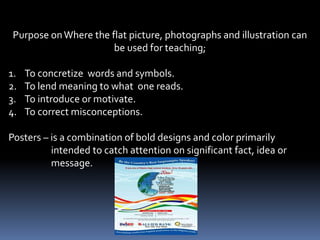

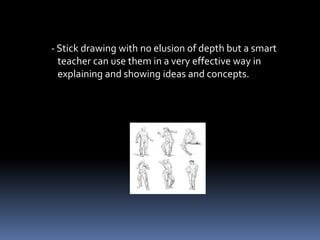
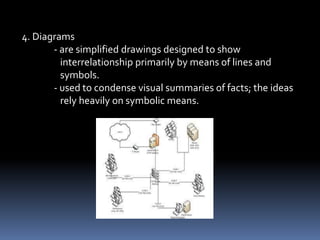


This document discusses various visual symbols that can be used for teaching, including their purposes and characteristics. It describes cartoons, photographs, illustrations, posters, drawings, diagrams, charts, graphs, and flashcards. For each type of visual symbol, the document provides examples and discusses how to effectively design and use them, such as making sure they are relevant, clear, and large enough for students to see. The overall purpose of visual symbols is to complement and reinforce the information being taught.


