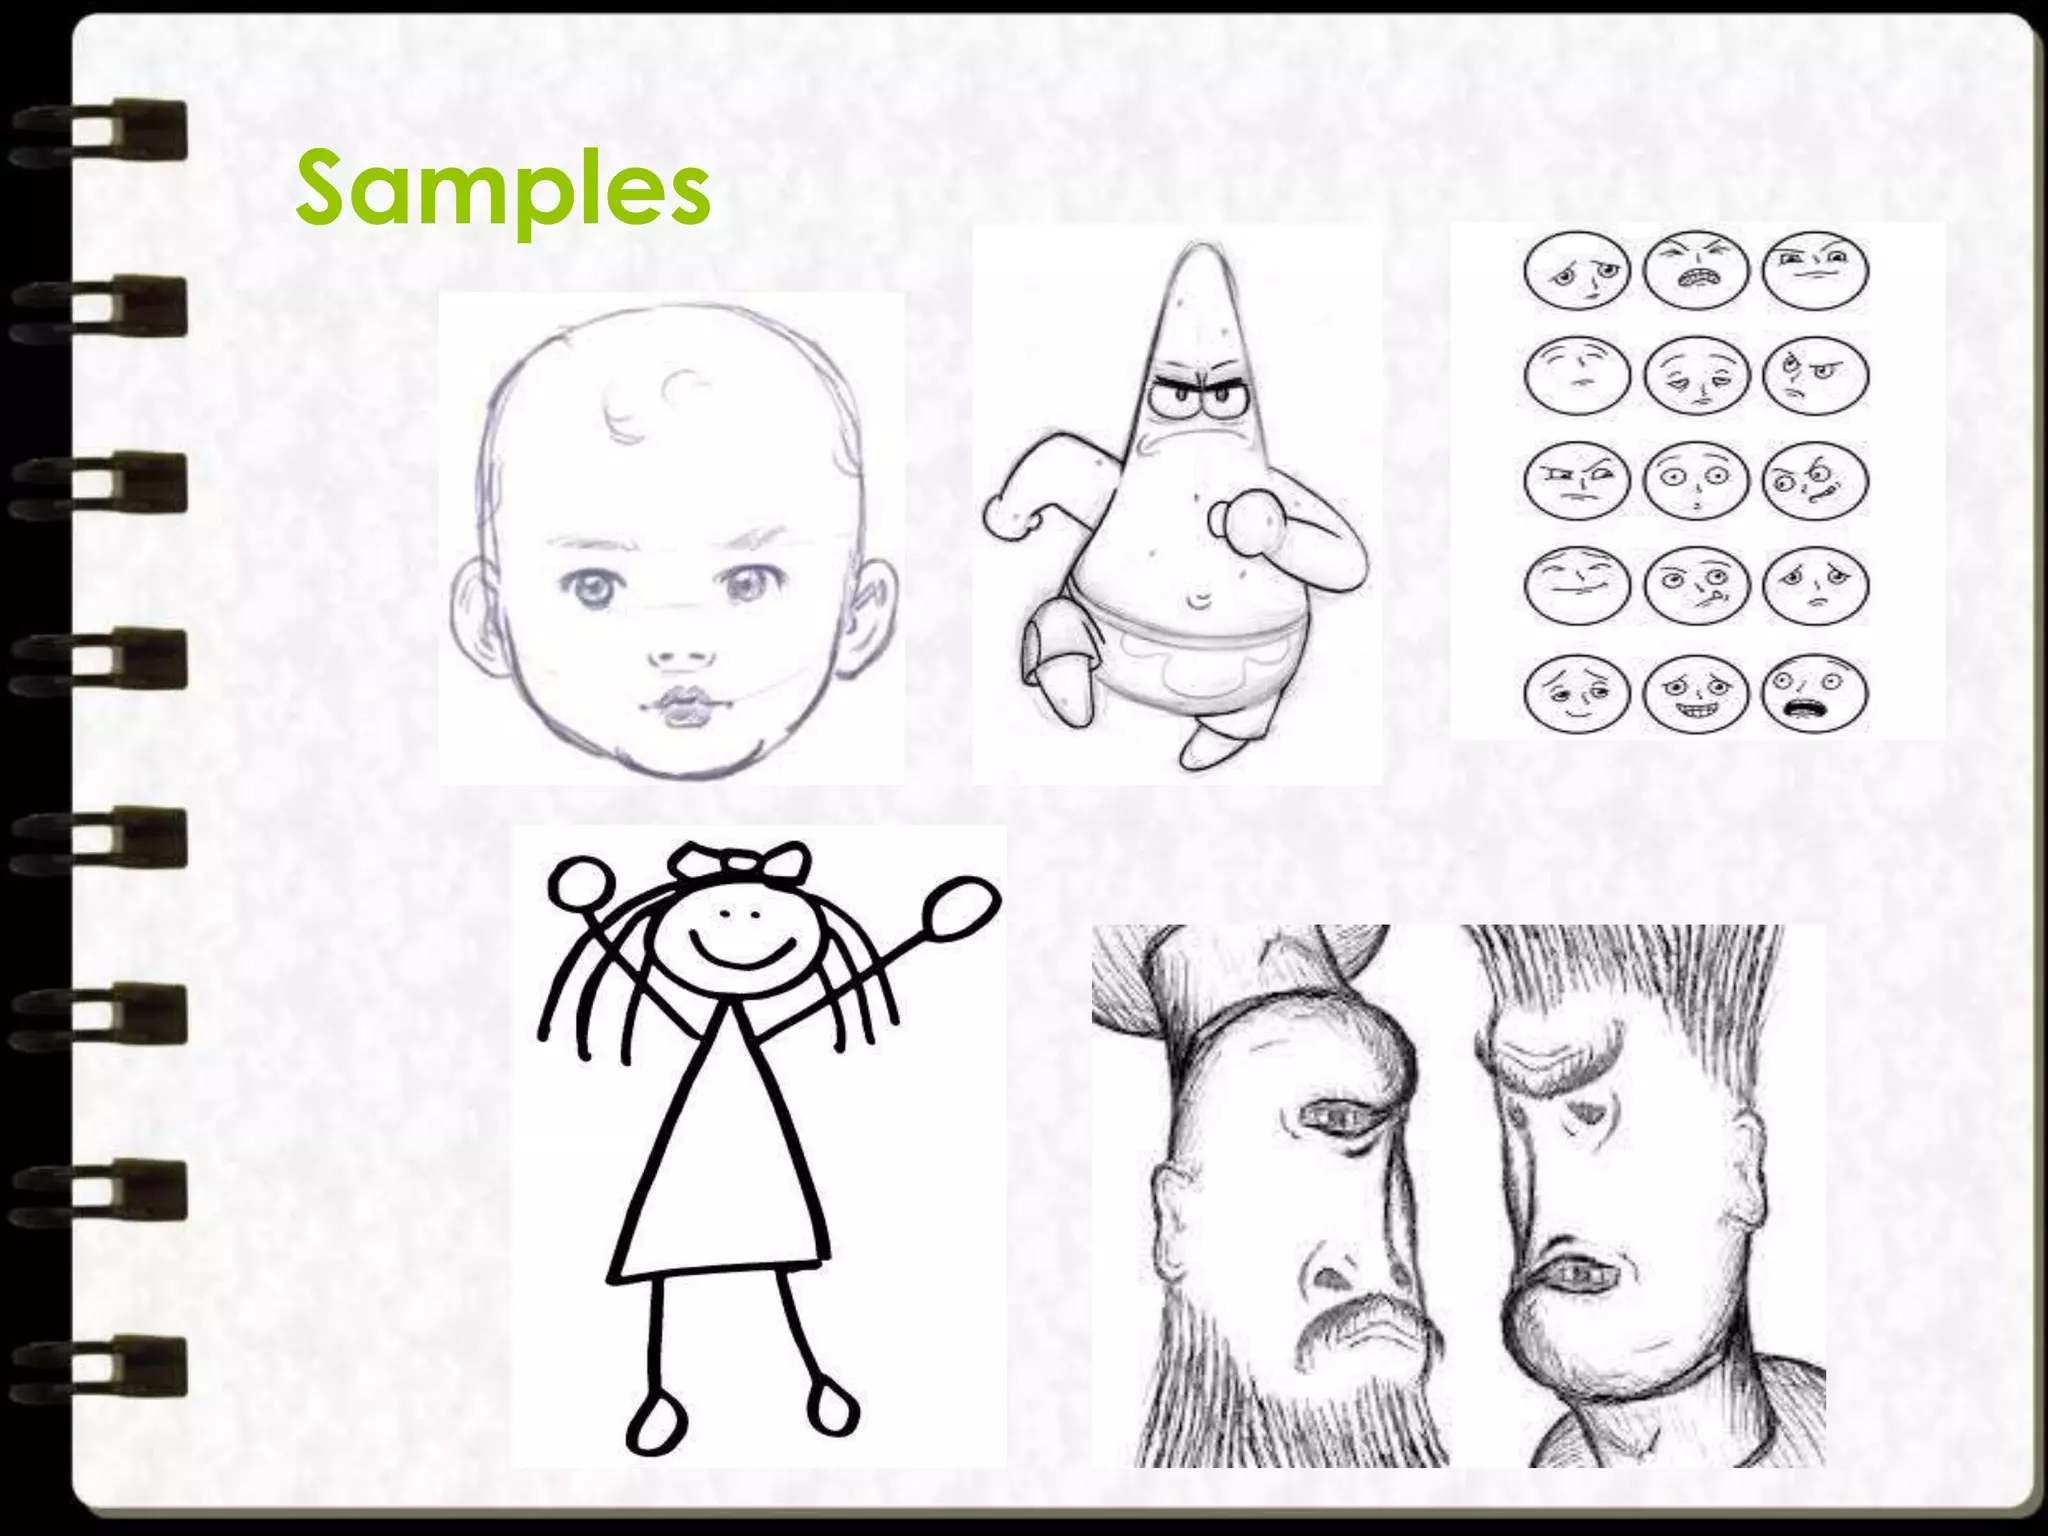
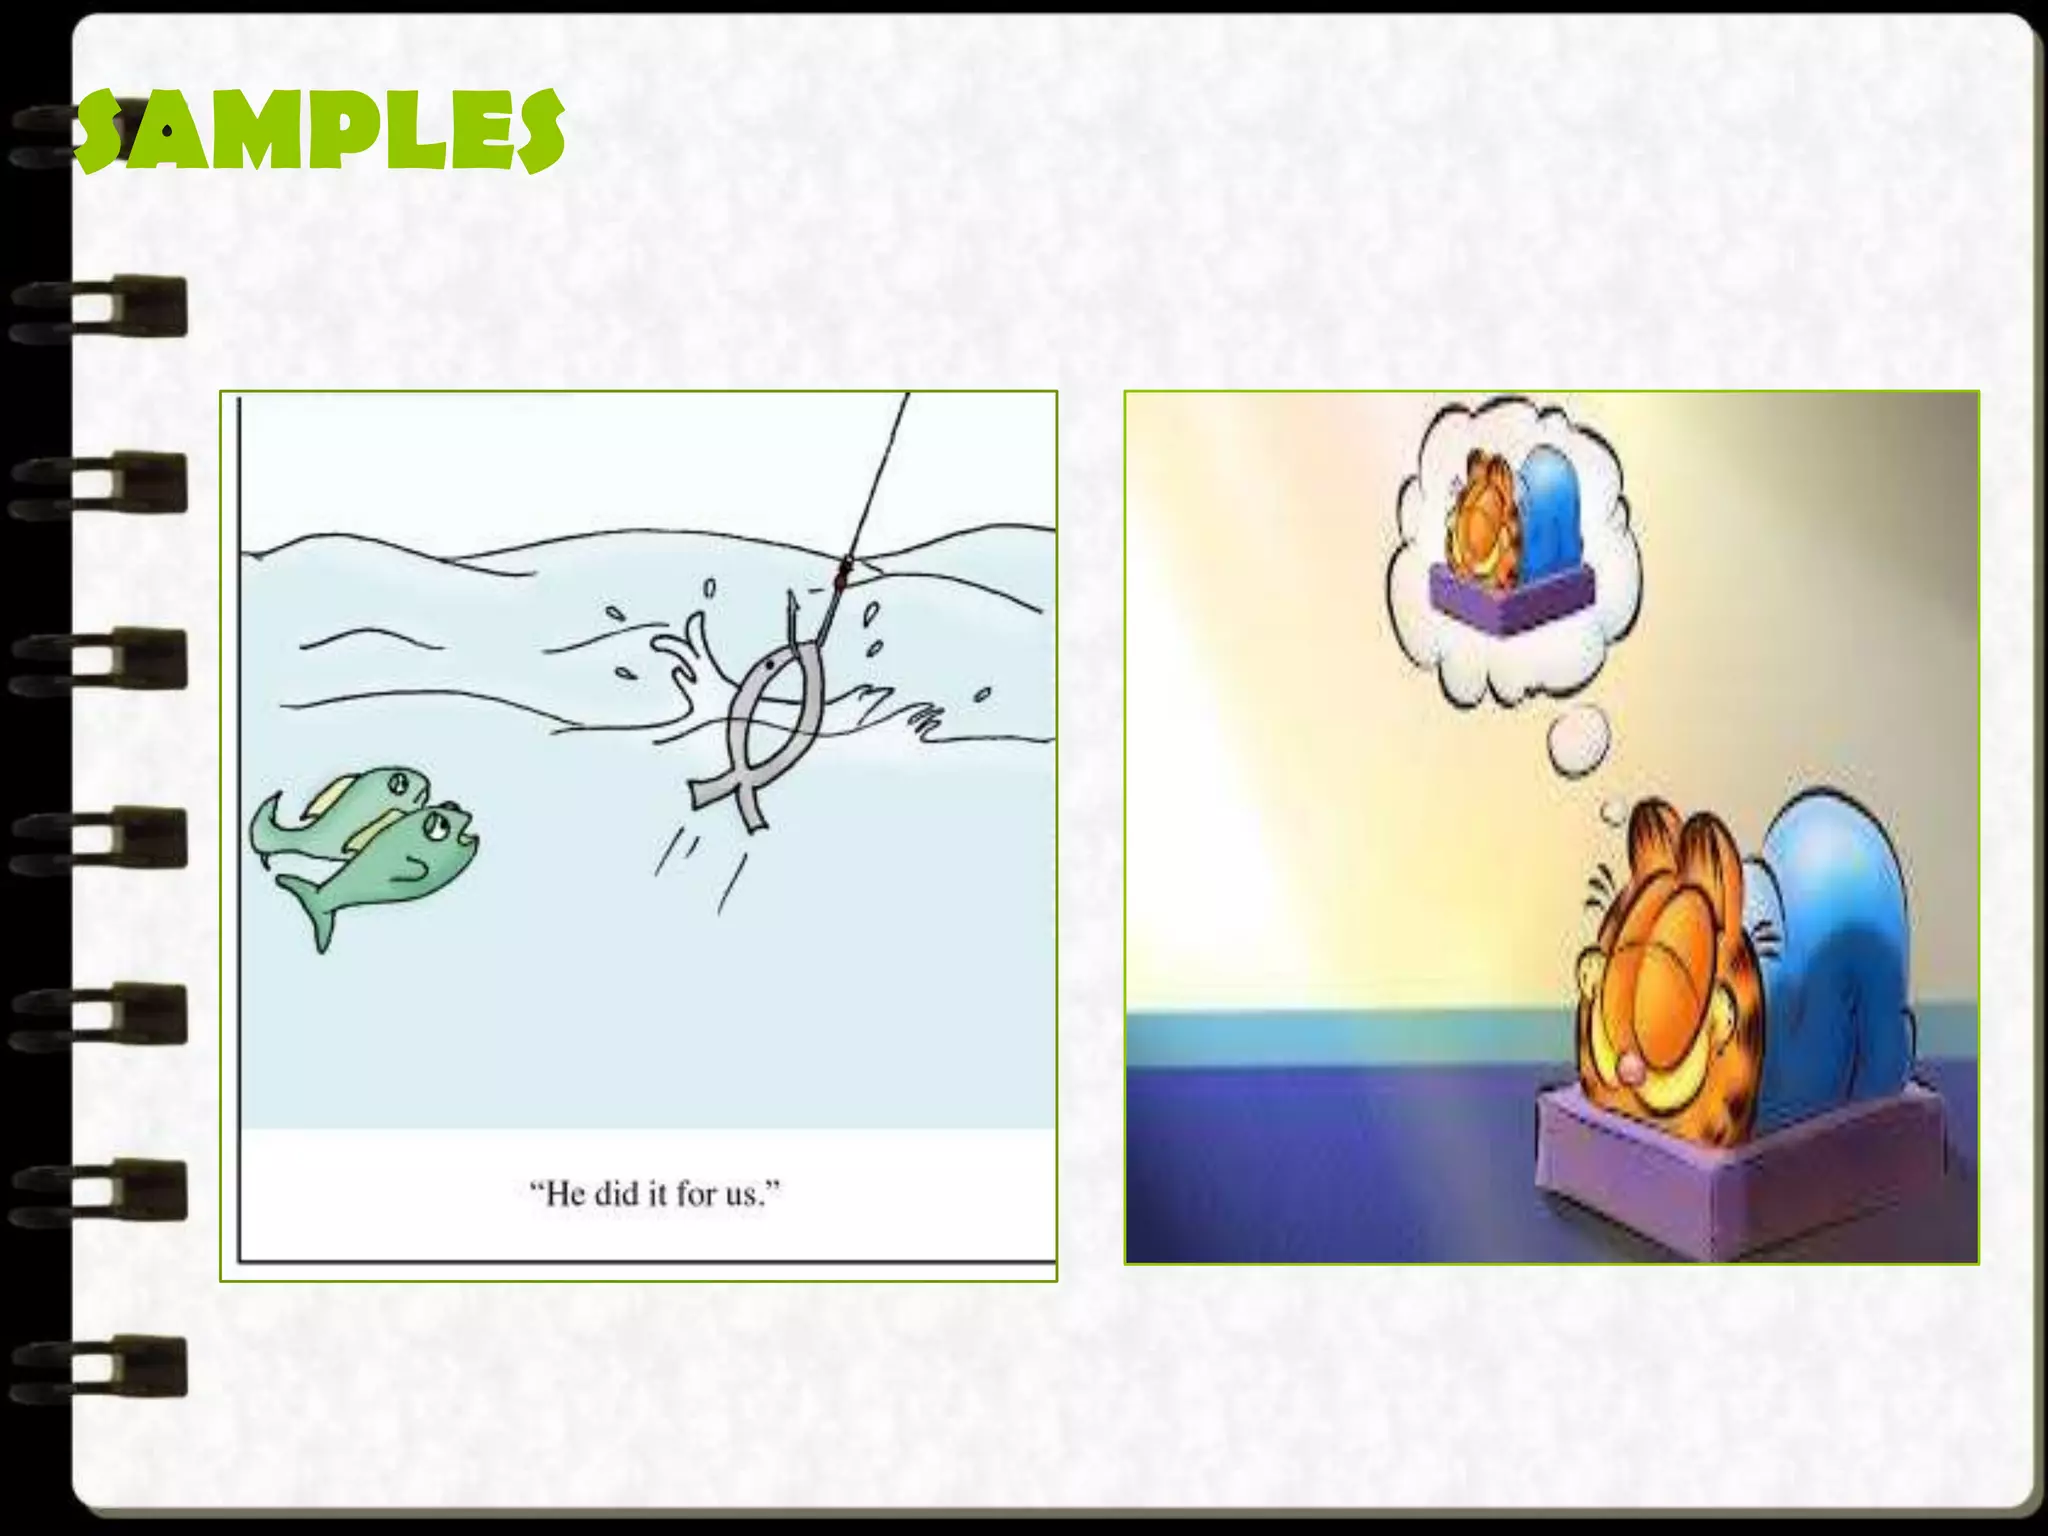
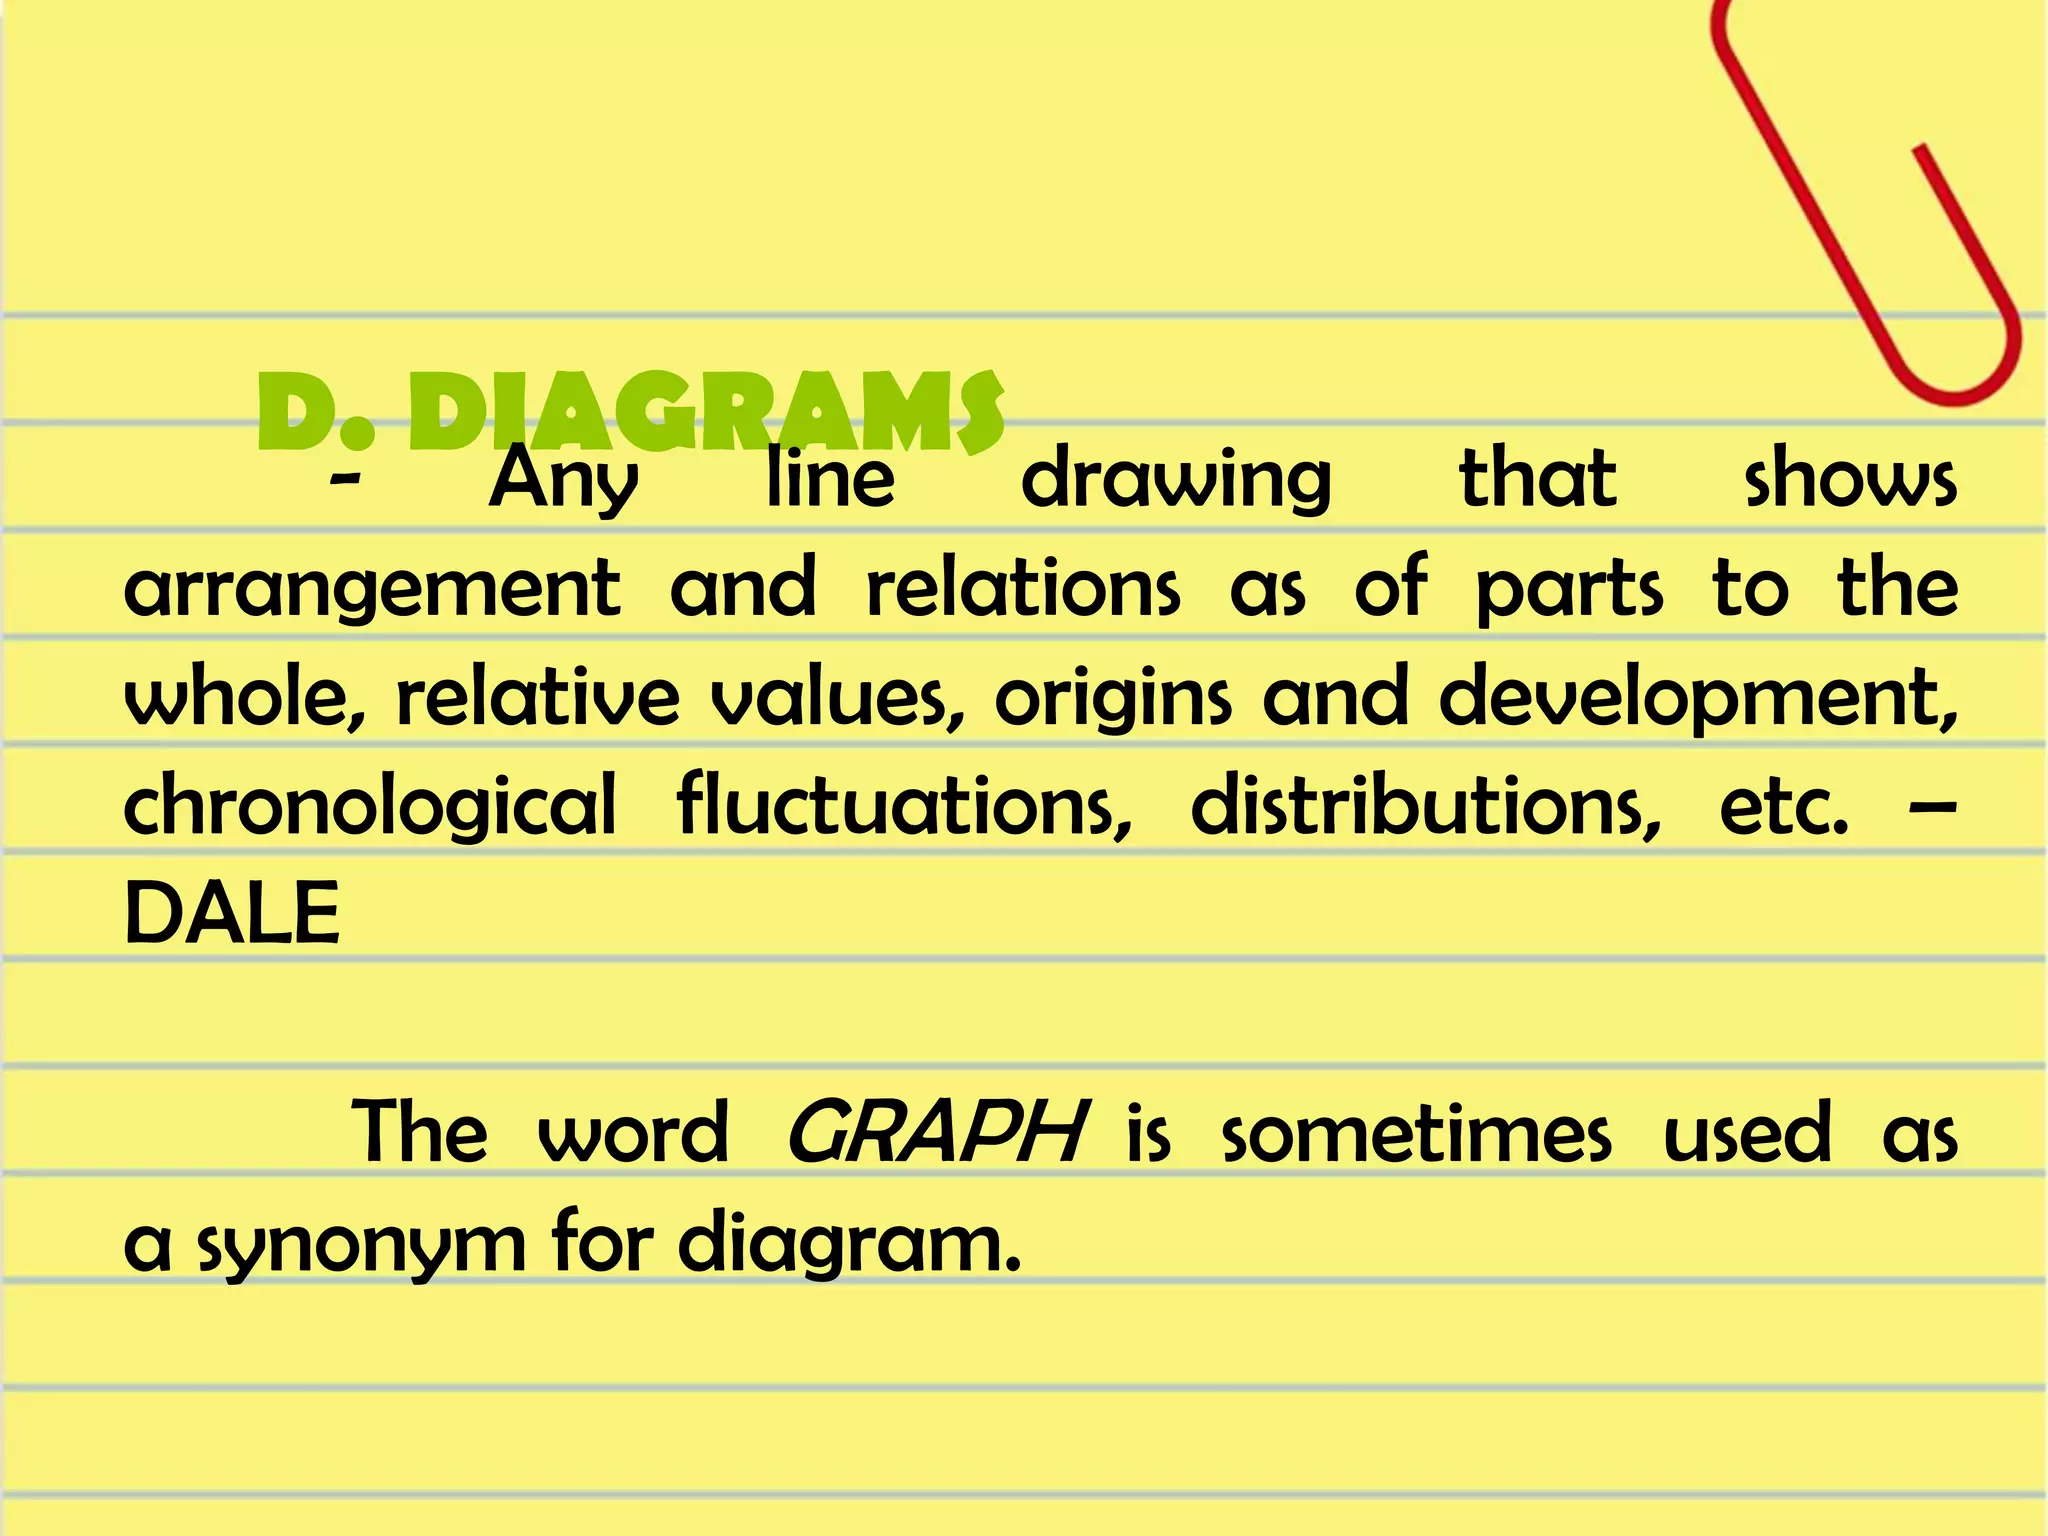
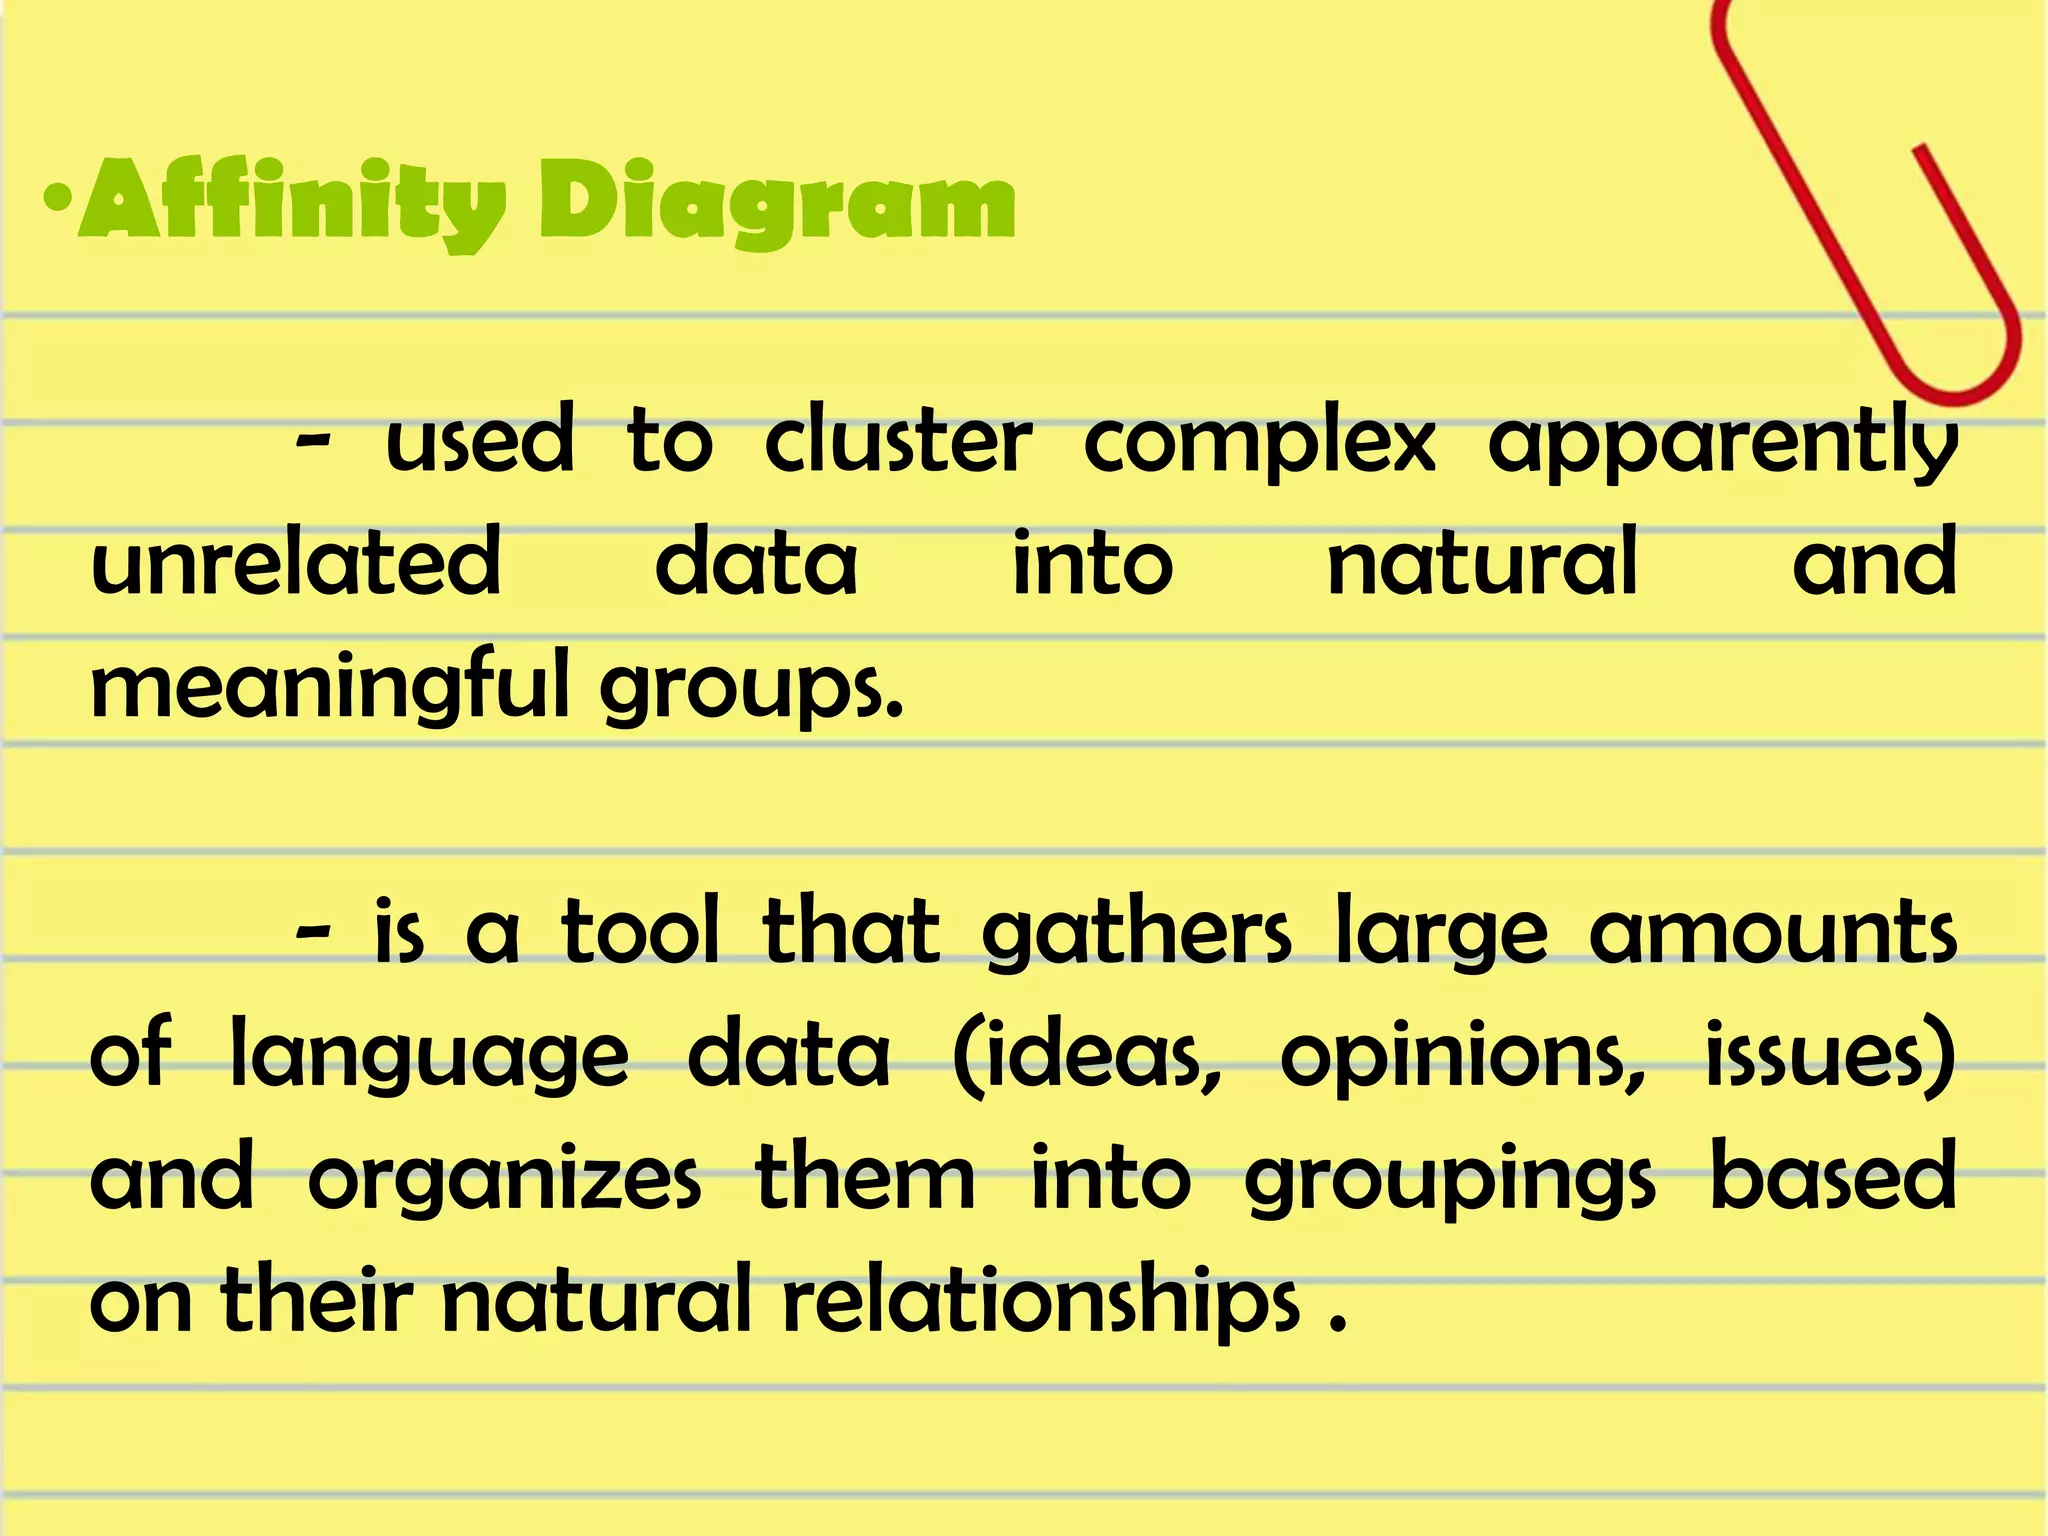
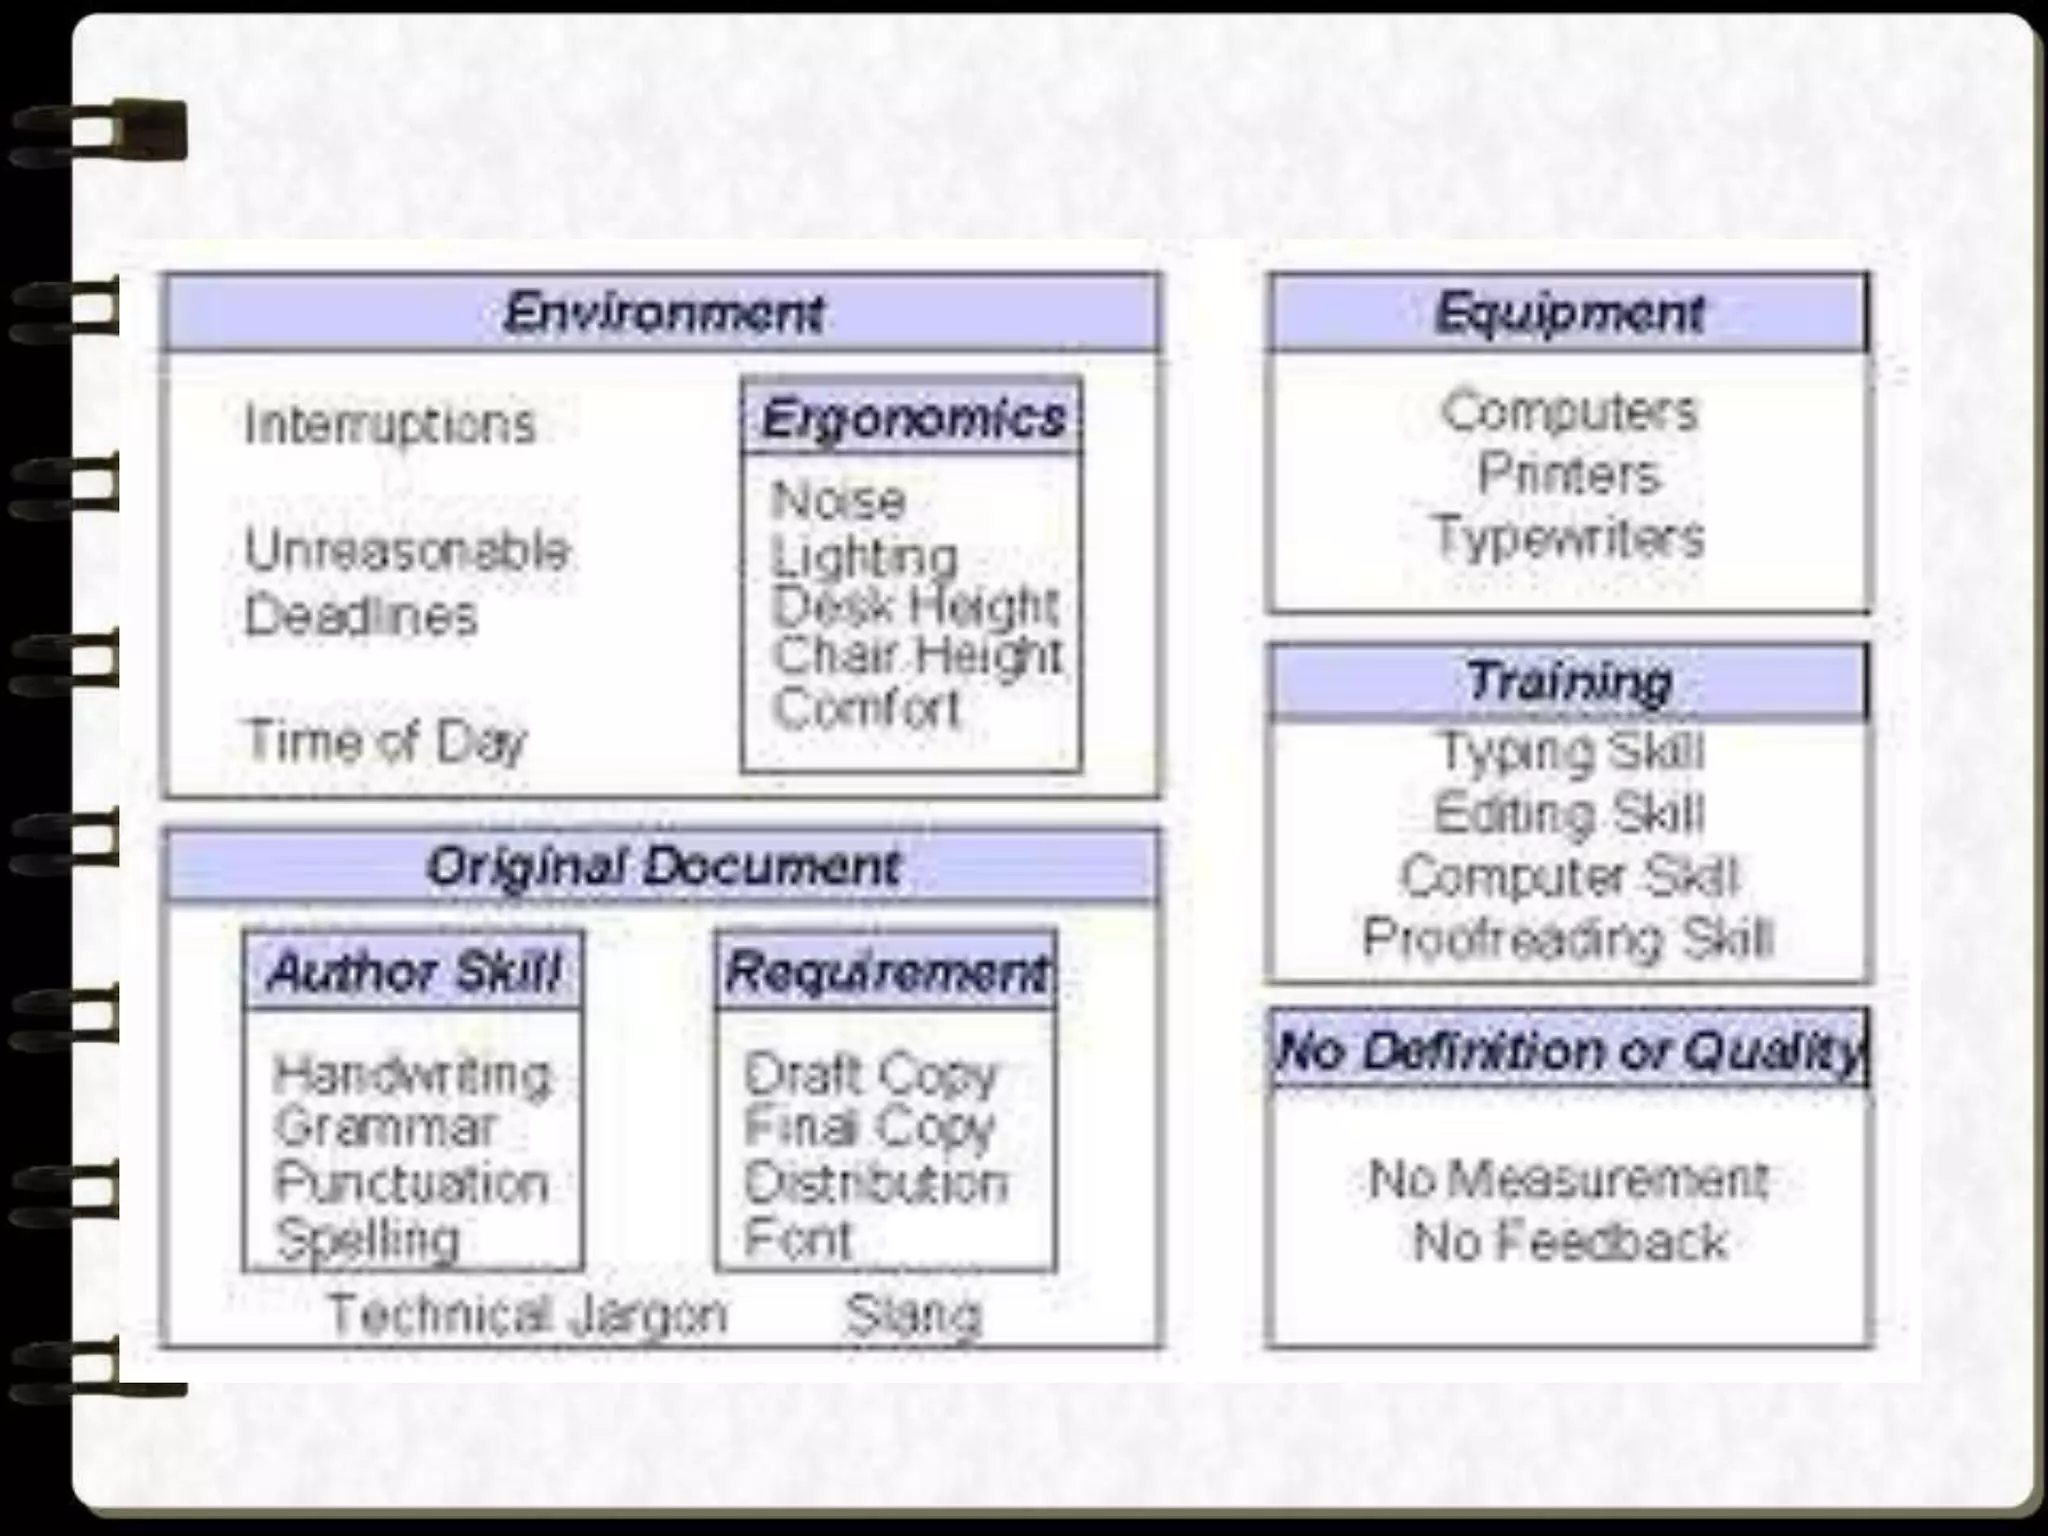
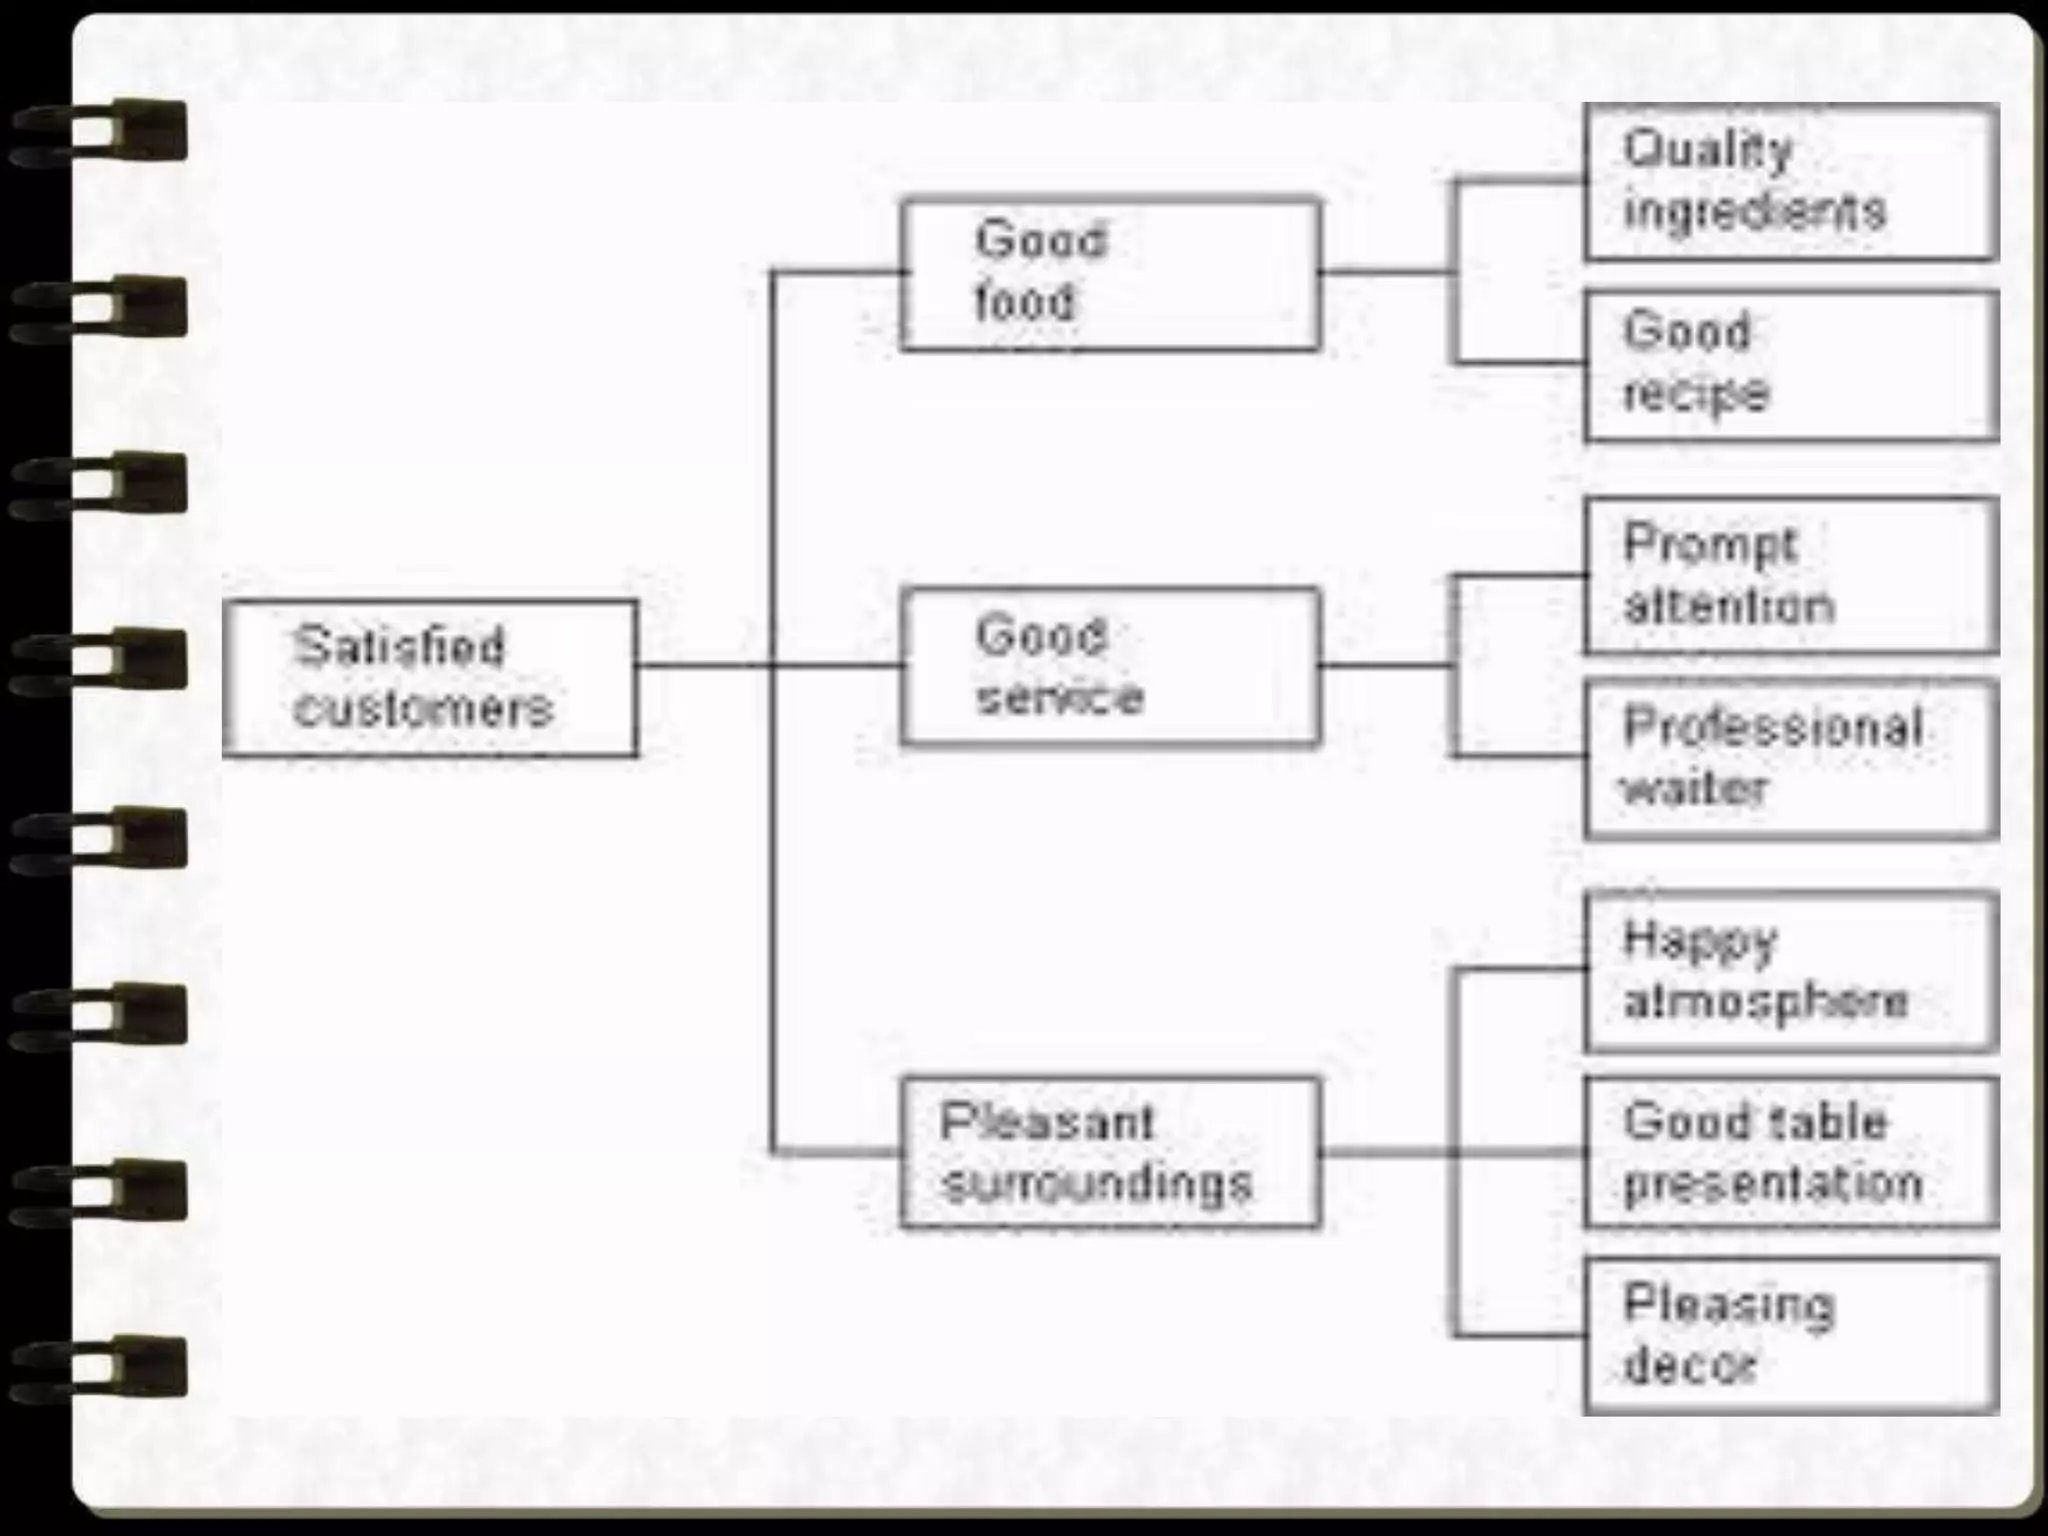
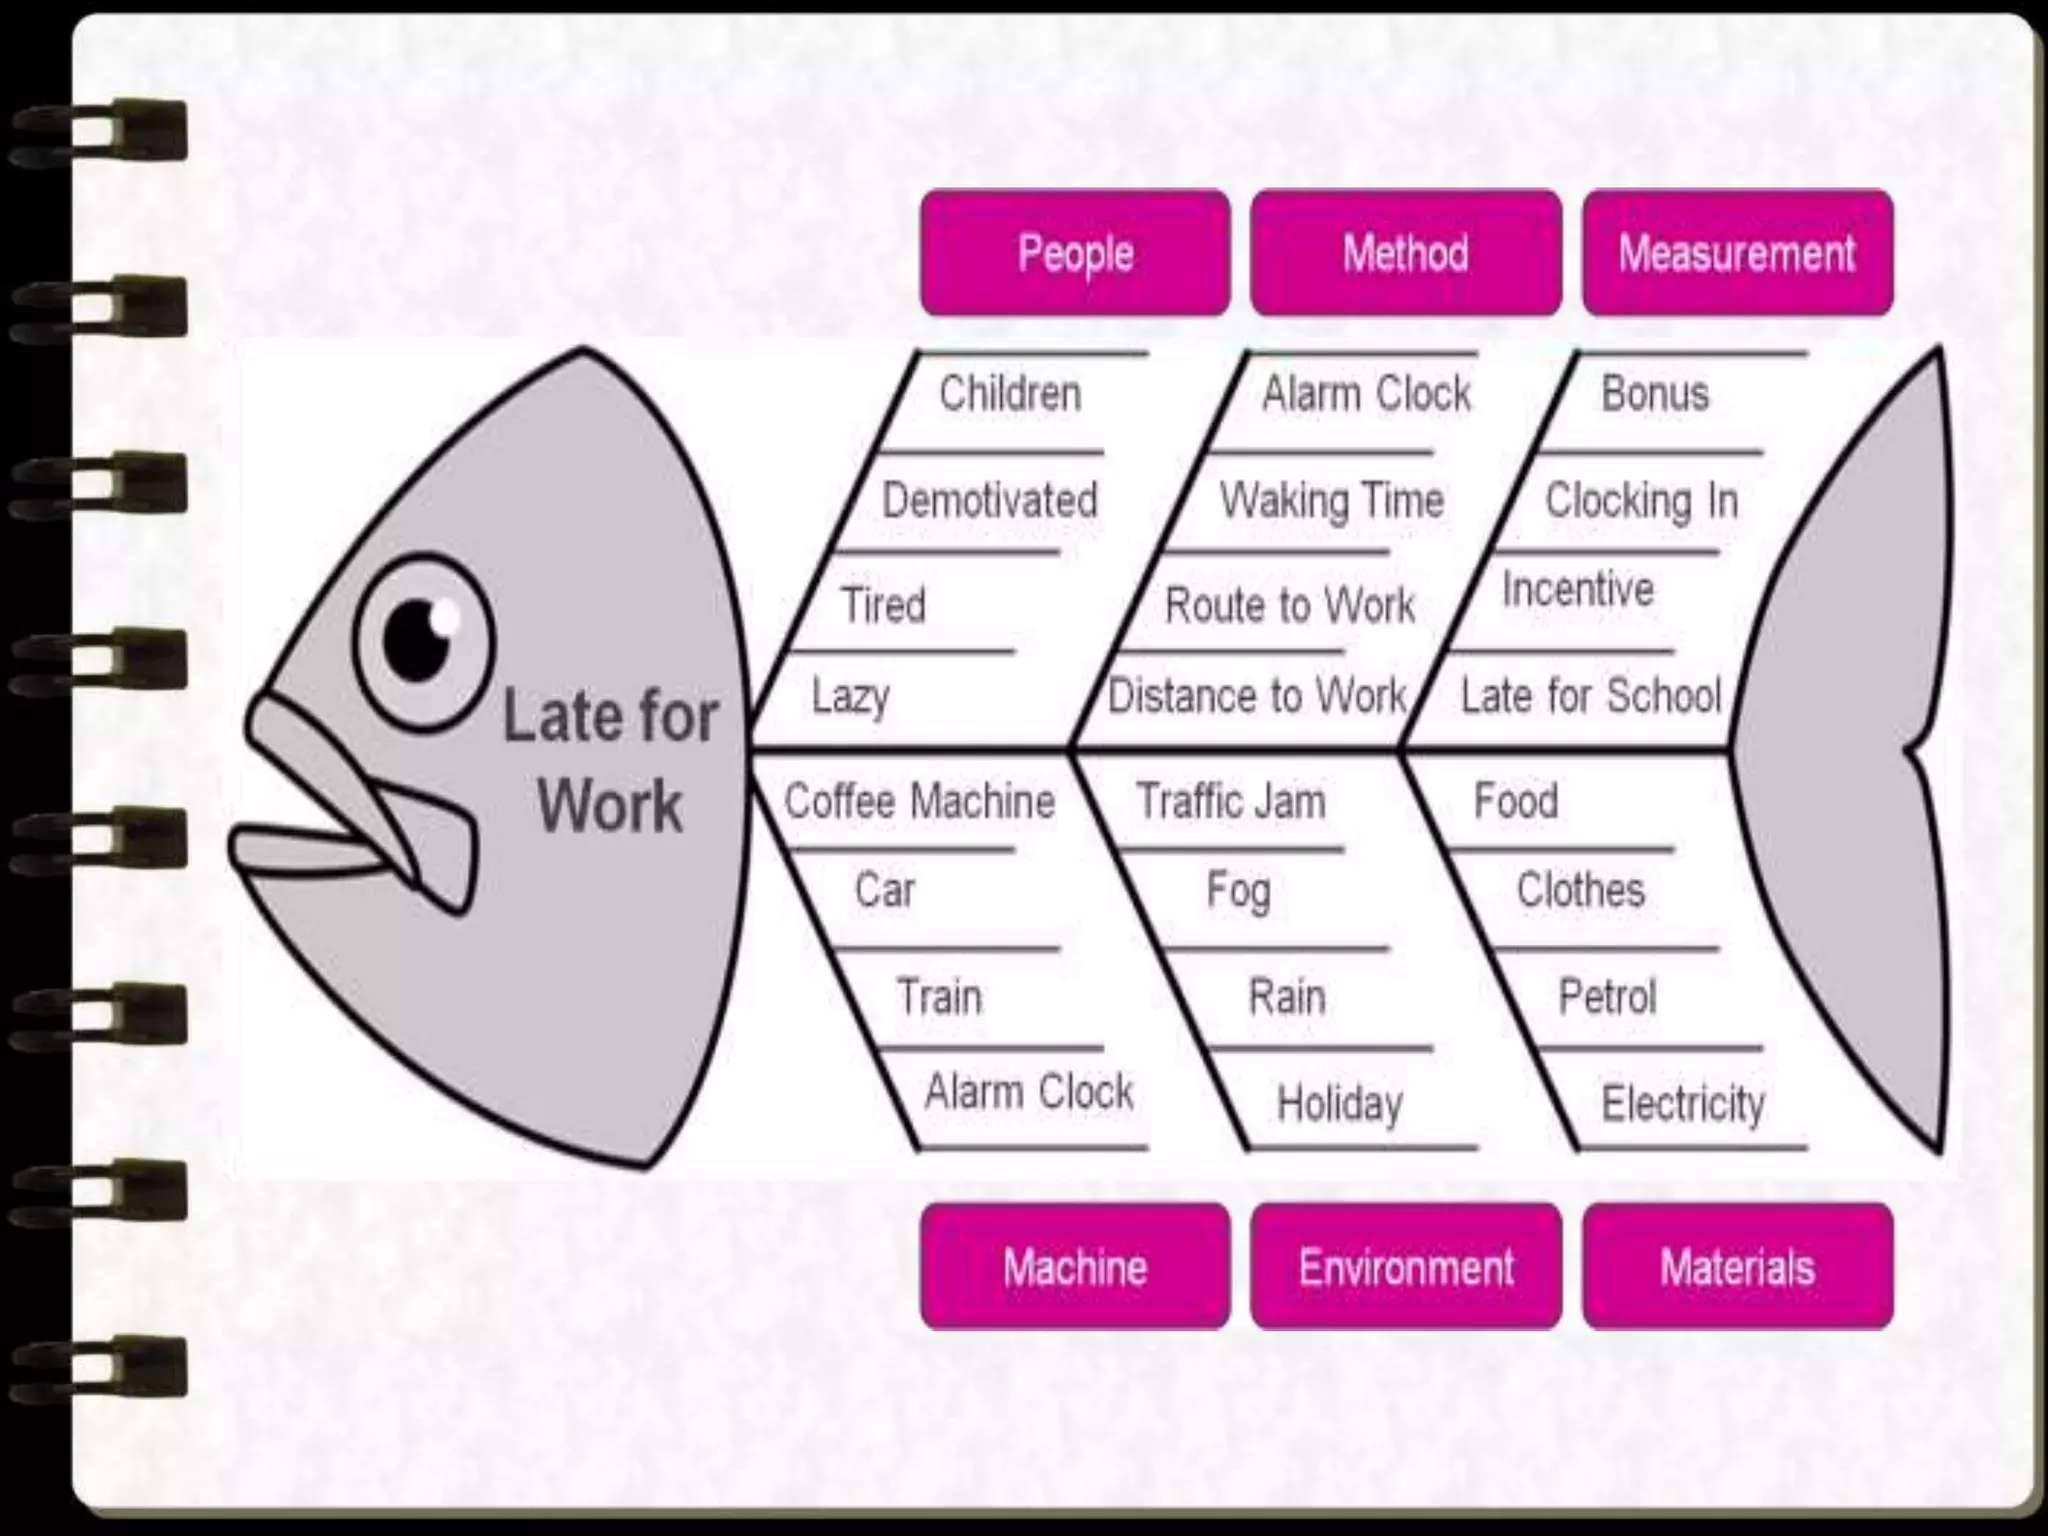
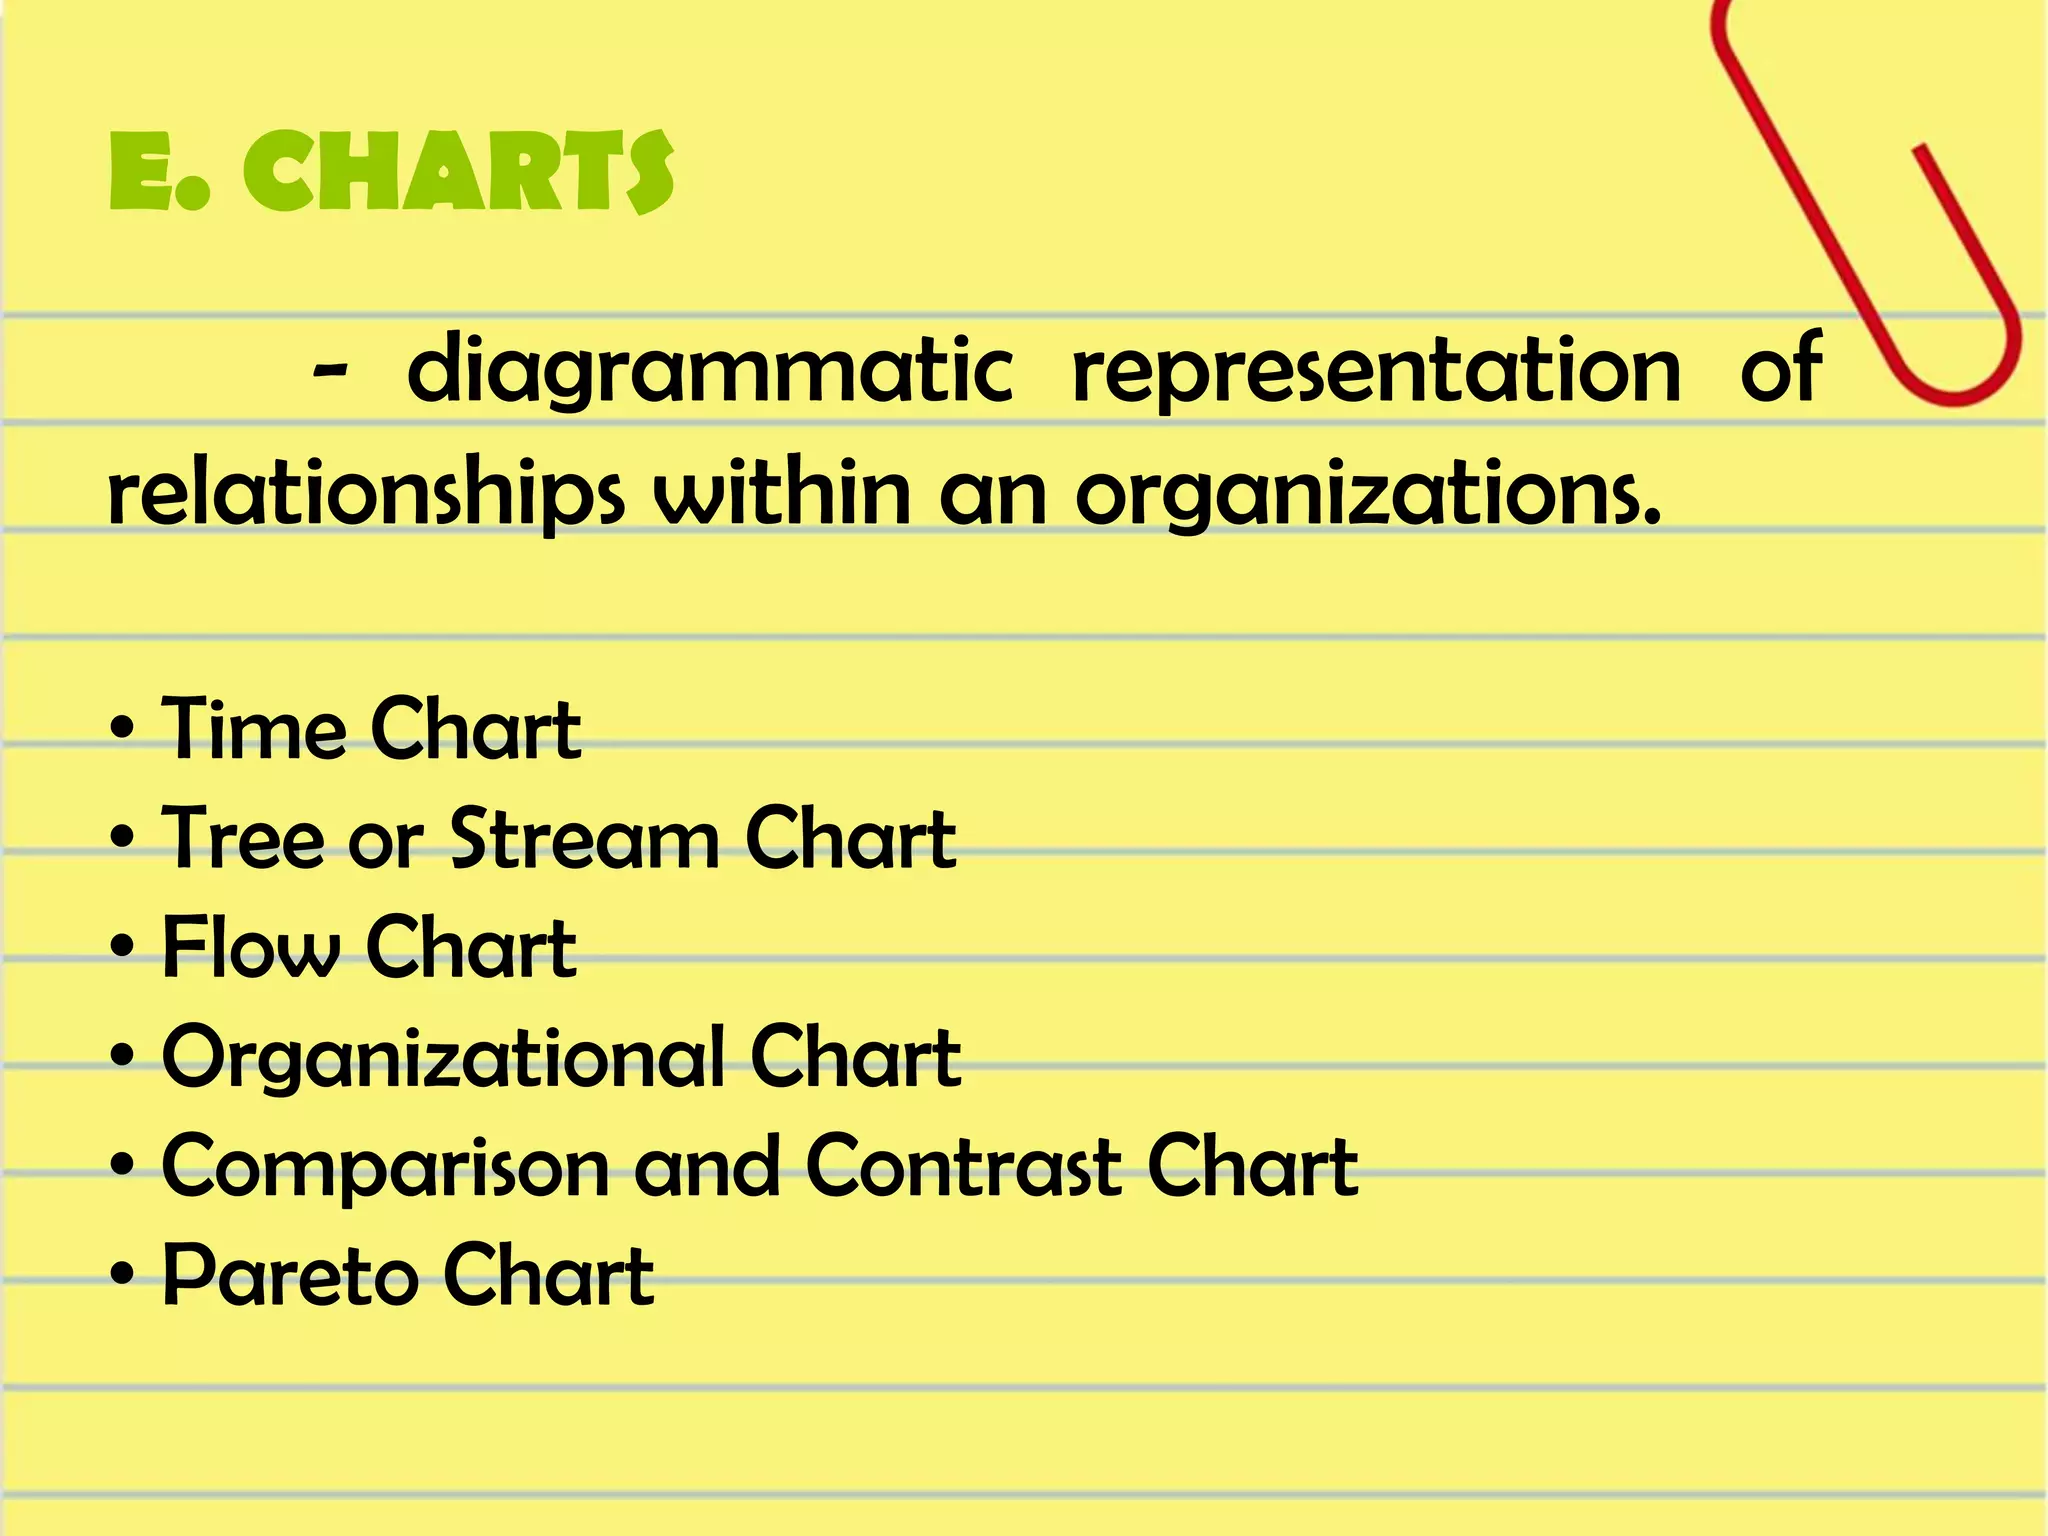
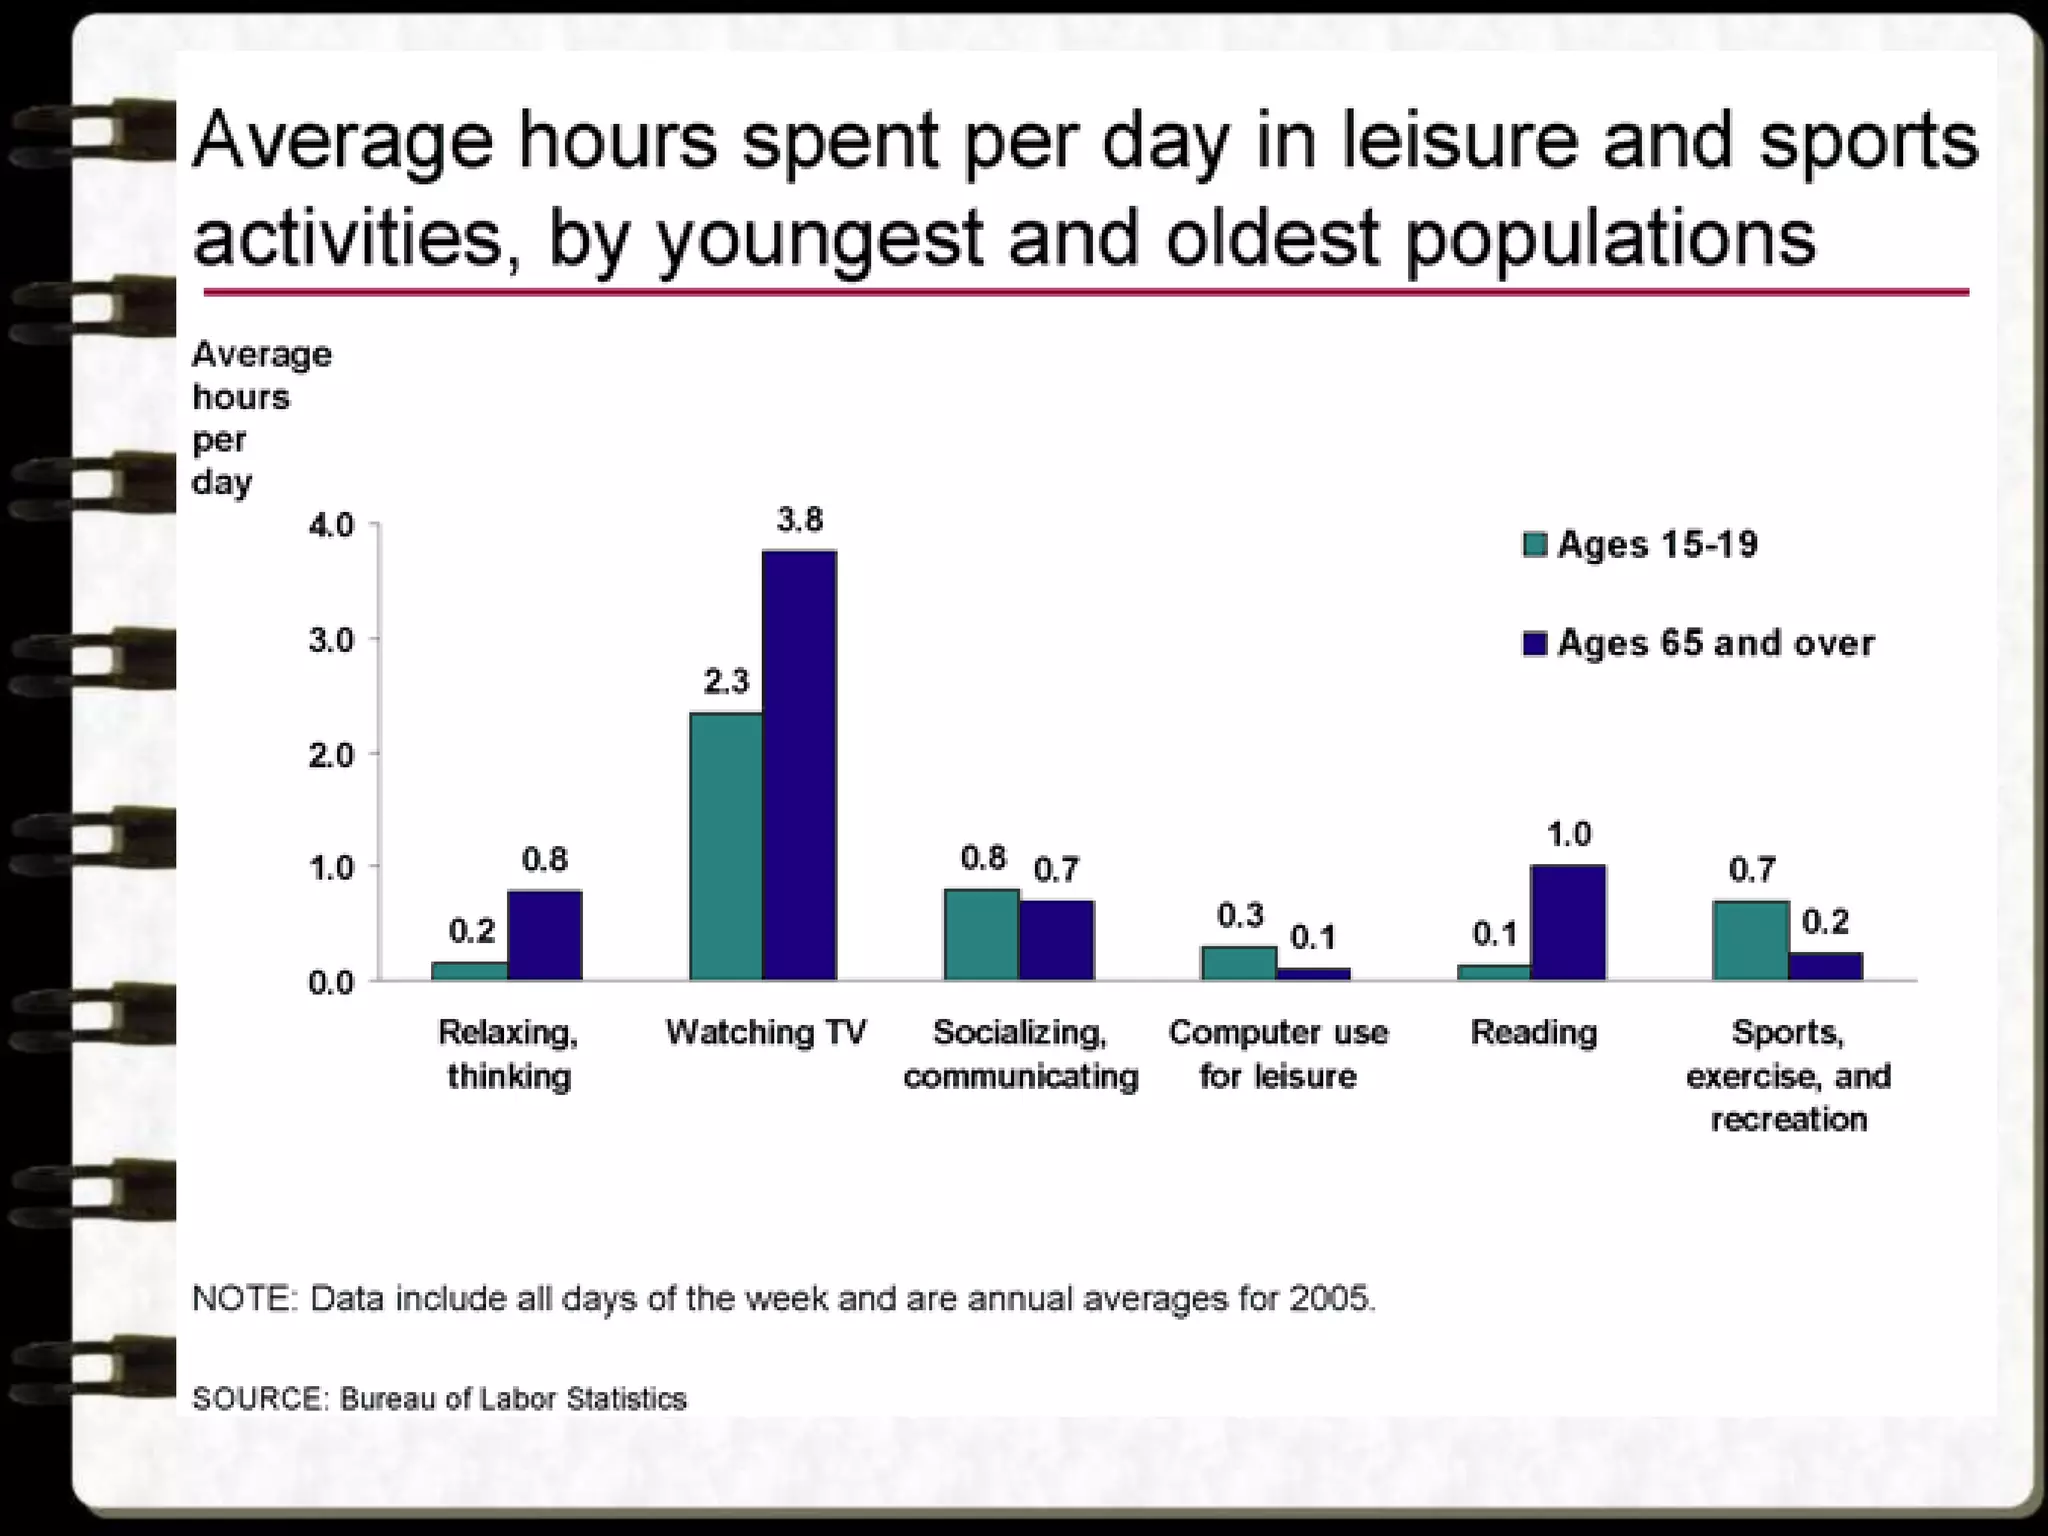
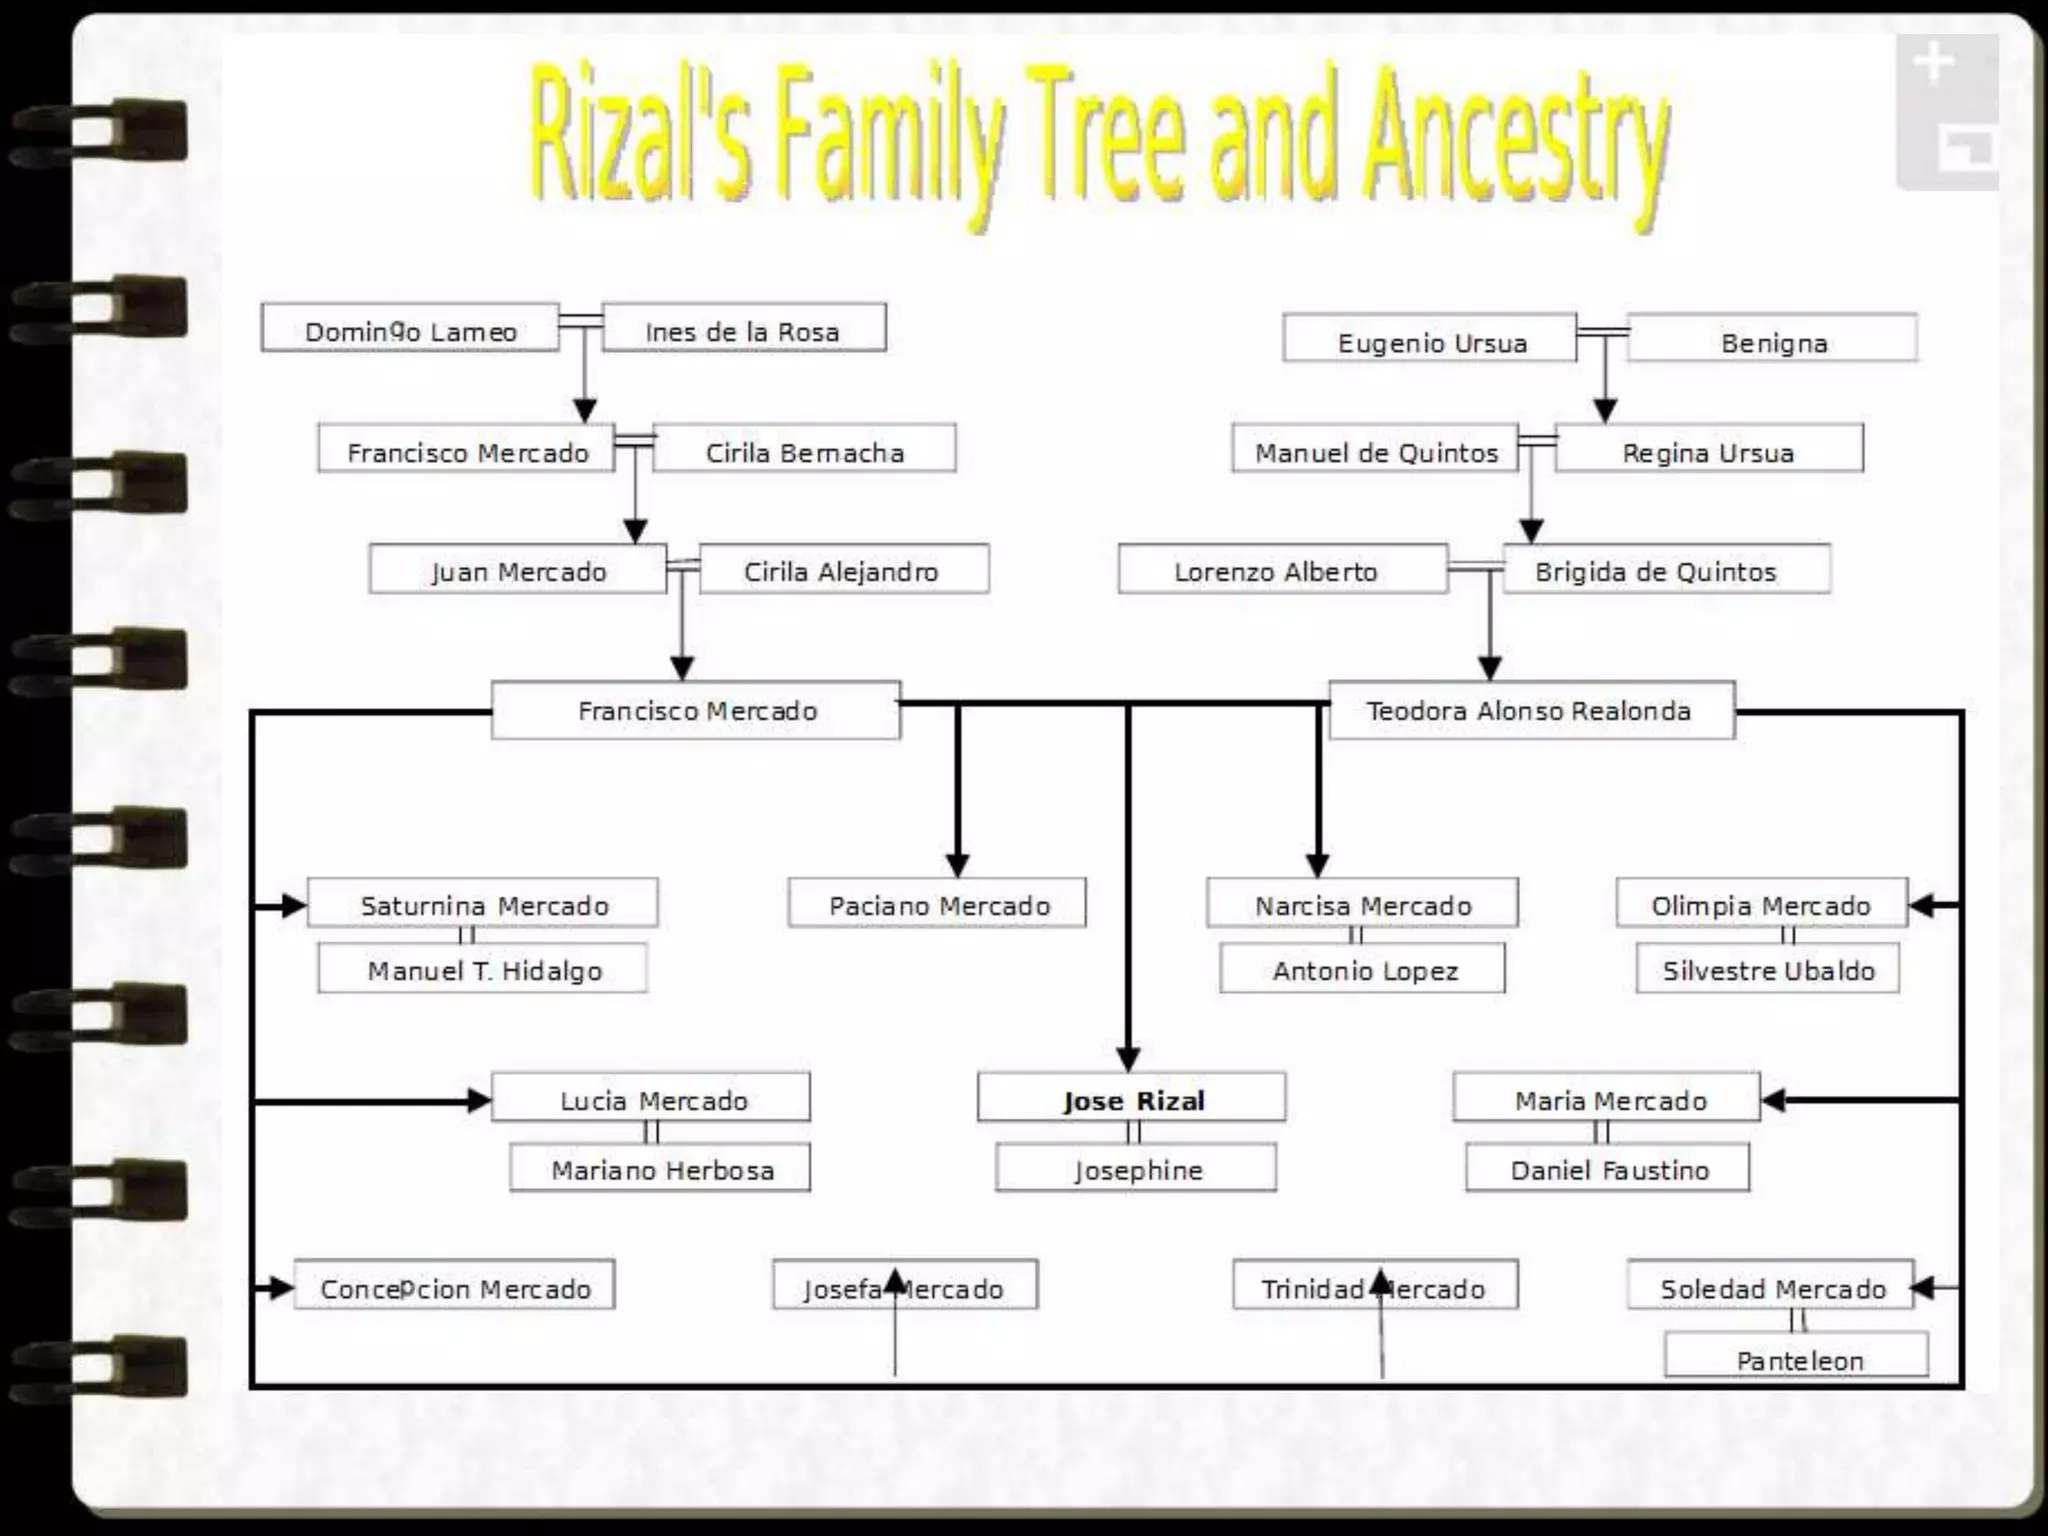
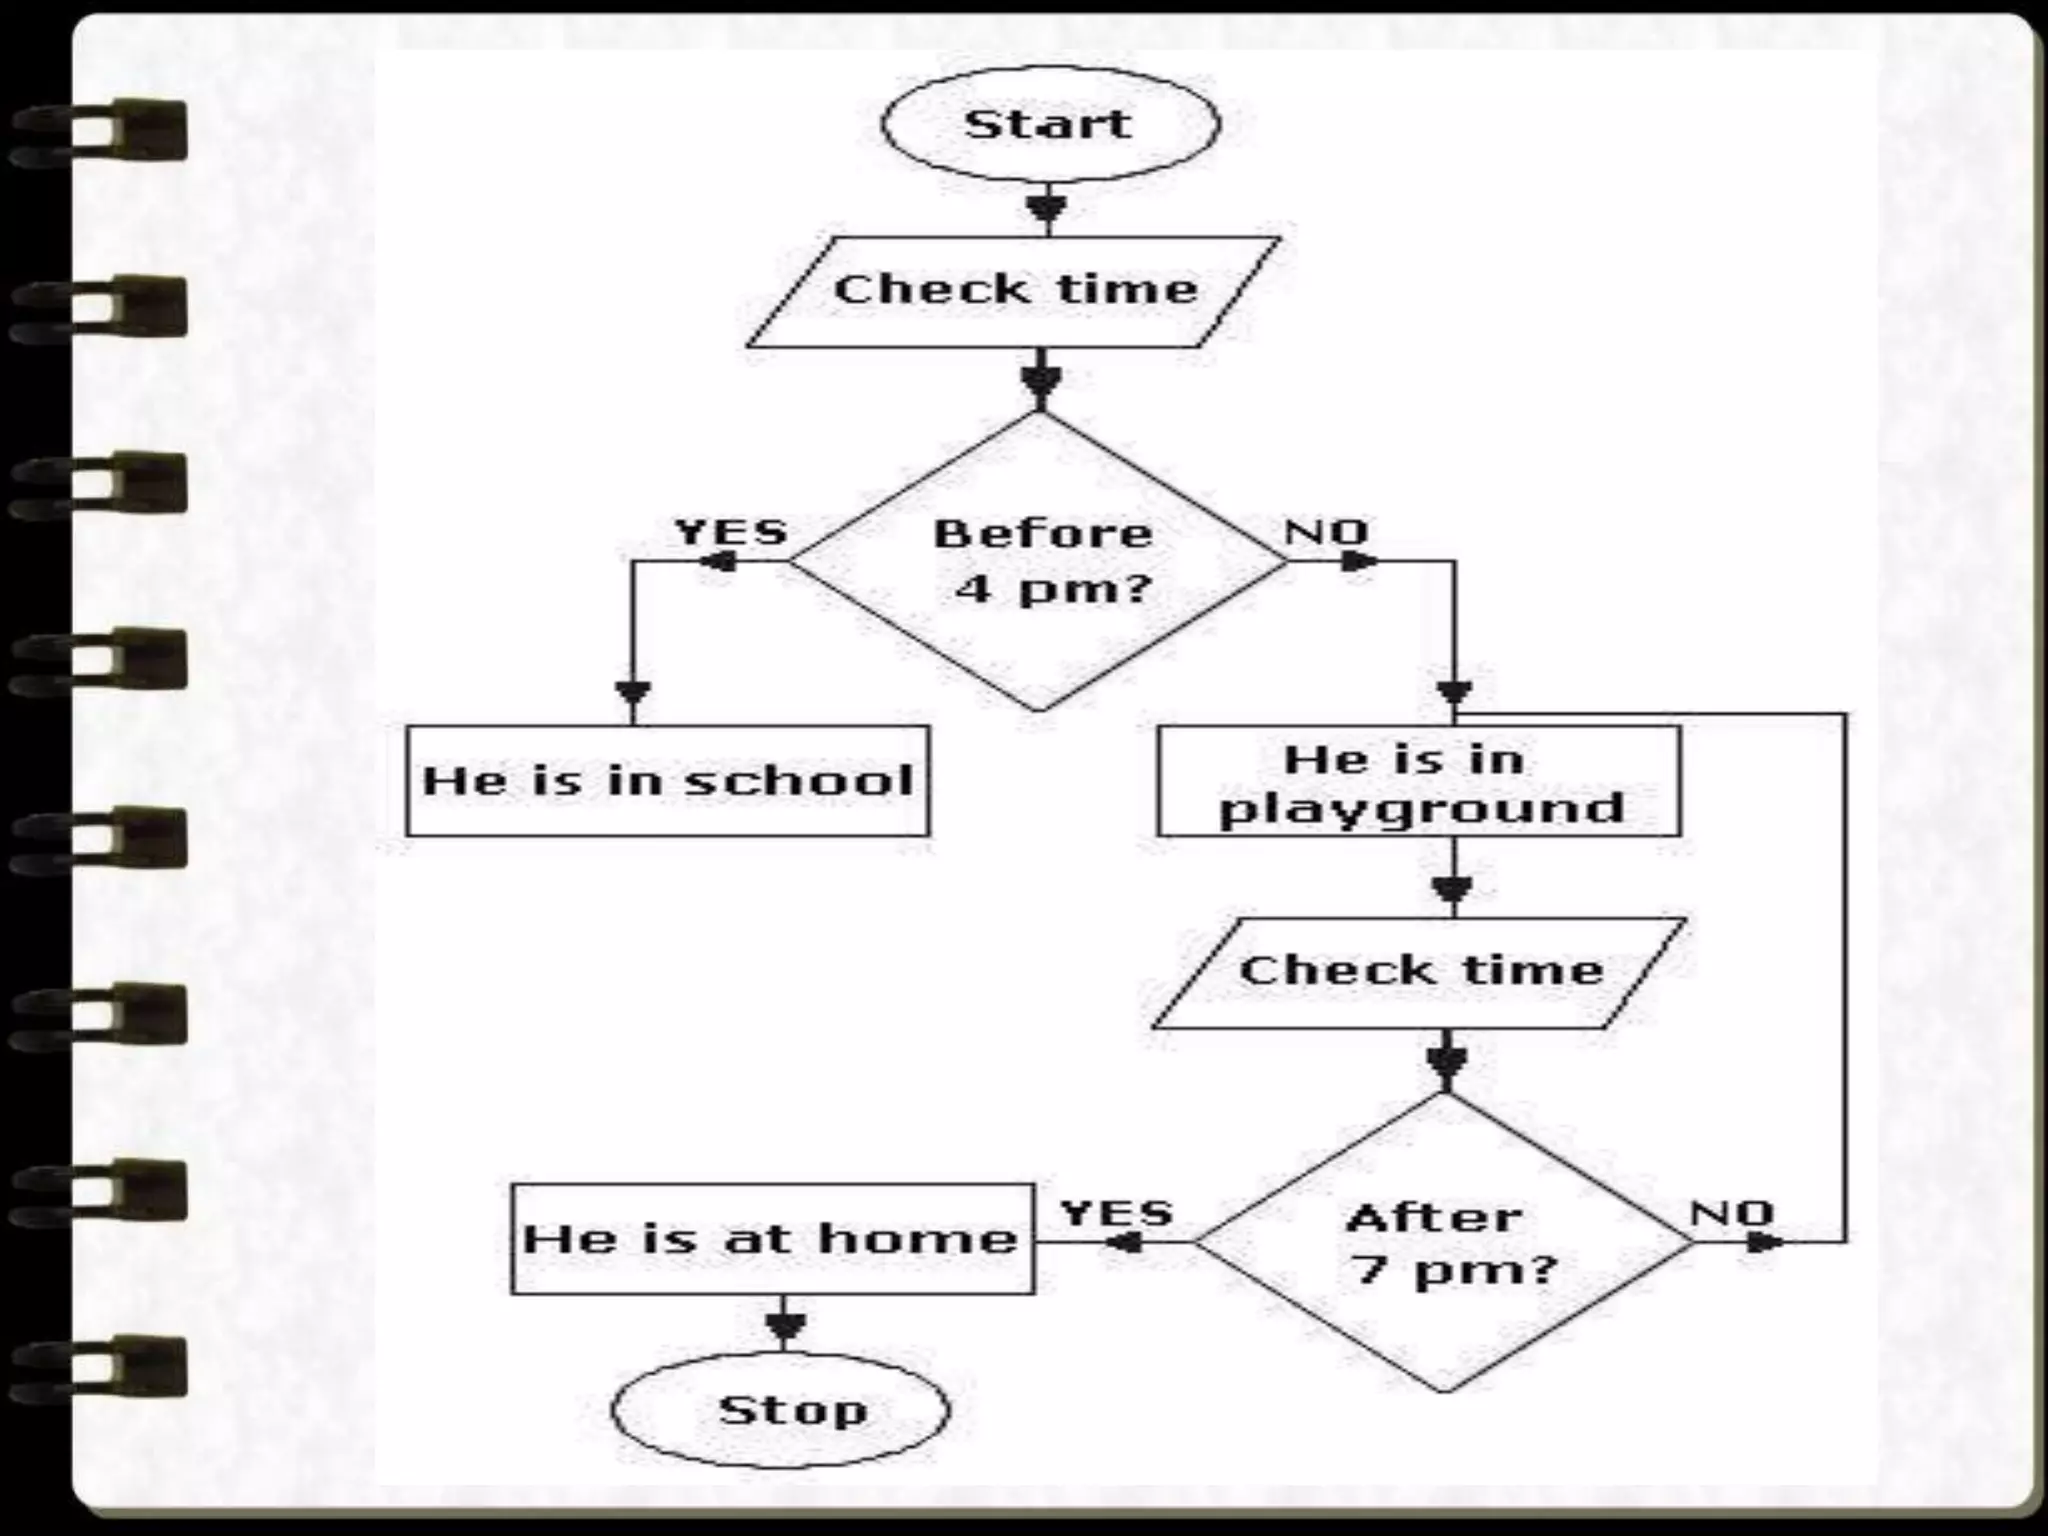
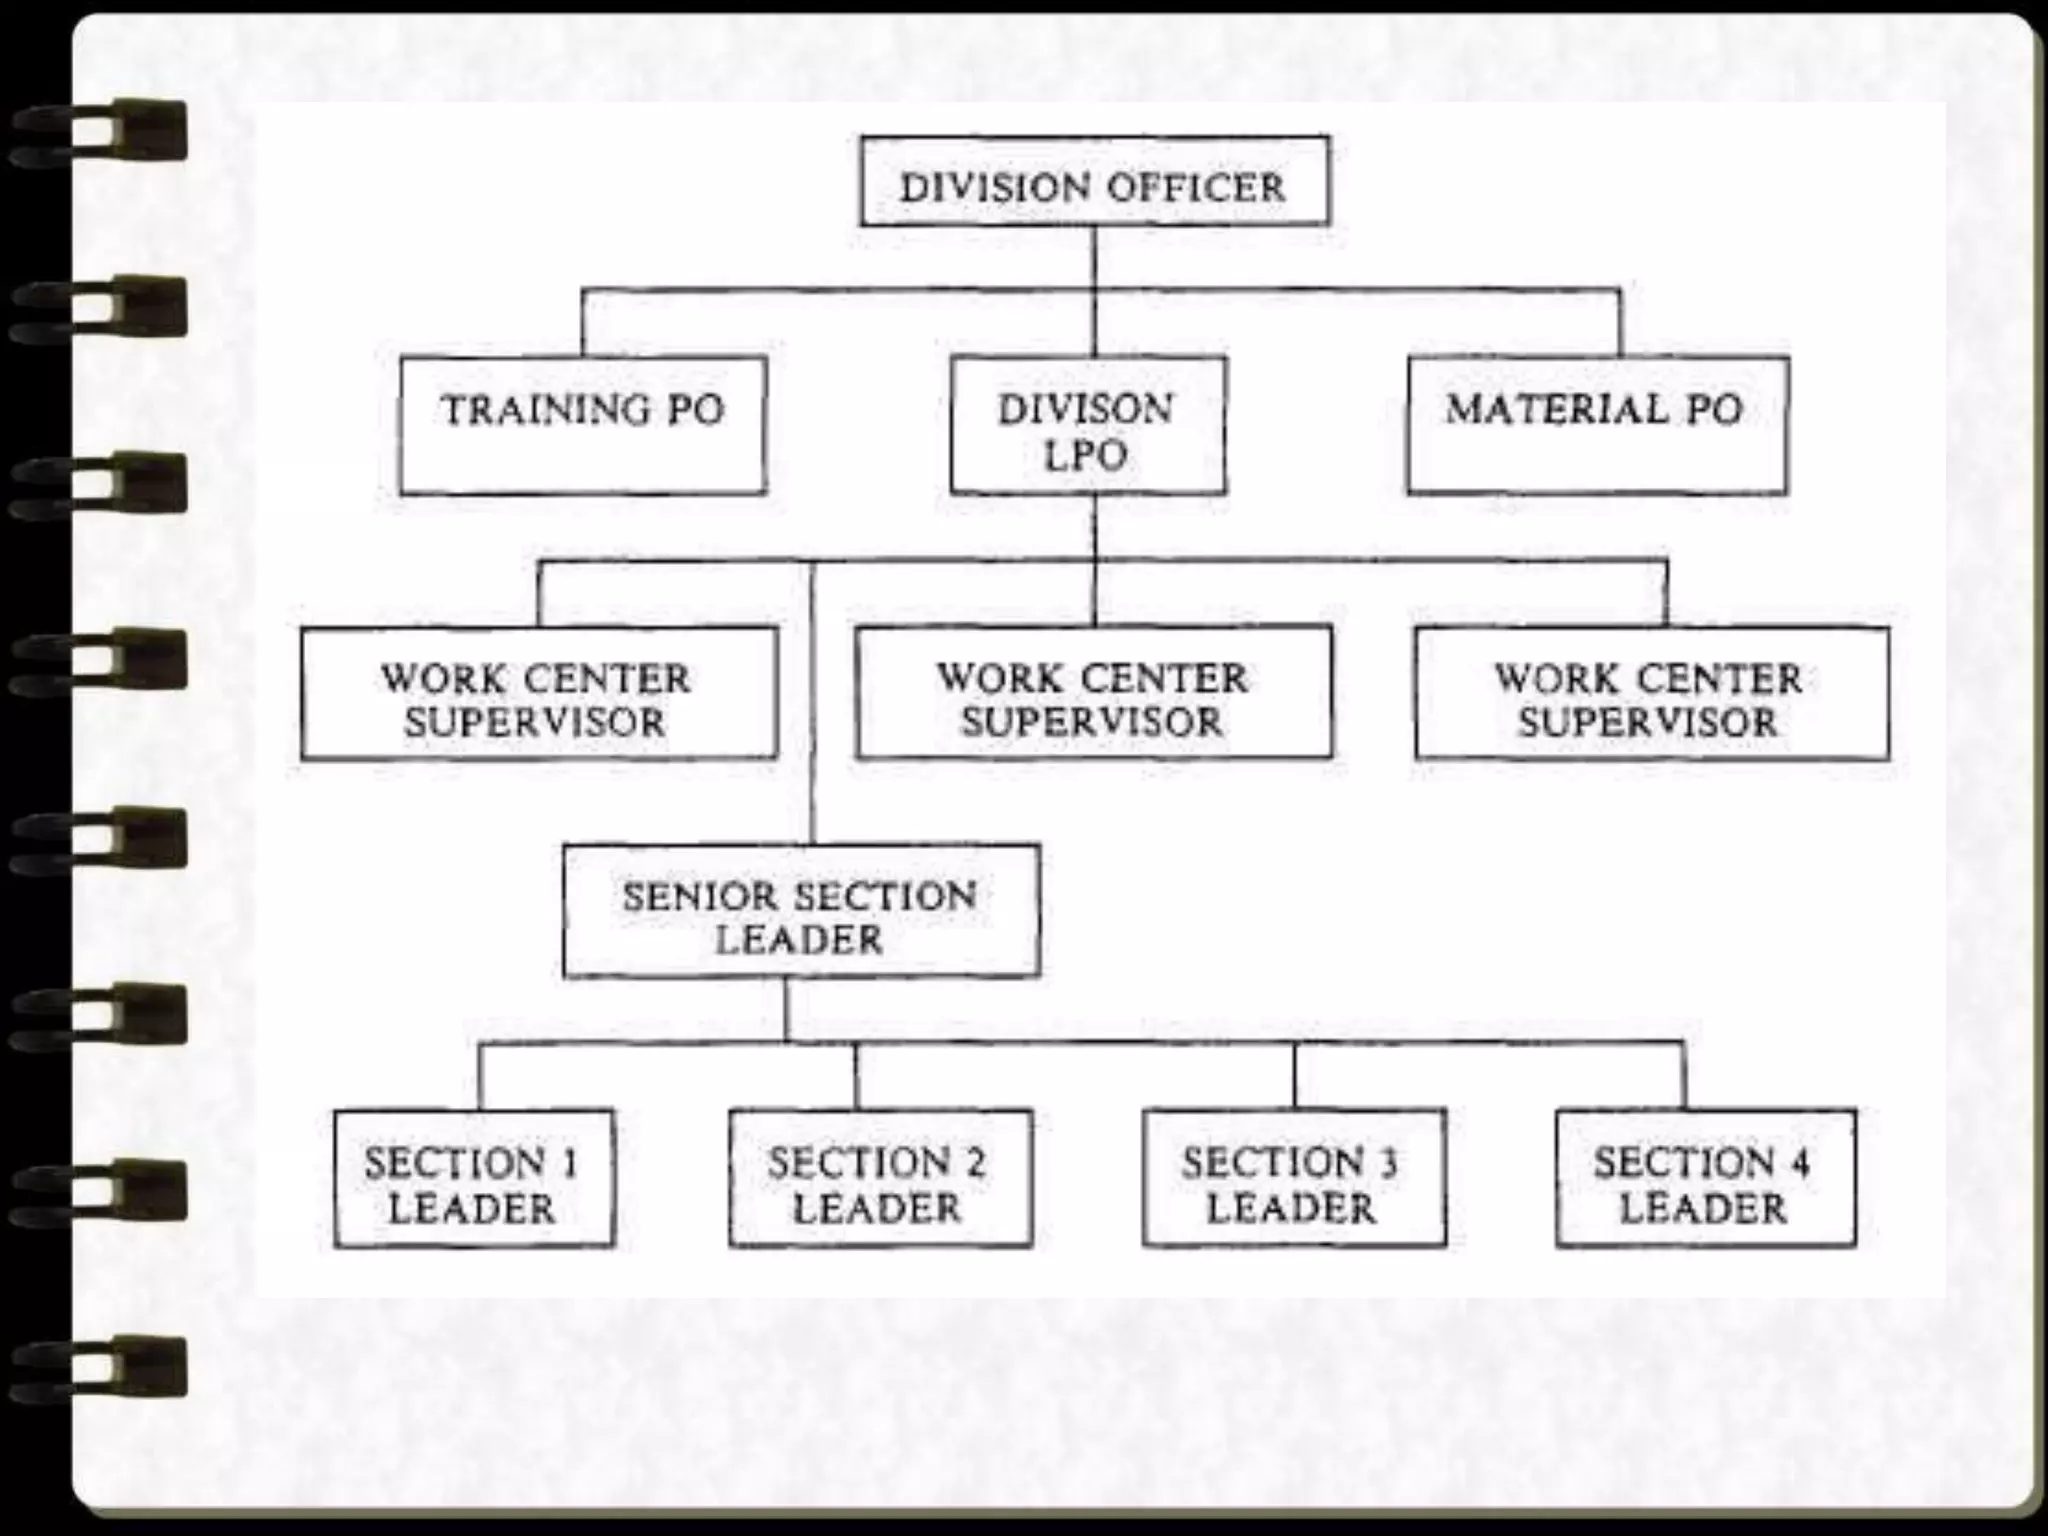
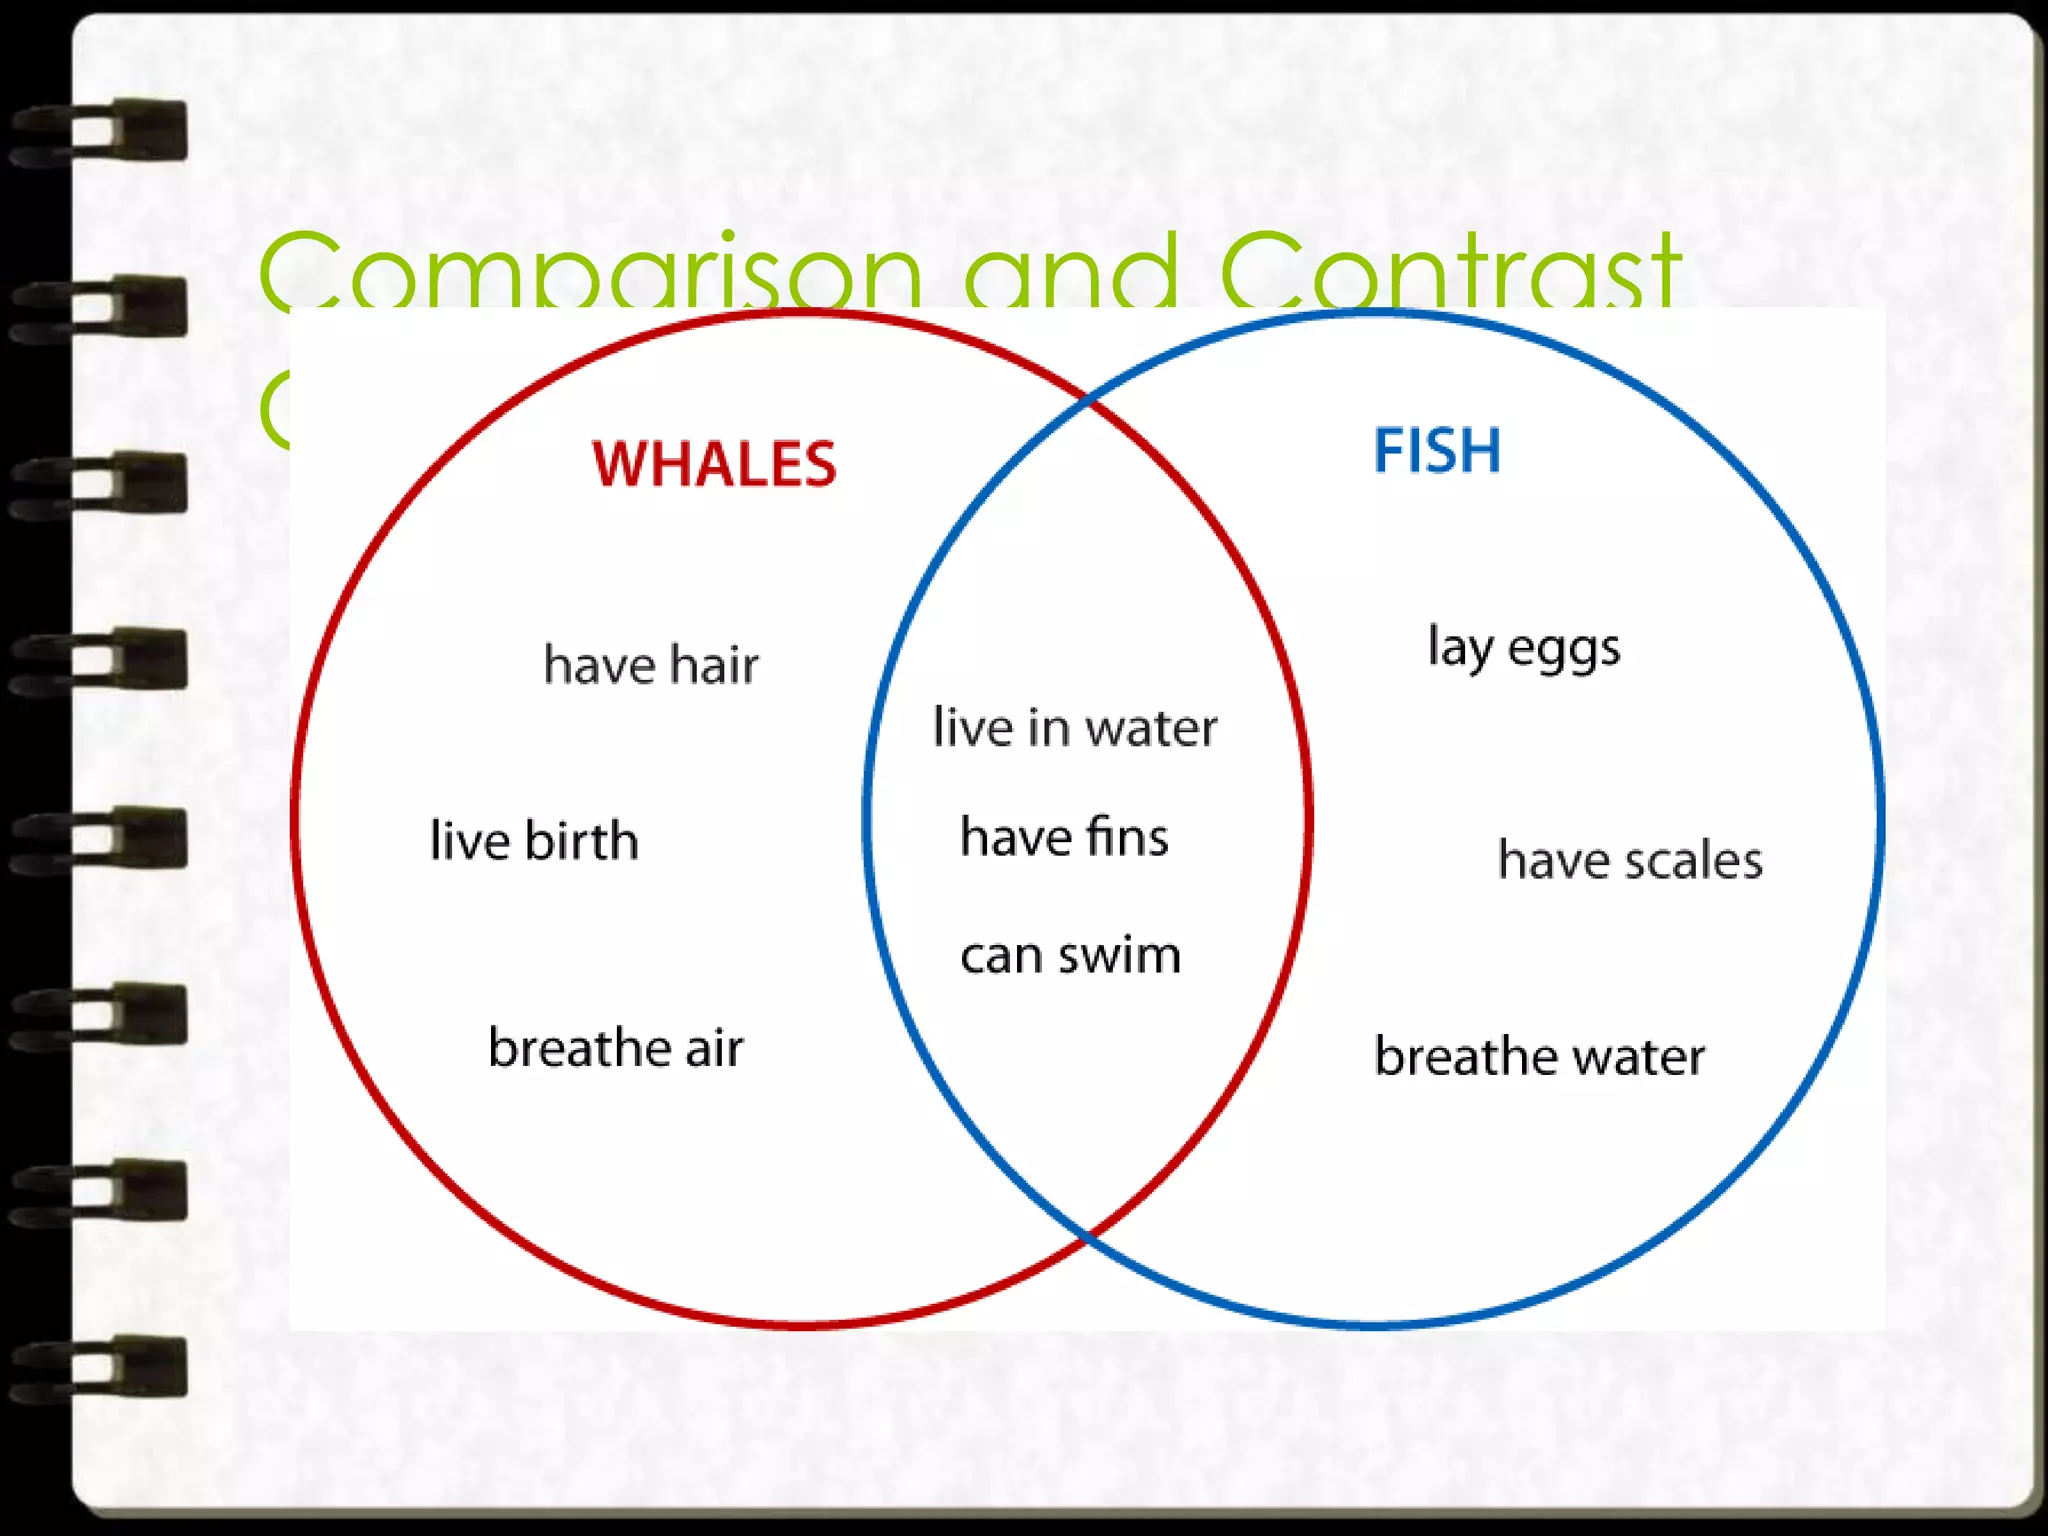
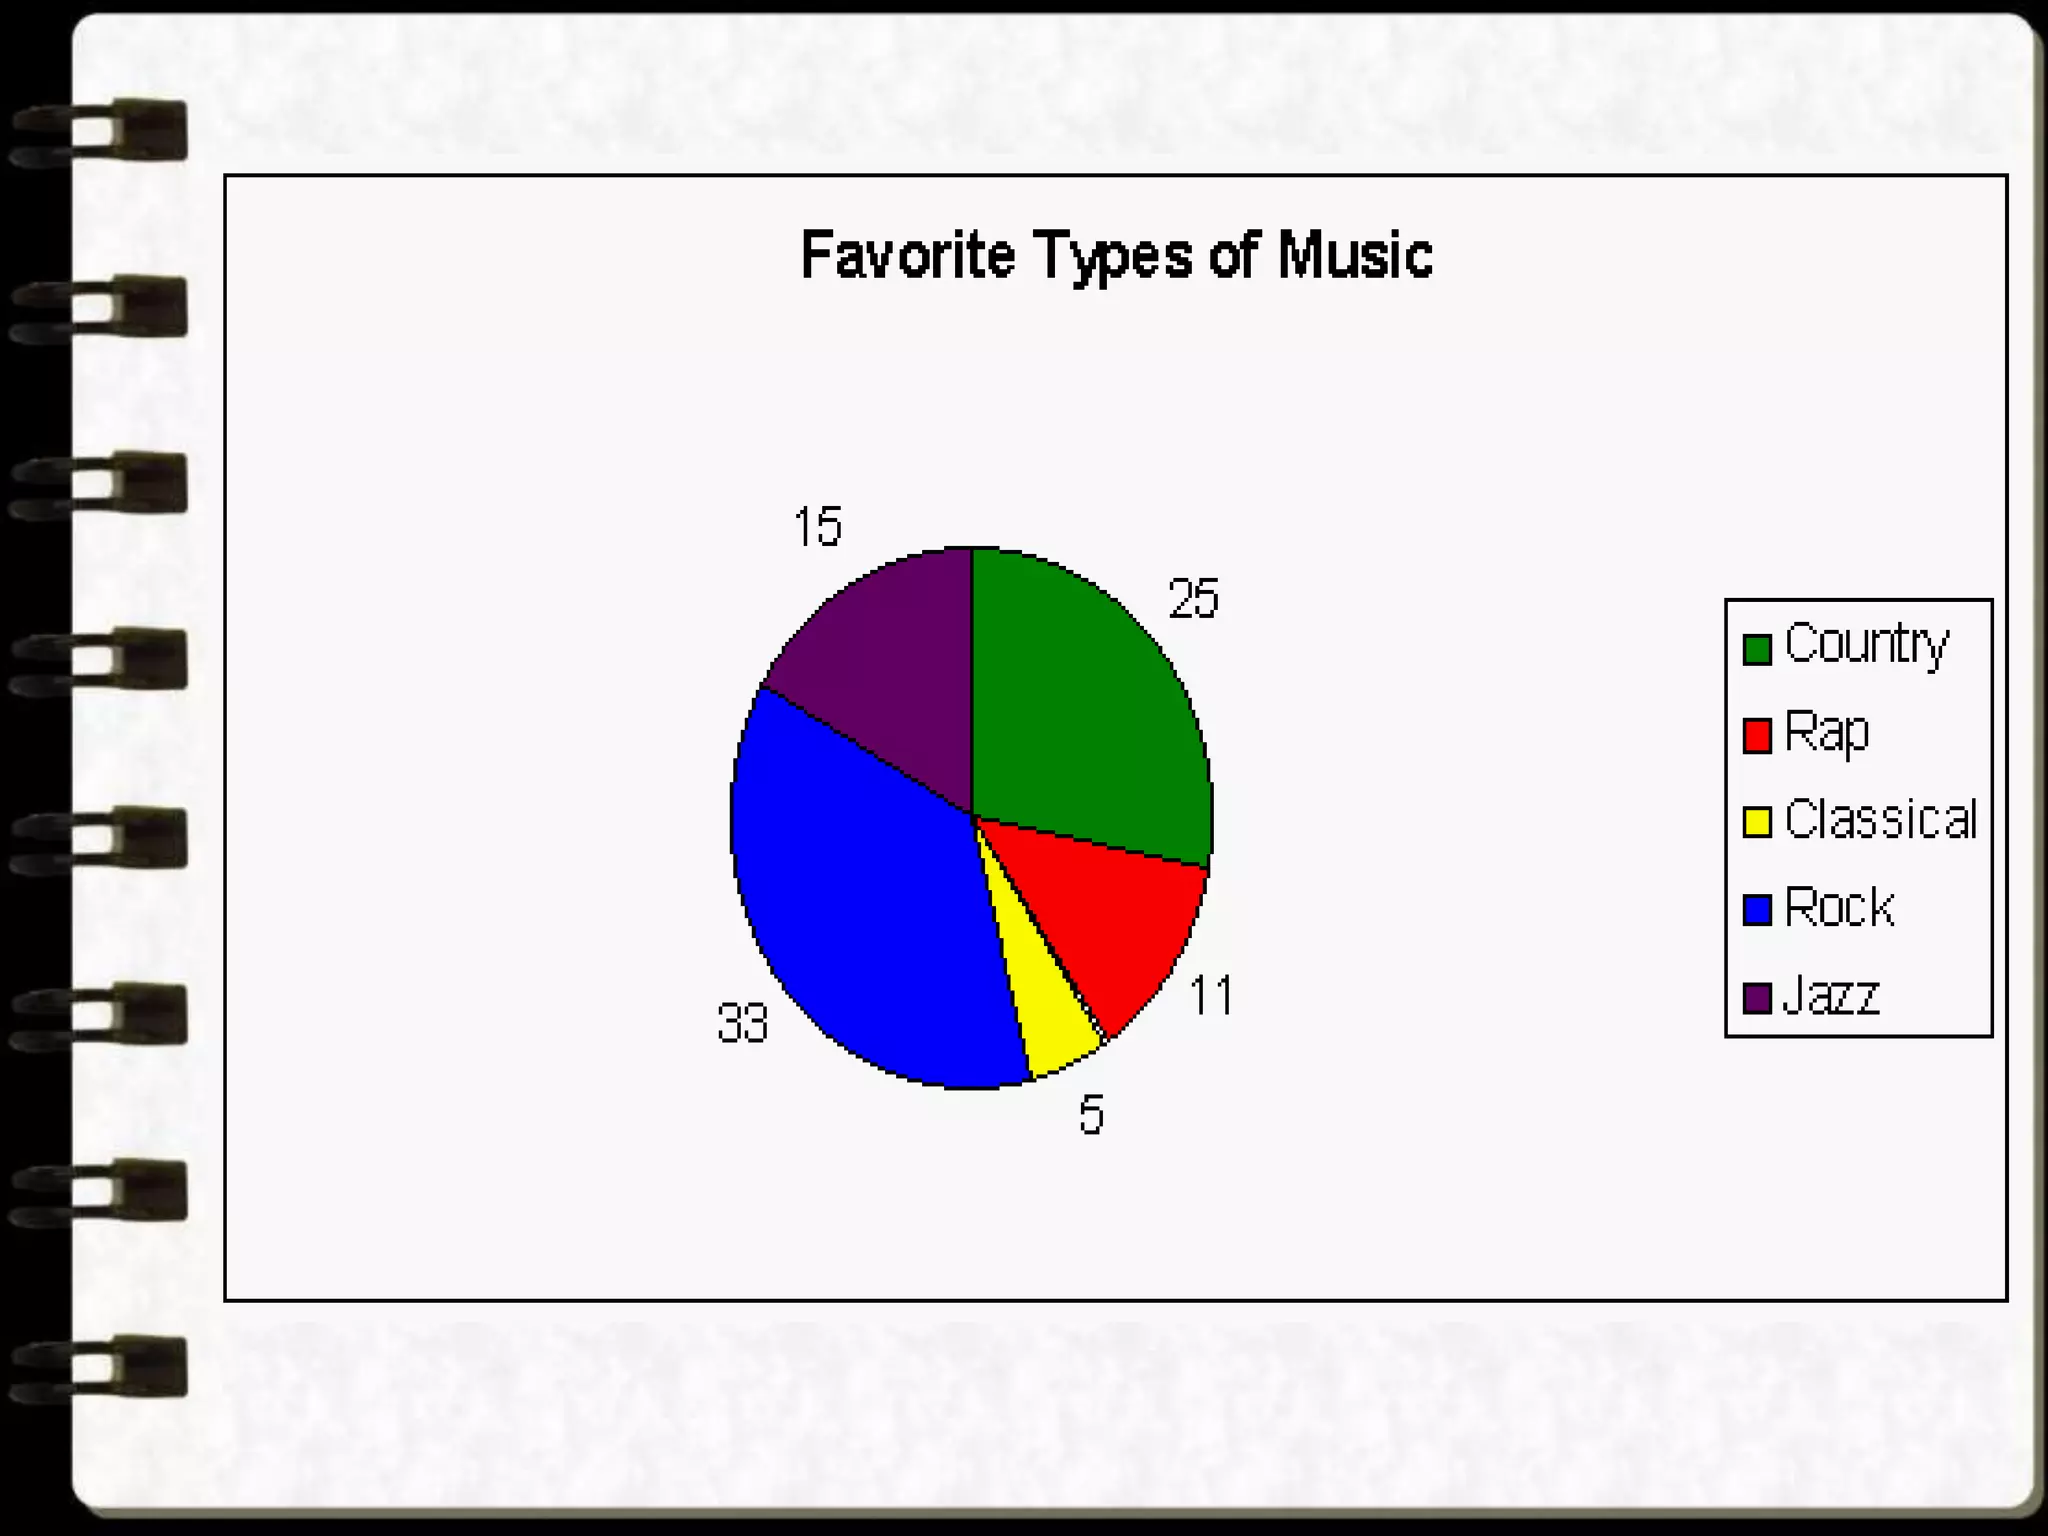
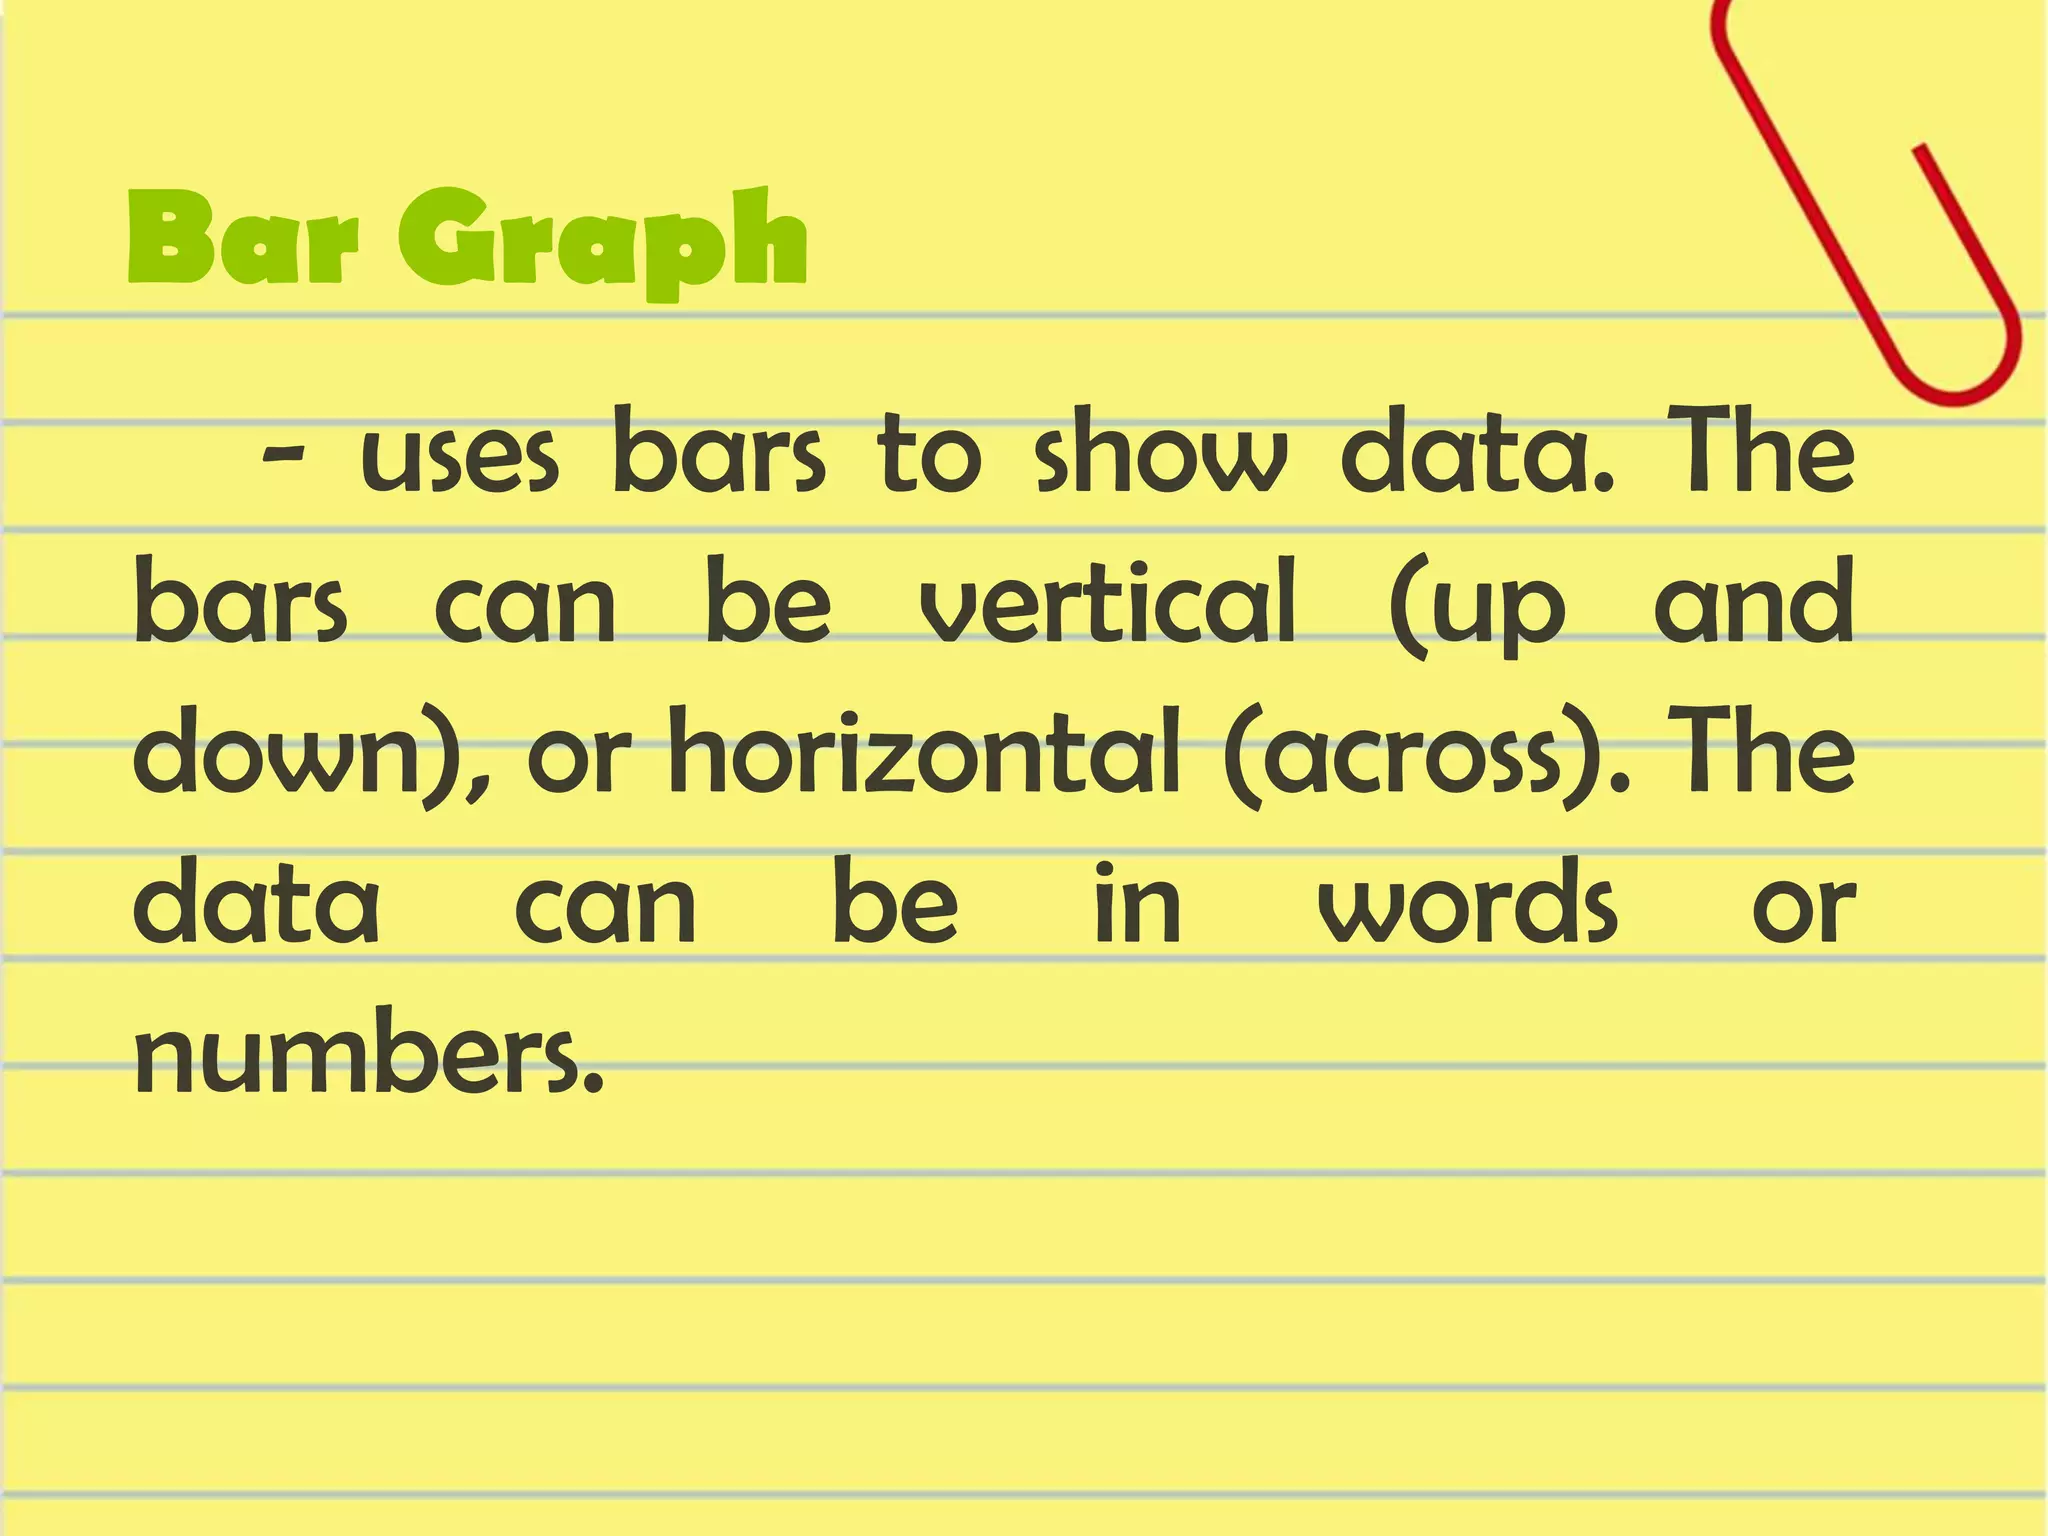
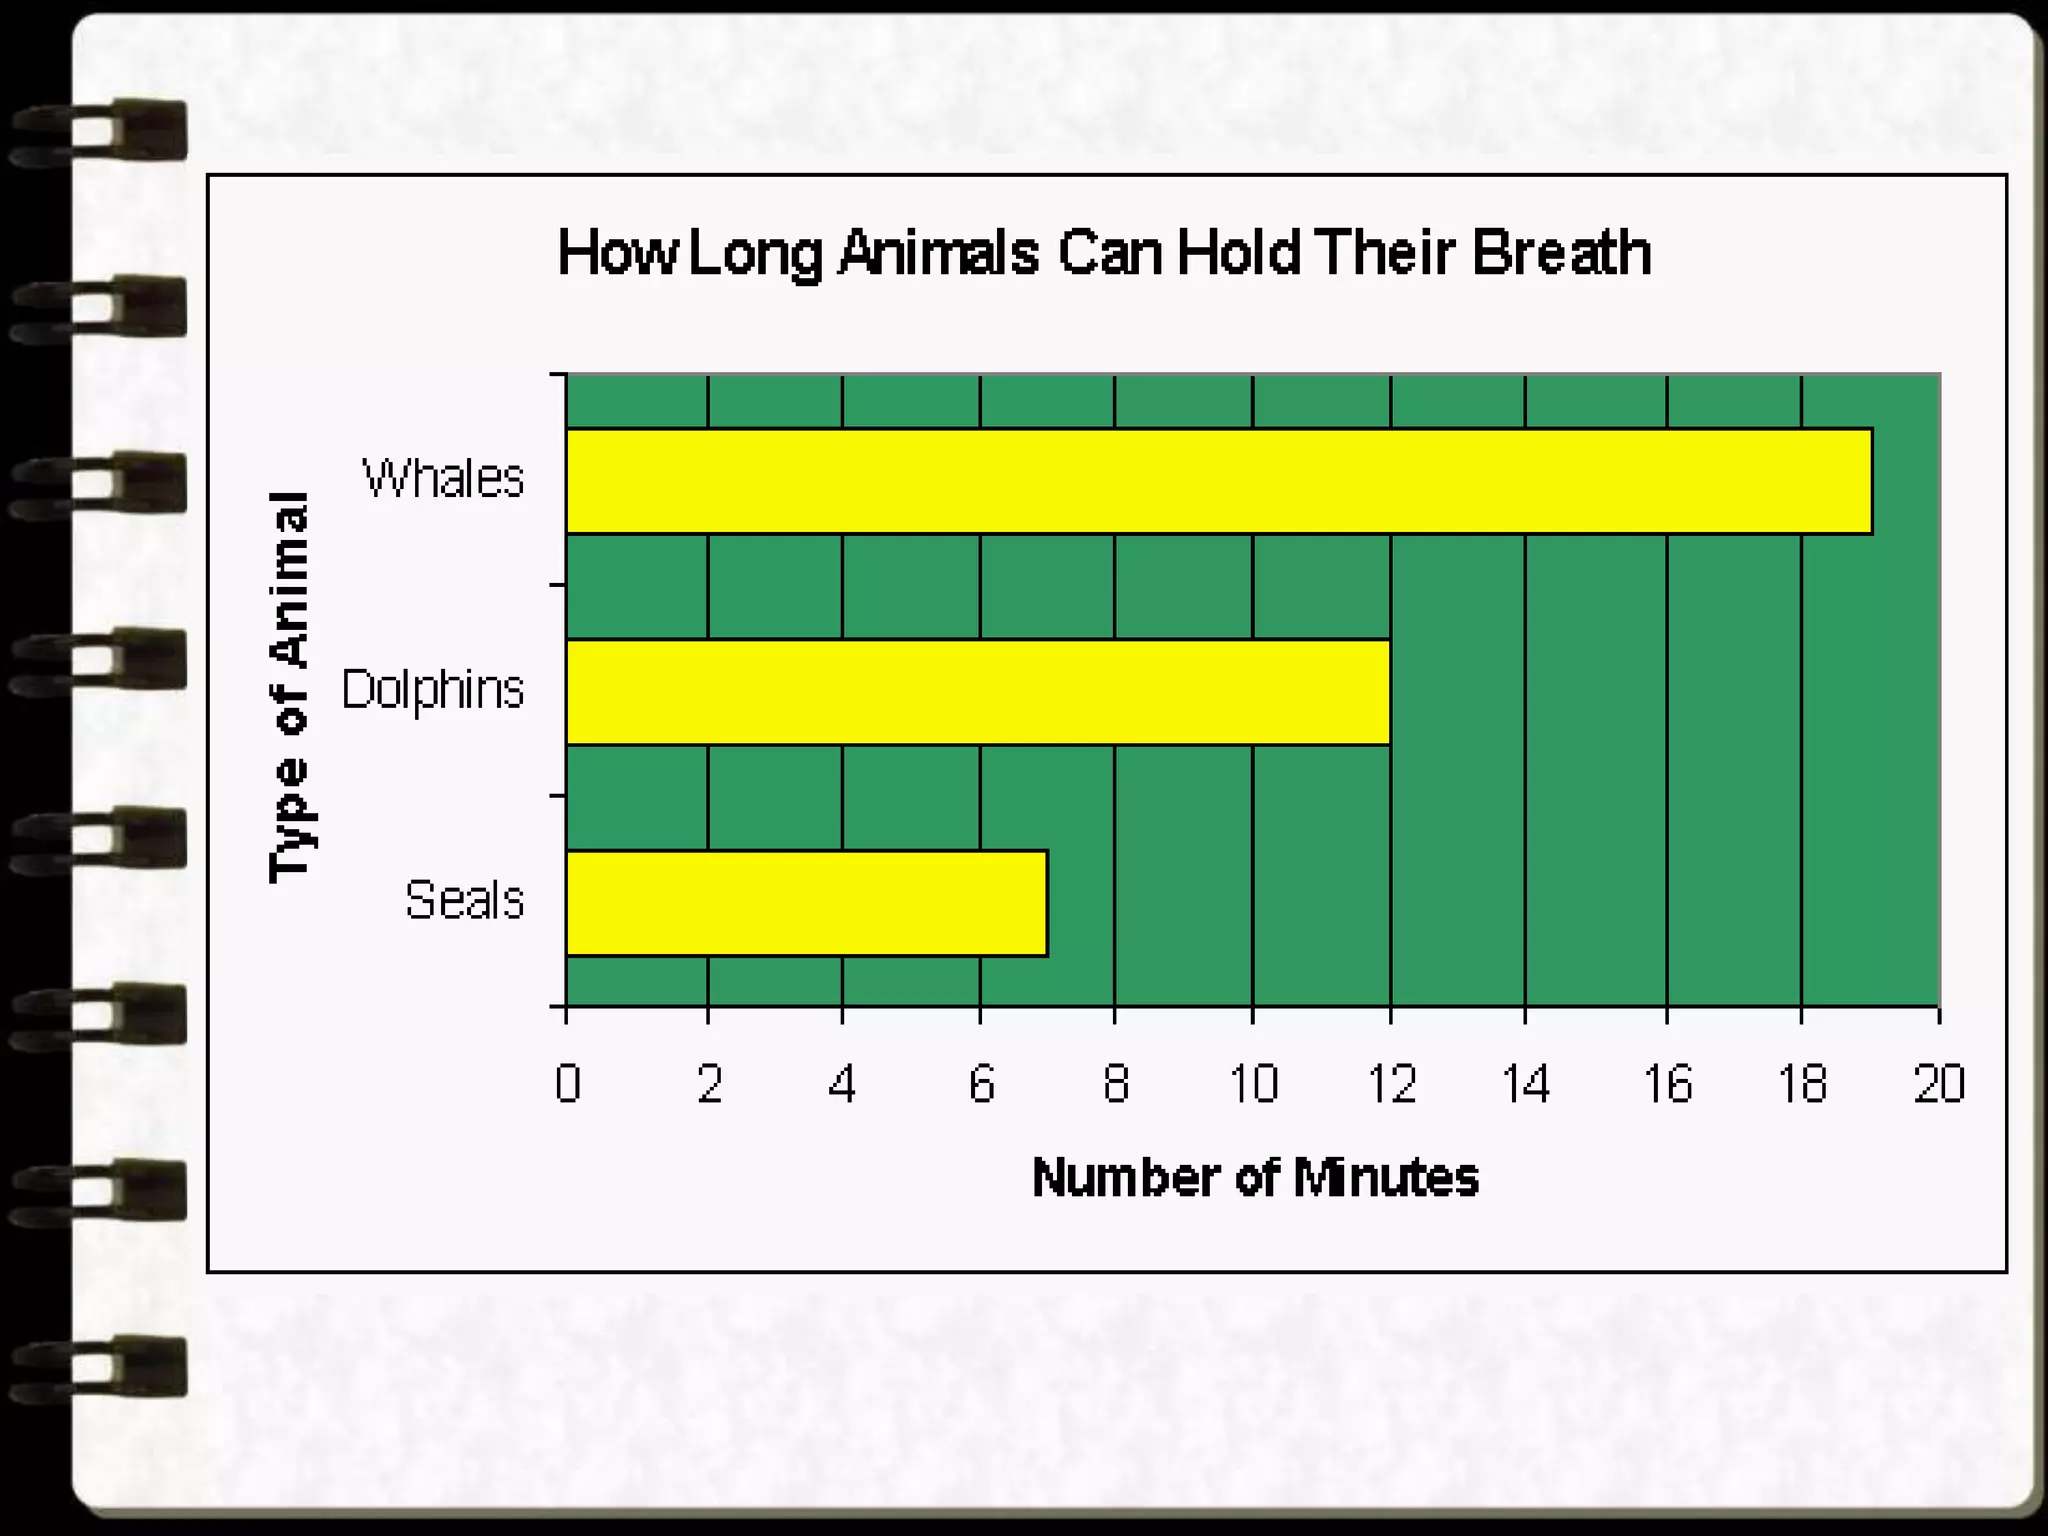
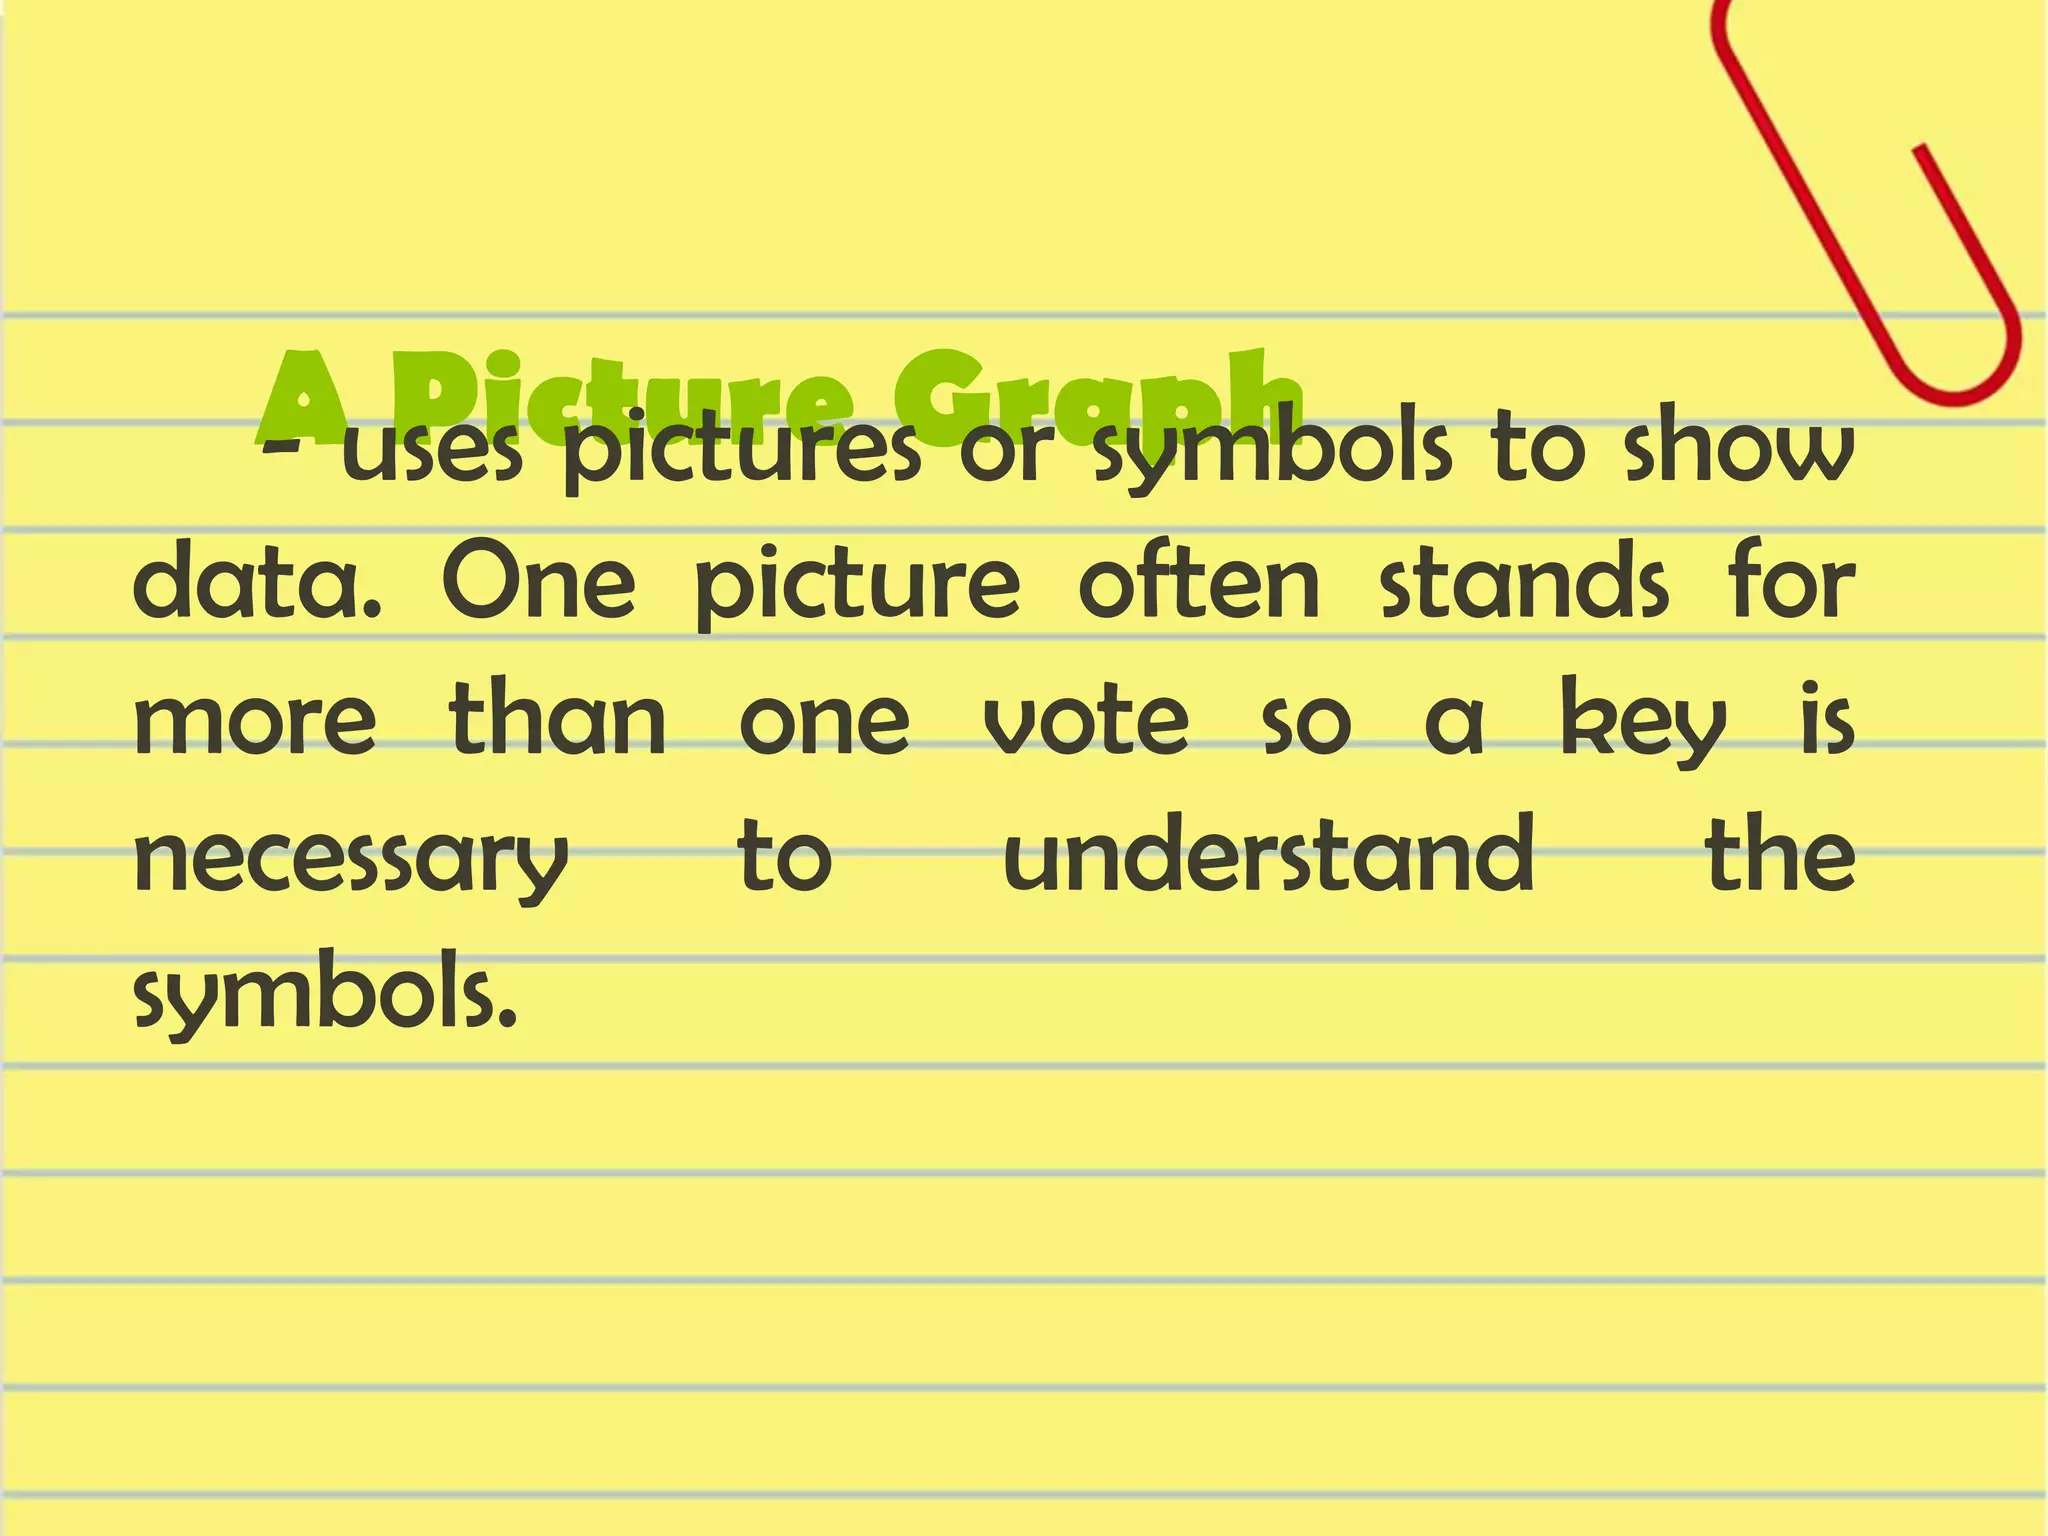
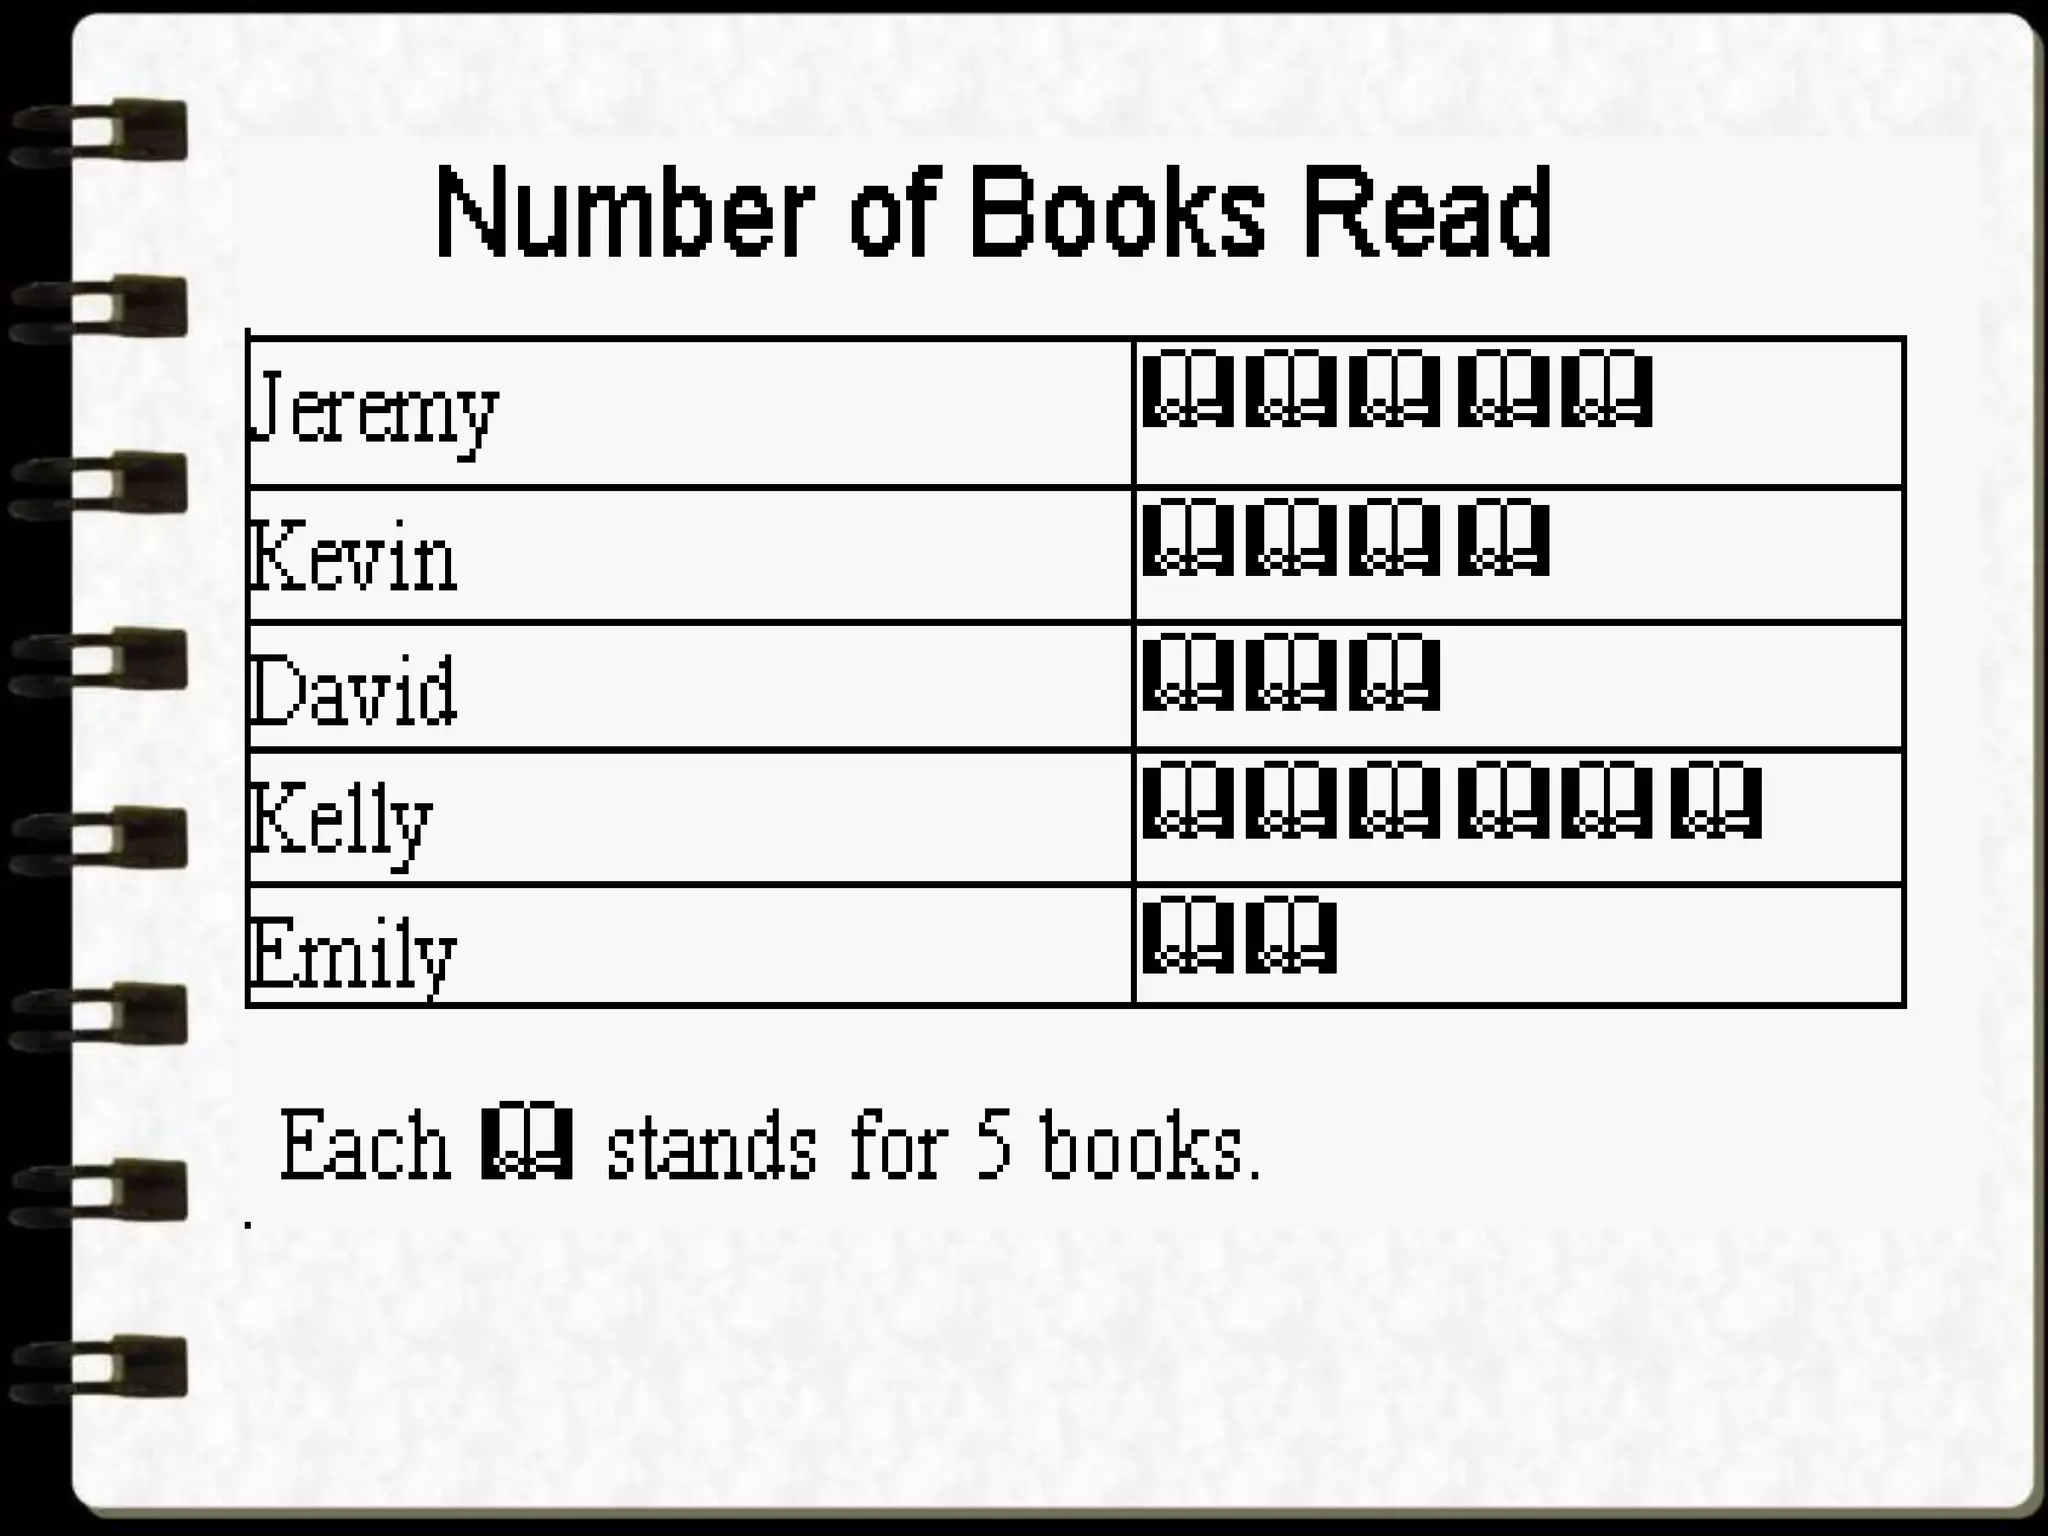
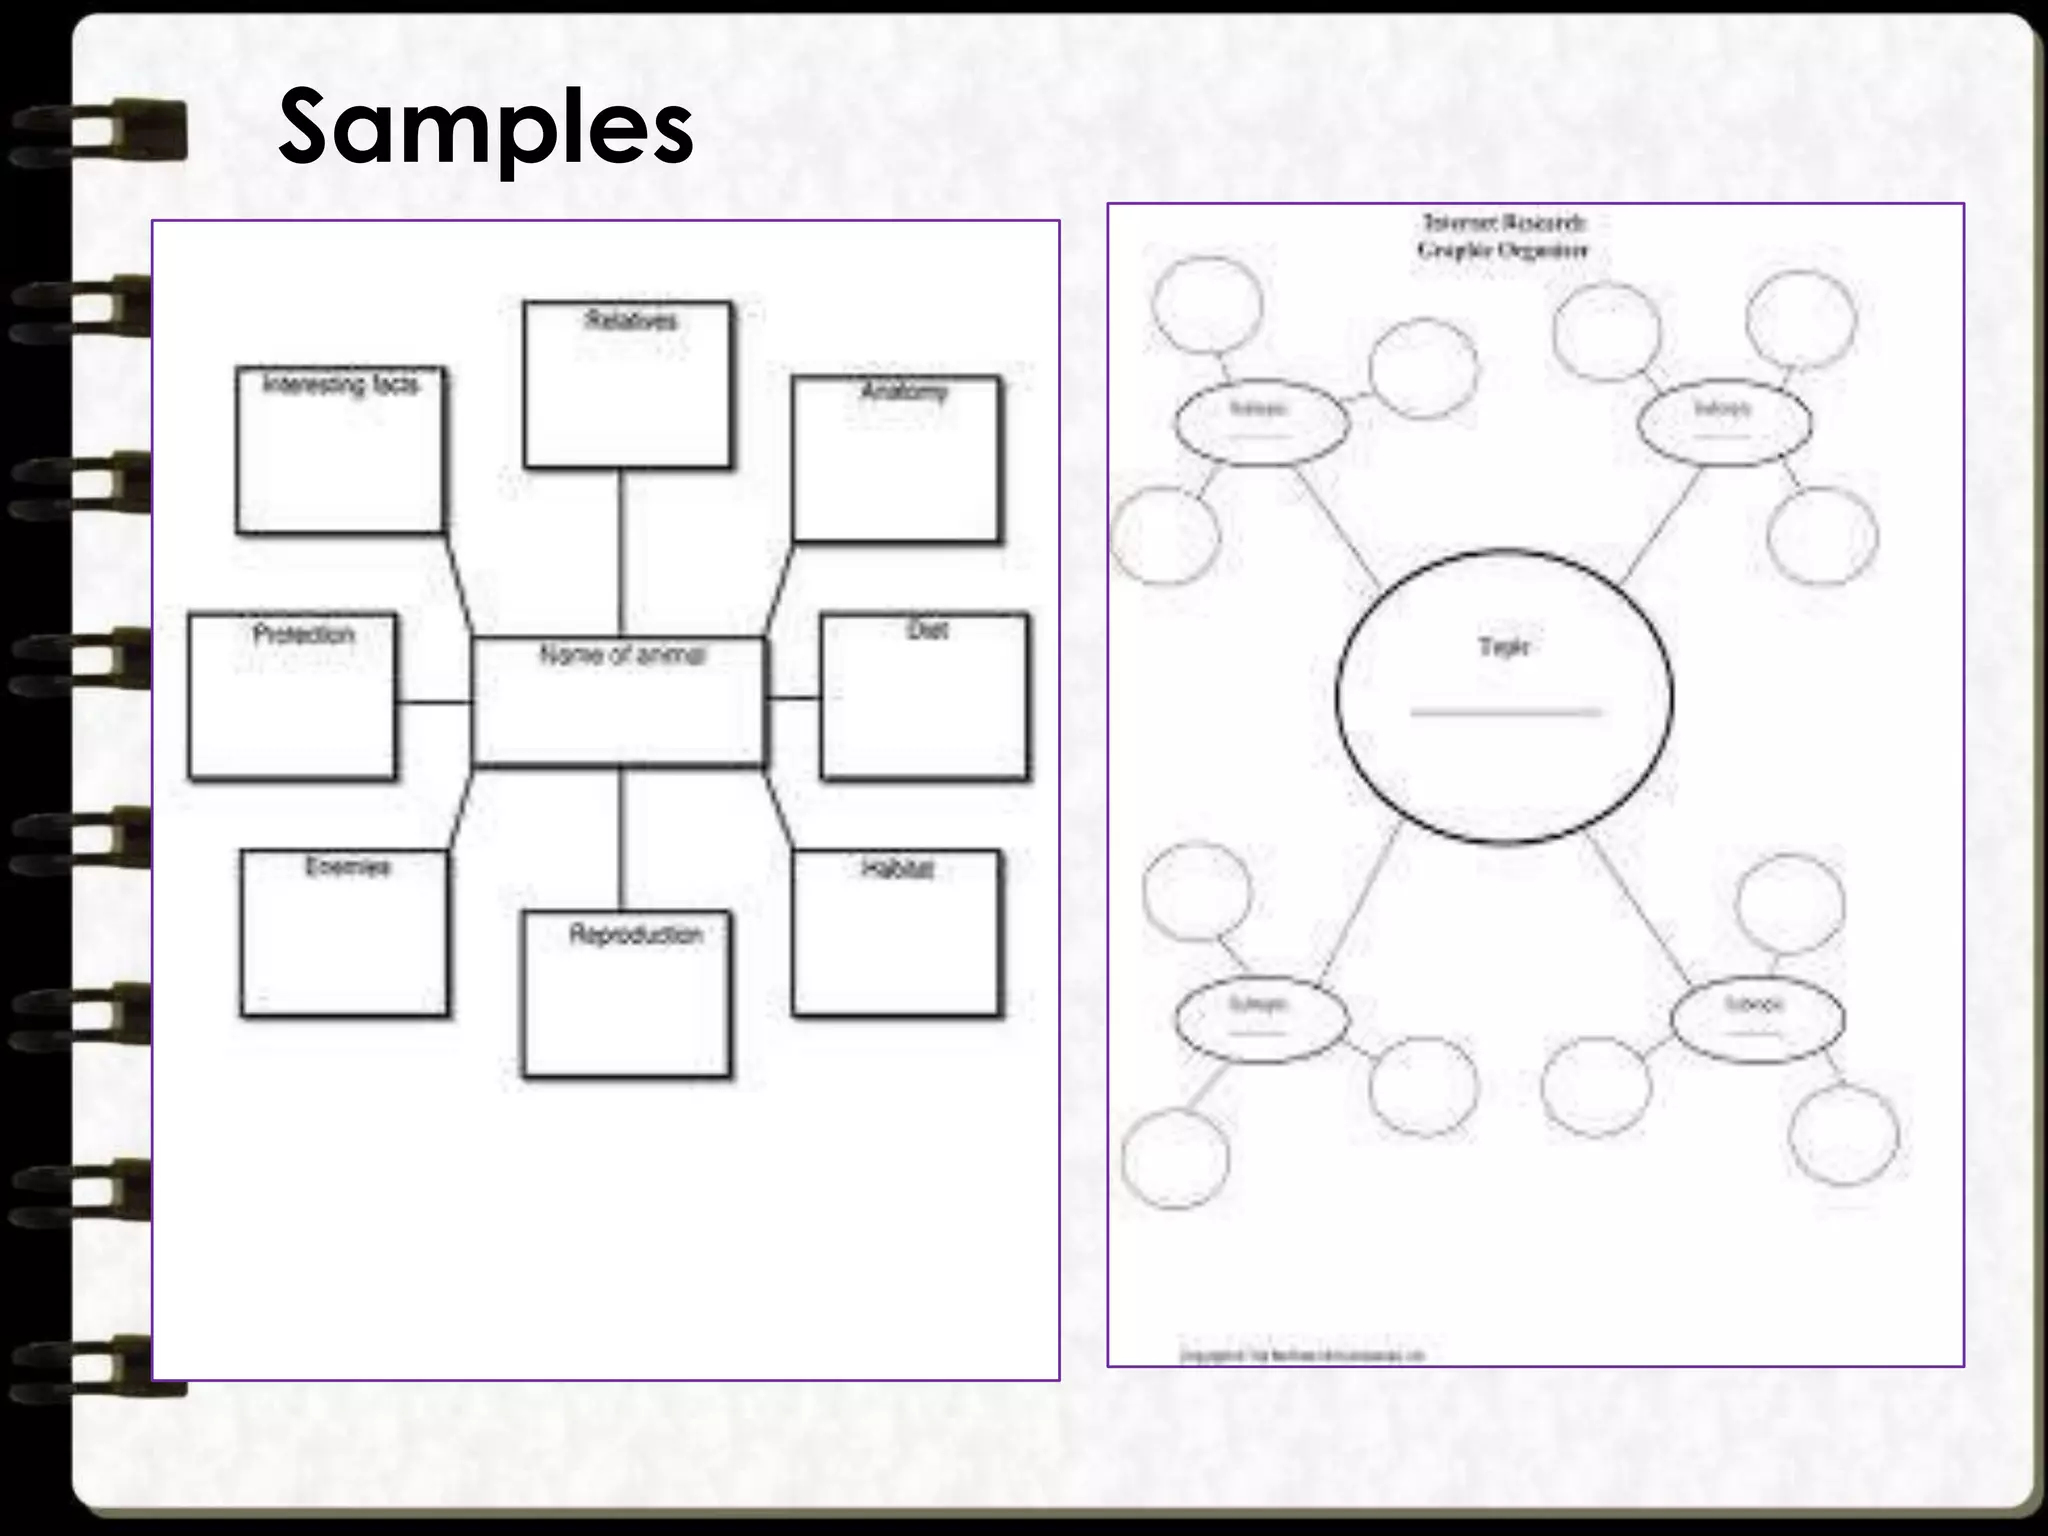
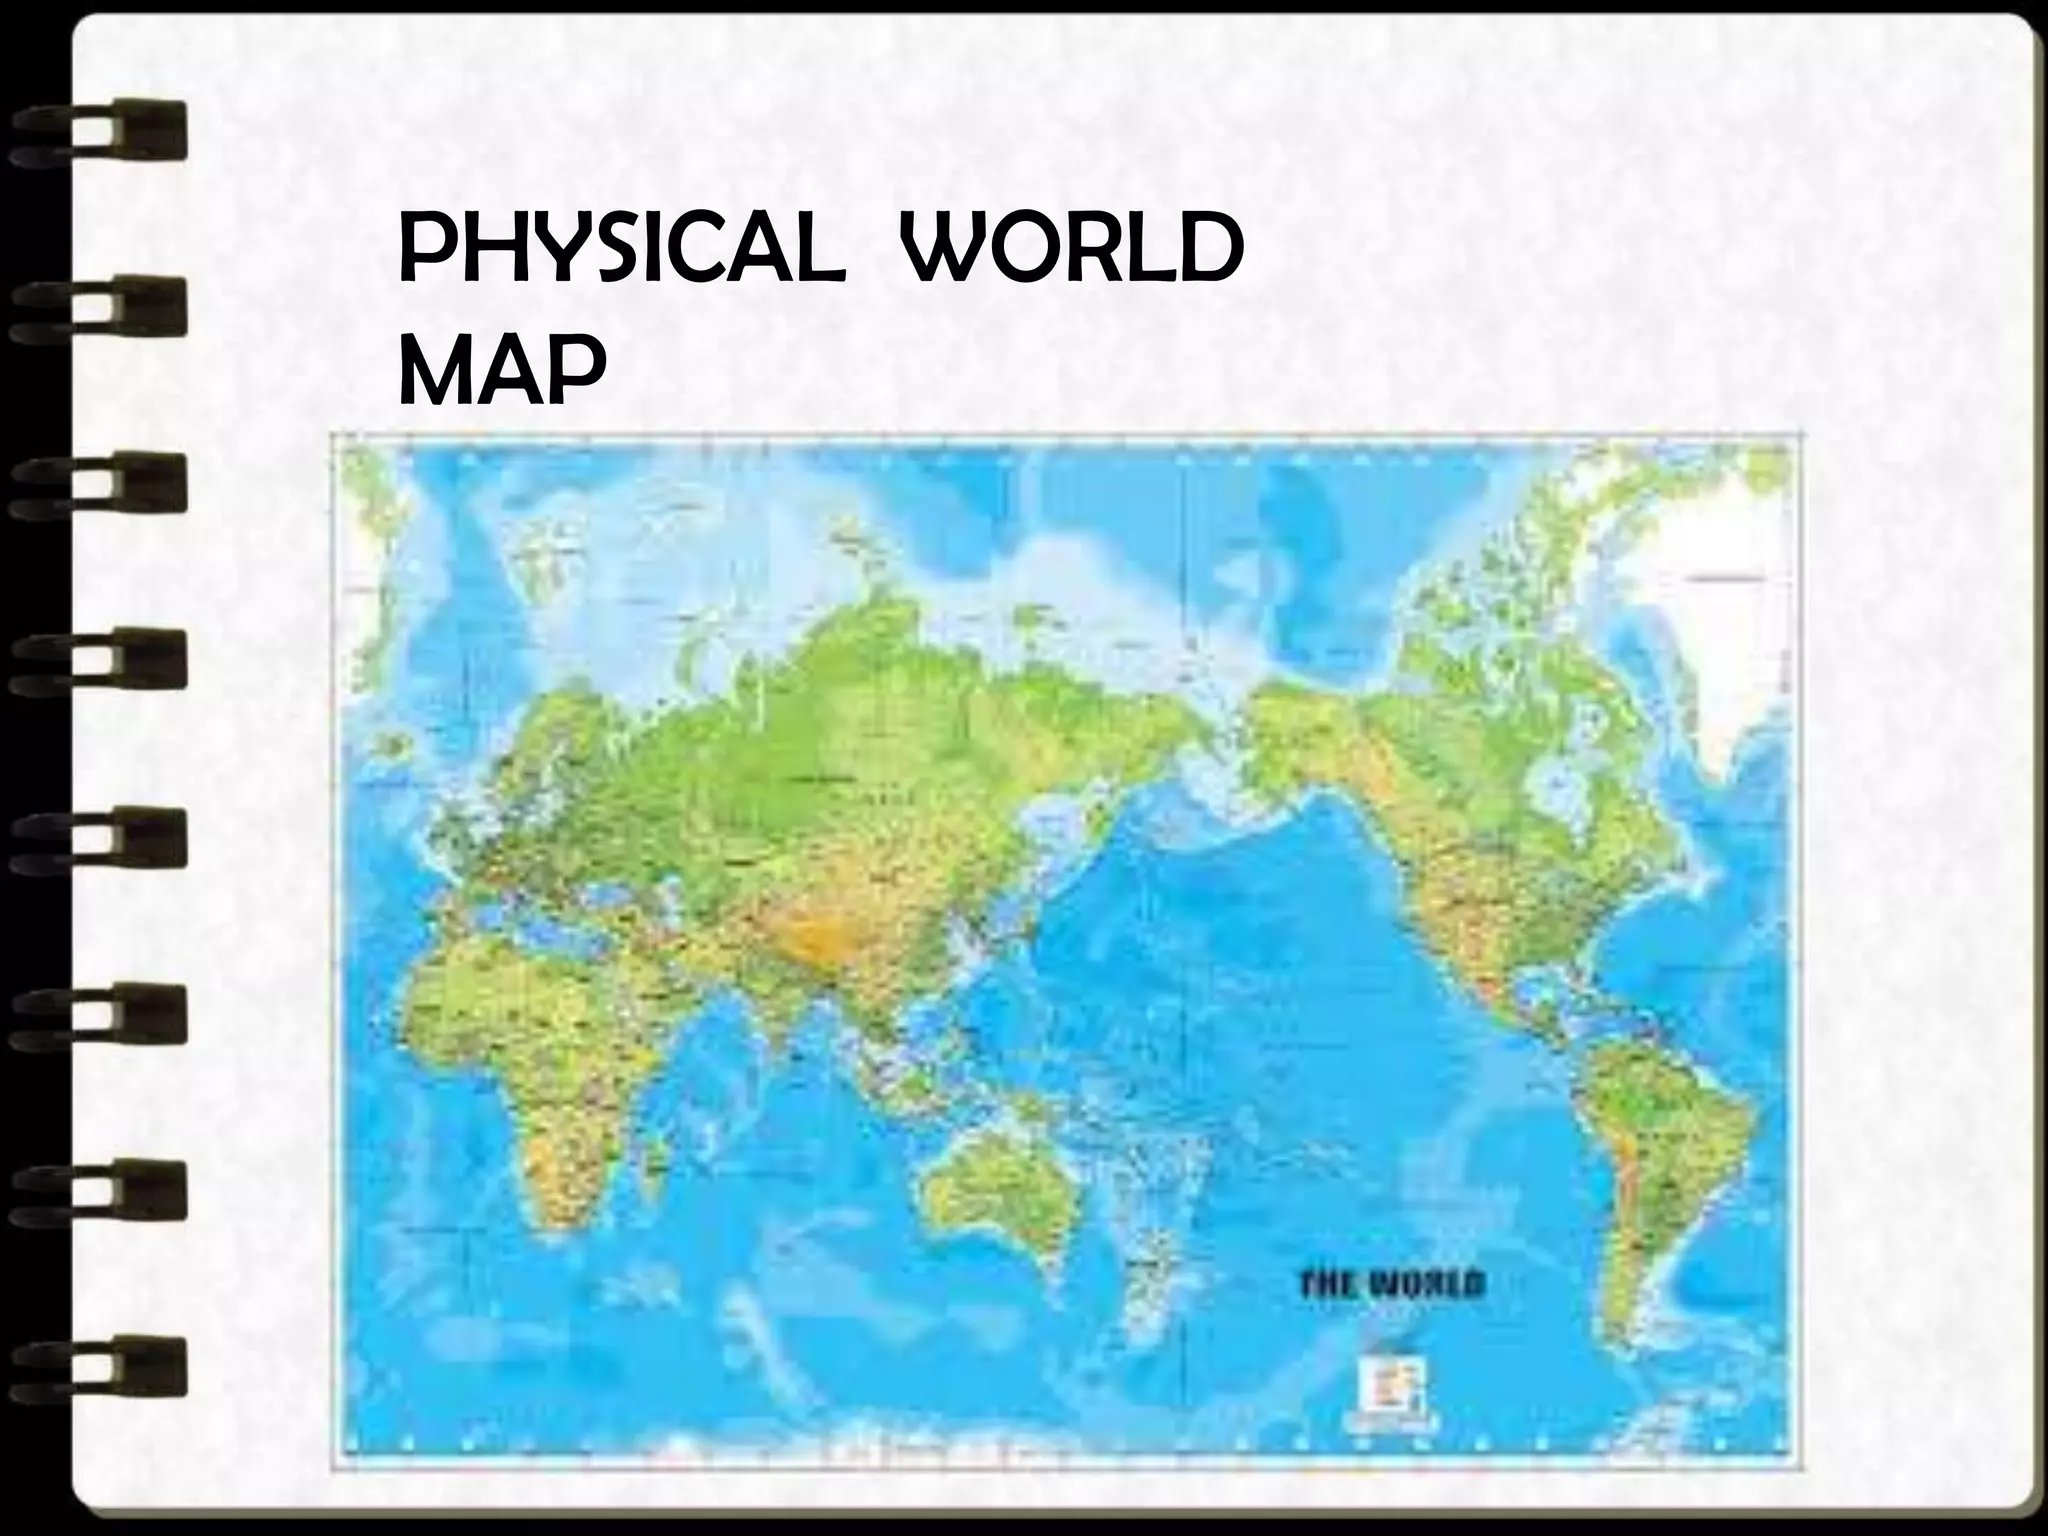
SlideShare a Scribd company logo
1 of 52
Teaching with

Visual Symbols
Visual symbols
-Representations of direct reality, which comes in the form of signs
and symbols.The visual aids are what help the students understand
what the lesson is all about.
-There are different kinds of visual symbols. These include drawings,
cartoons, strip drawings, diagrams, charts, graphs and maps.
Kinds of

Visual Symbols
A. DRAWINGS

- Concrete visual or a representation of
a real thing. It helps illustrating our
lecture through freehand sketching in a
chalkboard.
Samples
B.CARTOONS
- Another kind of visual symbol. It tells
its story metaphorically. The perfect
cartoon needs no caption. The
symbolism conveys the message.
-It could also be used as a springboard
for a lesson or a concluding activity.
SAMPLES
C. STRIP DRAWINGS

-commonly called comics or
comic strip. It is educational and
entertaining at the same time.

- it could also serve as
motivation and a starter of a lesson.
It can also be given as an activity for
students to express insights gained at
he conclusion of a lesson.
D. DIAGRAMS drawing
- Any line

that shows
arrangement and relations as of parts to the
whole, relative values, origins and development,
chronological fluctuations, distributions, etc. –
DALE
The word GRAPH is sometimes used as
a synonym for diagram.
Types of a Diagram
•Affinity Diagram
- used to cluster complex apparently
unrelated data into natural and
meaningful groups.
- is a tool that gathers large amounts
of language data (ideas, opinions, issues)
and organizes them into groupings based
on their natural relationships .
Tree Diagram

- Used to chart out, in increasing
details, the various tasks that must be
accomplished to complete a project or
achieve a specific objective.
Fishbone Diagram
- Also called cause-and-effect diagram.
It is a structured form of brainstorming
that graphically shows the relationship
of possible causes and sub causes directly
related to an identified effect/problem.
It is most commonly used to analyze
work-related problems.
E. CHARTS
- diagrammatic representation of
relationships within an organizations.
• Time Chart
• Tree or Stream Chart
• Flow Chart
• Organizational Chart
• Comparison and Contrast Chart
• Pareto Chart
Time Chart
- tabular time chart that
presents data in ordinal sequence.
Tree or Stream Chart
-depicts development, growth
and change by beginning with a
simple course with spread outs into
many branches.
Flowchart
- visual way of charting or
showing a process from beginning
to end. It is a means of analyzing a
process. By outlining every step in
a process, you can begin to find
inefficiencies or problems.
Organizational Chart
- shows how one part of the
organization relates to other
parts of the organization.
Comparison and Contrast Chart

A compare and contrast
chart used to evaluate
the similarities and
differences between two
subject or objects.
Comparison and Contrast
Chart
Pareto chart
- type of bar chart,
prioritized in descending order
of magnitude or importance
from left to right.
F. GRAPHS
- pictures that help us
understand
amounts.
These amounts are
called data.
Circle Graph

- is shaped like a circle. It is
divided into fractions that look
like pieces of pie, so sometimes a
circle graph is called a pie graph.
Many times the fractional parts
are different colors and a key
explains the colors.
Bar Graph
- uses bars to show data. The
bars can be vertical (up and
down), or horizontal (across). The
data can be in words or
numbers.
Auses pictures or symbols to show
- Picture Graph
data. One picture often stands for
more than one vote so a key is
necessary to understand the
symbols.
GRAPHIC
ORGANIZER

-you met several
graphic organizers in
your subject, principles
of teaching.
Samples
Map/Maps
-Maps represent the surface of the
earth. Different kinds of maps can
be used depending on what the
lesson is about.
Kinds of Map

•RELIEF MAP
•PHYSICAL MAP
•COMMERCIAL or
ECONOMIC MAP

•POLITICAL MAP
RELIEF MAP
has three dimensional
representations and show
contours of the physical data
of the earth or part of the
earth.
Philippines RELIEF MAP
PHYSICAL MAP
combine in a single projection data
like altitude, temperature, rainfall,
precipitation, vegetation and soil.
PHYSICAL WORLD
MAP
COMMERCIAL or
ECONOMIC MAP
Also called product or
industrial map since they
show land areas in relation to
the economy.
COMMERCIAL or
ECONOMIC MAP
POLITICAL MAP

Gives detailed information about country,
provinces, cities and towns, roads and
highway. Oceans, rivers and lakes are
themain features of most political maps.
WORLD POLITICAL MAP
MAP LANGUAGE
• SCALE- shows how much of the actual
earth’s surface is represented by a
given measurement on a map. The
scale must be shown so thet the map
reader can use the distances and
areas shown on the map.
1 inch = 15 statute miles
SYMBOLS- usually a map has a legend
that explains what each symbol
means. Some symbols represent
• COLOR- the different colors of the map
are part of the map language.

GEOGRAPHIC GRIDS- the entire system of
•
•
•
•

these grid lines are called grid lines. These
grid lines are called mrridians and parallels.
Meridian-north to south pole line.
Parallels- lines drawn around a globe with
allpoints.
Longitude- distance in degrees of any place
east or west of the prime meridian.
Latitude- distance in degrees of any place
north and south of the equator.
Submitted by:
Ricalyn T. Obal
Student
Submitted to:
Mary Gene I. Panes
Professor

More Related Content

What's hot

What's hot (20)

Educational Technology 1
Educational Technology 1Educational Technology 1
Educational Technology 1
 
TEACHING WITH VISUAL SYMBOLS
TEACHING WITH VISUAL SYMBOLSTEACHING WITH VISUAL SYMBOLS
TEACHING WITH VISUAL SYMBOLS
 
Graphic materials
Graphic materialsGraphic materials
Graphic materials
 
Teaching with visual symbol
Teaching with visual symbolTeaching with visual symbol
Teaching with visual symbol
 
Hairo capitulo
Hairo capituloHairo capitulo
Hairo capitulo
 
Visual symbols
Visual symbolsVisual symbols
Visual symbols
 
Teaching with Visual Symbols
Teaching with Visual SymbolsTeaching with Visual Symbols
Teaching with Visual Symbols
 
Teaching with Visual Symbols
Teaching with Visual SymbolsTeaching with Visual Symbols
Teaching with Visual Symbols
 
teaching visual symbols
teaching visual symbolsteaching visual symbols
teaching visual symbols
 
Types of Charts
Types of ChartsTypes of Charts
Types of Charts
 
Graphic Aids in Making Reports
Graphic Aids in Making ReportsGraphic Aids in Making Reports
Graphic Aids in Making Reports
 
Graphic communication
Graphic communicationGraphic communication
Graphic communication
 
Essential features of maps
Essential features of mapsEssential features of maps
Essential features of maps
 
Non – projected
Non – projectedNon – projected
Non – projected
 
Educational Technology I Report
Educational Technology I ReportEducational Technology I Report
Educational Technology I Report
 
Tx history-ch-1.3
Tx history-ch-1.3Tx history-ch-1.3
Tx history-ch-1.3
 
TX History Ch 1.3
TX History Ch 1.3TX History Ch 1.3
TX History Ch 1.3
 
Prof ed 9a
Prof ed 9a Prof ed 9a
Prof ed 9a
 
Vocabulary
VocabularyVocabulary
Vocabulary
 
Chapt02 lecture getis 13e
Chapt02 lecture getis 13eChapt02 lecture getis 13e
Chapt02 lecture getis 13e
 

Viewers also liked

Viewers also liked (9)

History Of Educational Technology
History Of Educational TechnologyHistory Of Educational Technology
History Of Educational Technology
 
Eden Project Green Fingers Festival June 2014
Eden Project Green Fingers Festival June 2014Eden Project Green Fingers Festival June 2014
Eden Project Green Fingers Festival June 2014
 
History of educational technology ppt
History of educational technology pptHistory of educational technology ppt
History of educational technology ppt
 
Graphic organizers
Graphic organizersGraphic organizers
Graphic organizers
 
What is the eden project
What is the eden project What is the eden project
What is the eden project
 
History of-educational-technology-timeline
History of-educational-technology-timelineHistory of-educational-technology-timeline
History of-educational-technology-timeline
 
Computer Education Curriculum in Nursery and Primary School
Computer Education Curriculum in Nursery and Primary SchoolComputer Education Curriculum in Nursery and Primary School
Computer Education Curriculum in Nursery and Primary School
 
Graphic organizer Presentation
Graphic organizer PresentationGraphic organizer Presentation
Graphic organizer Presentation
 
Peter Stewart - Eden Project
Peter Stewart  - Eden ProjectPeter Stewart  - Eden Project
Peter Stewart - Eden Project
 

Similar to Educational technology(report) ricalyn

Visual symbols by: Mary Joice T. De Jesus
Visual symbols by: Mary Joice T. De JesusVisual symbols by: Mary Joice T. De Jesus
Visual symbols by: Mary Joice T. De Jesusmary joice de jesus
 
Visual symbols by: Mary Joice T. De Jesus
Visual symbols  by: Mary Joice T. De JesusVisual symbols  by: Mary Joice T. De Jesus
Visual symbols by: Mary Joice T. De Jesusmary joice de jesus
 
Audio visual aids or Instructional aids
Audio visual aids or Instructional aidsAudio visual aids or Instructional aids
Audio visual aids or Instructional aids1302011987
 
Visual Symbol Presentation
Visual Symbol PresentationVisual Symbol Presentation
Visual Symbol PresentationRachel Villegas
 
Lesson 13 Teaching With Visual Symbols (EDUC Subject, can't remember)
Lesson 13 Teaching With Visual Symbols (EDUC Subject, can't remember)Lesson 13 Teaching With Visual Symbols (EDUC Subject, can't remember)
Lesson 13 Teaching With Visual Symbols (EDUC Subject, can't remember)Arnie Valera
 
Teaching with visual symbols(caballero,kayraine mae)
Teaching with visual symbols(caballero,kayraine mae)Teaching with visual symbols(caballero,kayraine mae)
Teaching with visual symbols(caballero,kayraine mae)Kayraine Mae Caballero
 
Lesson 13: Teaching with Visual Symbols(Kayraine Mae Caballero)
Lesson 13: Teaching with Visual Symbols(Kayraine Mae Caballero)Lesson 13: Teaching with Visual Symbols(Kayraine Mae Caballero)
Lesson 13: Teaching with Visual Symbols(Kayraine Mae Caballero)Martin Lou Abarro
 
Teaching with visual symbols
Teaching with visual symbolsTeaching with visual symbols
Teaching with visual symbolsIra Sagu
 
Lesson 13; Teaching with Visual Symbols
Lesson 13; Teaching with Visual SymbolsLesson 13; Teaching with Visual Symbols
Lesson 13; Teaching with Visual Symbolsrenalyn espinola
 
charts.docx
charts.docxcharts.docx
charts.docxRajani17
 
Graphic inquiry
Graphic inquiryGraphic inquiry
Graphic inquiryJenn Alevy
 
BUSINESS INTELLIGENCE AND DATA ANALYTICS presentation
BUSINESS INTELLIGENCE AND DATA ANALYTICS  presentationBUSINESS INTELLIGENCE AND DATA ANALYTICS  presentation
BUSINESS INTELLIGENCE AND DATA ANALYTICS presentationMohit Negi
 
Edtech slide share
Edtech slide shareEdtech slide share
Edtech slide sharejhasteph
 

Similar to Educational technology(report) ricalyn (20)

Visual symbols by: Mary Joice T. De Jesus
Visual symbols by: Mary Joice T. De JesusVisual symbols by: Mary Joice T. De Jesus
Visual symbols by: Mary Joice T. De Jesus
 
Visual symbols by: Mary Joice T. De Jesus
Visual symbols  by: Mary Joice T. De JesusVisual symbols  by: Mary Joice T. De Jesus
Visual symbols by: Mary Joice T. De Jesus
 
Lesson 13
Lesson 13Lesson 13
Lesson 13
 
Audio visual aids or Instructional aids
Audio visual aids or Instructional aidsAudio visual aids or Instructional aids
Audio visual aids or Instructional aids
 
Visual Symbol Presentation
Visual Symbol PresentationVisual Symbol Presentation
Visual Symbol Presentation
 
Lesson 13 Teaching With Visual Symbols (EDUC Subject, can't remember)
Lesson 13 Teaching With Visual Symbols (EDUC Subject, can't remember)Lesson 13 Teaching With Visual Symbols (EDUC Subject, can't remember)
Lesson 13 Teaching With Visual Symbols (EDUC Subject, can't remember)
 
Teaching with visual symbols(caballero,kayraine mae)
Teaching with visual symbols(caballero,kayraine mae)Teaching with visual symbols(caballero,kayraine mae)
Teaching with visual symbols(caballero,kayraine mae)
 
Lesson 13: Teaching with Visual Symbols(Kayraine Mae Caballero)
Lesson 13: Teaching with Visual Symbols(Kayraine Mae Caballero)Lesson 13: Teaching with Visual Symbols(Kayraine Mae Caballero)
Lesson 13: Teaching with Visual Symbols(Kayraine Mae Caballero)
 
Teaching with visual symbols
Teaching with visual symbolsTeaching with visual symbols
Teaching with visual symbols
 
Non – projected
Non – projectedNon – projected
Non – projected
 
Non – projected
Non – projectedNon – projected
Non – projected
 
Lesson 13; Teaching with Visual Symbols
Lesson 13; Teaching with Visual SymbolsLesson 13; Teaching with Visual Symbols
Lesson 13; Teaching with Visual Symbols
 
seminar
seminarseminar
seminar
 
charts.docx
charts.docxcharts.docx
charts.docx
 
Graphic inquiry
Graphic inquiryGraphic inquiry
Graphic inquiry
 
Non Projected Aid
Non Projected AidNon Projected Aid
Non Projected Aid
 
BUSINESS INTELLIGENCE AND DATA ANALYTICS presentation
BUSINESS INTELLIGENCE AND DATA ANALYTICS  presentationBUSINESS INTELLIGENCE AND DATA ANALYTICS  presentation
BUSINESS INTELLIGENCE AND DATA ANALYTICS presentation
 
Visual symbols
Visual symbolsVisual symbols
Visual symbols
 
Visual Aids.pptx
Visual Aids.pptxVisual Aids.pptx
Visual Aids.pptx
 
Edtech slide share
Edtech slide shareEdtech slide share
Edtech slide share
 

Recently uploaded

08448380779 Call Girls In Civil Lines Women Seeking Men
08448380779 Call Girls In Civil Lines Women Seeking Men08448380779 Call Girls In Civil Lines Women Seeking Men
08448380779 Call Girls In Civil Lines Women Seeking MenDelhi Call girls
 
WhatsApp 9892124323 ✓Call Girls In Kalyan ( Mumbai ) secure service
WhatsApp 9892124323 ✓Call Girls In Kalyan ( Mumbai ) secure serviceWhatsApp 9892124323 ✓Call Girls In Kalyan ( Mumbai ) secure service
WhatsApp 9892124323 ✓Call Girls In Kalyan ( Mumbai ) secure servicePooja Nehwal
 
[2024]Digital Global Overview Report 2024 Meltwater.pdf
[2024]Digital Global Overview Report 2024 Meltwater.pdf[2024]Digital Global Overview Report 2024 Meltwater.pdf
[2024]Digital Global Overview Report 2024 Meltwater.pdfhans926745
 
Neo4j - How KGs are shaping the future of Generative AI at AWS Summit London ...
Neo4j - How KGs are shaping the future of Generative AI at AWS Summit London ...Neo4j - How KGs are shaping the future of Generative AI at AWS Summit London ...
Neo4j - How KGs are shaping the future of Generative AI at AWS Summit London ...Neo4j
 
From Event to Action: Accelerate Your Decision Making with Real-Time Automation
From Event to Action: Accelerate Your Decision Making with Real-Time AutomationFrom Event to Action: Accelerate Your Decision Making with Real-Time Automation
From Event to Action: Accelerate Your Decision Making with Real-Time AutomationSafe Software
 
How to Troubleshoot Apps for the Modern Connected Worker
How to Troubleshoot Apps for the Modern Connected WorkerHow to Troubleshoot Apps for the Modern Connected Worker
How to Troubleshoot Apps for the Modern Connected WorkerThousandEyes
 
🐬 The future of MySQL is Postgres 🐘
🐬  The future of MySQL is Postgres   🐘🐬  The future of MySQL is Postgres   🐘
🐬 The future of MySQL is Postgres 🐘RTylerCroy
 
Histor y of HAM Radio presentation slide
Histor y of HAM Radio presentation slideHistor y of HAM Radio presentation slide
Histor y of HAM Radio presentation slidevu2urc
 
Unblocking The Main Thread Solving ANRs and Frozen Frames
Unblocking The Main Thread Solving ANRs and Frozen FramesUnblocking The Main Thread Solving ANRs and Frozen Frames
Unblocking The Main Thread Solving ANRs and Frozen FramesSinan KOZAK
 
Raspberry Pi 5: Challenges and Solutions in Bringing up an OpenGL/Vulkan Driv...
Raspberry Pi 5: Challenges and Solutions in Bringing up an OpenGL/Vulkan Driv...Raspberry Pi 5: Challenges and Solutions in Bringing up an OpenGL/Vulkan Driv...
Raspberry Pi 5: Challenges and Solutions in Bringing up an OpenGL/Vulkan Driv...Igalia
 
EIS-Webinar-Prompt-Knowledge-Eng-2024-04-08.pptx
EIS-Webinar-Prompt-Knowledge-Eng-2024-04-08.pptxEIS-Webinar-Prompt-Knowledge-Eng-2024-04-08.pptx
EIS-Webinar-Prompt-Knowledge-Eng-2024-04-08.pptxEarley Information Science
 
The Role of Taxonomy and Ontology in Semantic Layers - Heather Hedden.pdf
The Role of Taxonomy and Ontology in Semantic Layers - Heather Hedden.pdfThe Role of Taxonomy and Ontology in Semantic Layers - Heather Hedden.pdf
The Role of Taxonomy and Ontology in Semantic Layers - Heather Hedden.pdfEnterprise Knowledge
 
Tata AIG General Insurance Company - Insurer Innovation Award 2024
Tata AIG General Insurance Company - Insurer Innovation Award 2024Tata AIG General Insurance Company - Insurer Innovation Award 2024
Tata AIG General Insurance Company - Insurer Innovation Award 2024The Digital Insurer
 
Salesforce Community Group Quito, Salesforce 101
Salesforce Community Group Quito, Salesforce 101Salesforce Community Group Quito, Salesforce 101
Salesforce Community Group Quito, Salesforce 101Paola De la Torre
 
08448380779 Call Girls In Greater Kailash - I Women Seeking Men
08448380779 Call Girls In Greater Kailash - I Women Seeking Men08448380779 Call Girls In Greater Kailash - I Women Seeking Men
08448380779 Call Girls In Greater Kailash - I Women Seeking MenDelhi Call girls
 
The 7 Things I Know About Cyber Security After 25 Years | April 2024
The 7 Things I Know About Cyber Security After 25 Years | April 2024The 7 Things I Know About Cyber Security After 25 Years | April 2024
The 7 Things I Know About Cyber Security After 25 Years | April 2024Rafal Los
 
Data Cloud, More than a CDP by Matt Robison
Data Cloud, More than a CDP by Matt RobisonData Cloud, More than a CDP by Matt Robison
Data Cloud, More than a CDP by Matt RobisonAnna Loughnan Colquhoun
 
Driving Behavioral Change for Information Management through Data-Driven Gree...
Driving Behavioral Change for Information Management through Data-Driven Gree...Driving Behavioral Change for Information Management through Data-Driven Gree...
Driving Behavioral Change for Information Management through Data-Driven Gree...Enterprise Knowledge
 
Presentation on how to chat with PDF using ChatGPT code interpreter
Presentation on how to chat with PDF using ChatGPT code interpreterPresentation on how to chat with PDF using ChatGPT code interpreter
Presentation on how to chat with PDF using ChatGPT code interpreternaman860154
 
Axa Assurance Maroc - Insurer Innovation Award 2024
Axa Assurance Maroc - Insurer Innovation Award 2024Axa Assurance Maroc - Insurer Innovation Award 2024
Axa Assurance Maroc - Insurer Innovation Award 2024The Digital Insurer
 

Recently uploaded (20)

08448380779 Call Girls In Civil Lines Women Seeking Men
08448380779 Call Girls In Civil Lines Women Seeking Men08448380779 Call Girls In Civil Lines Women Seeking Men
08448380779 Call Girls In Civil Lines Women Seeking Men
 
WhatsApp 9892124323 ✓Call Girls In Kalyan ( Mumbai ) secure service
WhatsApp 9892124323 ✓Call Girls In Kalyan ( Mumbai ) secure serviceWhatsApp 9892124323 ✓Call Girls In Kalyan ( Mumbai ) secure service
WhatsApp 9892124323 ✓Call Girls In Kalyan ( Mumbai ) secure service
 
[2024]Digital Global Overview Report 2024 Meltwater.pdf
[2024]Digital Global Overview Report 2024 Meltwater.pdf[2024]Digital Global Overview Report 2024 Meltwater.pdf
[2024]Digital Global Overview Report 2024 Meltwater.pdf
 
Neo4j - How KGs are shaping the future of Generative AI at AWS Summit London ...
Neo4j - How KGs are shaping the future of Generative AI at AWS Summit London ...Neo4j - How KGs are shaping the future of Generative AI at AWS Summit London ...
Neo4j - How KGs are shaping the future of Generative AI at AWS Summit London ...
 
From Event to Action: Accelerate Your Decision Making with Real-Time Automation
From Event to Action: Accelerate Your Decision Making with Real-Time AutomationFrom Event to Action: Accelerate Your Decision Making with Real-Time Automation
From Event to Action: Accelerate Your Decision Making with Real-Time Automation
 
How to Troubleshoot Apps for the Modern Connected Worker
How to Troubleshoot Apps for the Modern Connected WorkerHow to Troubleshoot Apps for the Modern Connected Worker
How to Troubleshoot Apps for the Modern Connected Worker
 
🐬 The future of MySQL is Postgres 🐘
🐬  The future of MySQL is Postgres   🐘🐬  The future of MySQL is Postgres   🐘
🐬 The future of MySQL is Postgres 🐘
 
Histor y of HAM Radio presentation slide
Histor y of HAM Radio presentation slideHistor y of HAM Radio presentation slide
Histor y of HAM Radio presentation slide
 
Unblocking The Main Thread Solving ANRs and Frozen Frames
Unblocking The Main Thread Solving ANRs and Frozen FramesUnblocking The Main Thread Solving ANRs and Frozen Frames
Unblocking The Main Thread Solving ANRs and Frozen Frames
 
Raspberry Pi 5: Challenges and Solutions in Bringing up an OpenGL/Vulkan Driv...
Raspberry Pi 5: Challenges and Solutions in Bringing up an OpenGL/Vulkan Driv...Raspberry Pi 5: Challenges and Solutions in Bringing up an OpenGL/Vulkan Driv...
Raspberry Pi 5: Challenges and Solutions in Bringing up an OpenGL/Vulkan Driv...
 
EIS-Webinar-Prompt-Knowledge-Eng-2024-04-08.pptx
EIS-Webinar-Prompt-Knowledge-Eng-2024-04-08.pptxEIS-Webinar-Prompt-Knowledge-Eng-2024-04-08.pptx
EIS-Webinar-Prompt-Knowledge-Eng-2024-04-08.pptx
 
The Role of Taxonomy and Ontology in Semantic Layers - Heather Hedden.pdf
The Role of Taxonomy and Ontology in Semantic Layers - Heather Hedden.pdfThe Role of Taxonomy and Ontology in Semantic Layers - Heather Hedden.pdf
The Role of Taxonomy and Ontology in Semantic Layers - Heather Hedden.pdf
 
Tata AIG General Insurance Company - Insurer Innovation Award 2024
Tata AIG General Insurance Company - Insurer Innovation Award 2024Tata AIG General Insurance Company - Insurer Innovation Award 2024
Tata AIG General Insurance Company - Insurer Innovation Award 2024
 
Salesforce Community Group Quito, Salesforce 101
Salesforce Community Group Quito, Salesforce 101Salesforce Community Group Quito, Salesforce 101
Salesforce Community Group Quito, Salesforce 101
 
08448380779 Call Girls In Greater Kailash - I Women Seeking Men
08448380779 Call Girls In Greater Kailash - I Women Seeking Men08448380779 Call Girls In Greater Kailash - I Women Seeking Men
08448380779 Call Girls In Greater Kailash - I Women Seeking Men
 
The 7 Things I Know About Cyber Security After 25 Years | April 2024
The 7 Things I Know About Cyber Security After 25 Years | April 2024The 7 Things I Know About Cyber Security After 25 Years | April 2024
The 7 Things I Know About Cyber Security After 25 Years | April 2024
 
Data Cloud, More than a CDP by Matt Robison
Data Cloud, More than a CDP by Matt RobisonData Cloud, More than a CDP by Matt Robison
Data Cloud, More than a CDP by Matt Robison
 
Driving Behavioral Change for Information Management through Data-Driven Gree...
Driving Behavioral Change for Information Management through Data-Driven Gree...Driving Behavioral Change for Information Management through Data-Driven Gree...
Driving Behavioral Change for Information Management through Data-Driven Gree...
 
Presentation on how to chat with PDF using ChatGPT code interpreter
Presentation on how to chat with PDF using ChatGPT code interpreterPresentation on how to chat with PDF using ChatGPT code interpreter
Presentation on how to chat with PDF using ChatGPT code interpreter
 
Axa Assurance Maroc - Insurer Innovation Award 2024
Axa Assurance Maroc - Insurer Innovation Award 2024Axa Assurance Maroc - Insurer Innovation Award 2024
Axa Assurance Maroc - Insurer Innovation Award 2024
 

Educational technology(report) ricalyn

  • 2. Visual symbols -Representations of direct reality, which comes in the form of signs and symbols.The visual aids are what help the students understand what the lesson is all about. -There are different kinds of visual symbols. These include drawings, cartoons, strip drawings, diagrams, charts, graphs and maps.
  • 4. A. DRAWINGS - Concrete visual or a representation of a real thing. It helps illustrating our lecture through freehand sketching in a chalkboard.
  • 6. B.CARTOONS - Another kind of visual symbol. It tells its story metaphorically. The perfect cartoon needs no caption. The symbolism conveys the message. -It could also be used as a springboard for a lesson or a concluding activity.
  • 8. C. STRIP DRAWINGS -commonly called comics or comic strip. It is educational and entertaining at the same time. - it could also serve as motivation and a starter of a lesson. It can also be given as an activity for students to express insights gained at he conclusion of a lesson.
  • 9.
  • 10. D. DIAGRAMS drawing - Any line that shows arrangement and relations as of parts to the whole, relative values, origins and development, chronological fluctuations, distributions, etc. – DALE The word GRAPH is sometimes used as a synonym for diagram.
  • 11. Types of a Diagram
  • 12. •Affinity Diagram - used to cluster complex apparently unrelated data into natural and meaningful groups. - is a tool that gathers large amounts of language data (ideas, opinions, issues) and organizes them into groupings based on their natural relationships .
  • 13.
  • 14. Tree Diagram - Used to chart out, in increasing details, the various tasks that must be accomplished to complete a project or achieve a specific objective.
  • 15.
  • 16. Fishbone Diagram - Also called cause-and-effect diagram. It is a structured form of brainstorming that graphically shows the relationship of possible causes and sub causes directly related to an identified effect/problem. It is most commonly used to analyze work-related problems.
  • 17.
  • 18. E. CHARTS - diagrammatic representation of relationships within an organizations. • Time Chart • Tree or Stream Chart • Flow Chart • Organizational Chart • Comparison and Contrast Chart • Pareto Chart
  • 19. Time Chart - tabular time chart that presents data in ordinal sequence.
  • 20.
  • 21. Tree or Stream Chart -depicts development, growth and change by beginning with a simple course with spread outs into many branches.
  • 22.
  • 23. Flowchart - visual way of charting or showing a process from beginning to end. It is a means of analyzing a process. By outlining every step in a process, you can begin to find inefficiencies or problems.
  • 24.
  • 25. Organizational Chart - shows how one part of the organization relates to other parts of the organization.
  • 26.
  • 27. Comparison and Contrast Chart A compare and contrast chart used to evaluate the similarities and differences between two subject or objects.
  • 29. Pareto chart - type of bar chart, prioritized in descending order of magnitude or importance from left to right.
  • 30.
  • 31. F. GRAPHS - pictures that help us understand amounts. These amounts are called data.
  • 32. Circle Graph - is shaped like a circle. It is divided into fractions that look like pieces of pie, so sometimes a circle graph is called a pie graph. Many times the fractional parts are different colors and a key explains the colors.
  • 33.
  • 34. Bar Graph - uses bars to show data. The bars can be vertical (up and down), or horizontal (across). The data can be in words or numbers.
  • 35.
  • 36. Auses pictures or symbols to show - Picture Graph data. One picture often stands for more than one vote so a key is necessary to understand the symbols.
  • 37.
  • 38. GRAPHIC ORGANIZER -you met several graphic organizers in your subject, principles of teaching.
  • 40. Map/Maps -Maps represent the surface of the earth. Different kinds of maps can be used depending on what the lesson is about.
  • 41. Kinds of Map •RELIEF MAP •PHYSICAL MAP •COMMERCIAL or ECONOMIC MAP •POLITICAL MAP
  • 42. RELIEF MAP has three dimensional representations and show contours of the physical data of the earth or part of the earth.
  • 44. PHYSICAL MAP combine in a single projection data like altitude, temperature, rainfall, precipitation, vegetation and soil.
  • 46. COMMERCIAL or ECONOMIC MAP Also called product or industrial map since they show land areas in relation to the economy.
  • 48. POLITICAL MAP Gives detailed information about country, provinces, cities and towns, roads and highway. Oceans, rivers and lakes are themain features of most political maps.
  • 50. MAP LANGUAGE • SCALE- shows how much of the actual earth’s surface is represented by a given measurement on a map. The scale must be shown so thet the map reader can use the distances and areas shown on the map. 1 inch = 15 statute miles SYMBOLS- usually a map has a legend that explains what each symbol means. Some symbols represent
  • 51. • COLOR- the different colors of the map are part of the map language. GEOGRAPHIC GRIDS- the entire system of • • • • these grid lines are called grid lines. These grid lines are called mrridians and parallels. Meridian-north to south pole line. Parallels- lines drawn around a globe with allpoints. Longitude- distance in degrees of any place east or west of the prime meridian. Latitude- distance in degrees of any place north and south of the equator.
  • 52. Submitted by: Ricalyn T. Obal Student Submitted to: Mary Gene I. Panes Professor