Downloaded 433 times


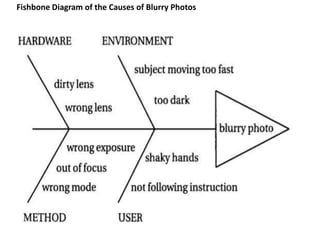


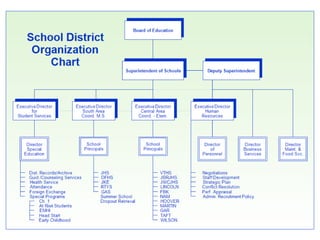
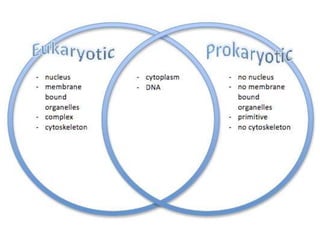

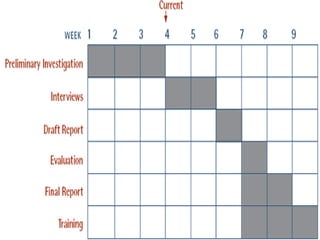

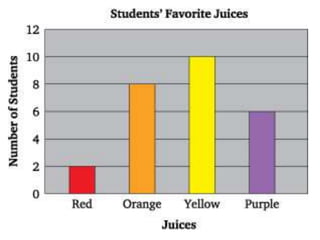
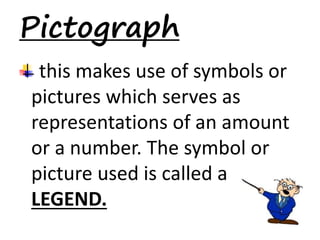
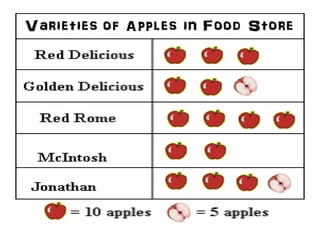
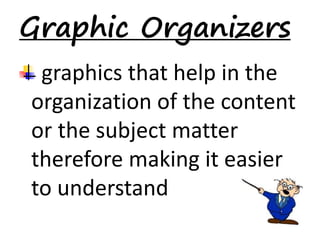


This document discusses the use of visual symbols in teaching, including different types of visual aids. It describes 7 categories of visual symbols: 1) drawings, 2) cartoons, 3) comic strips, 4) diagrams, 5) charts, 6) graphs, and 7) maps. Each category is explained and specific examples are provided, such as affinity diagrams, tree diagrams, fishbone diagrams, pie charts, bar graphs and physical, political, and economic maps. The document emphasizes that visual symbols can effectively summarize experiences and concepts, and are worth thousands of words.


