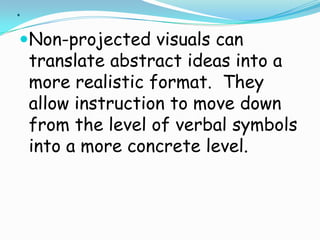
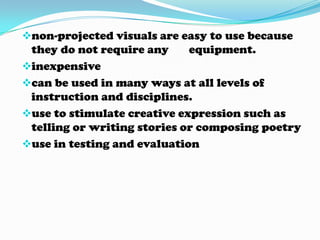
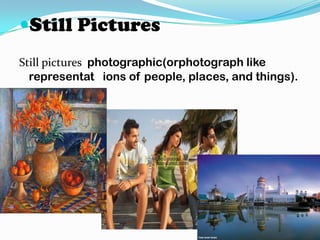
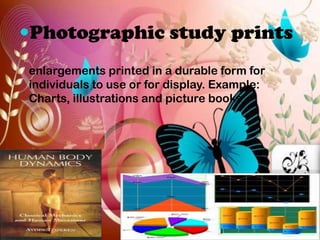
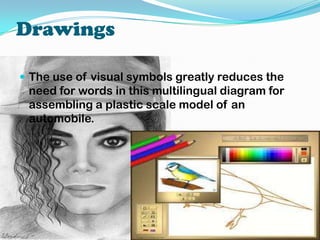
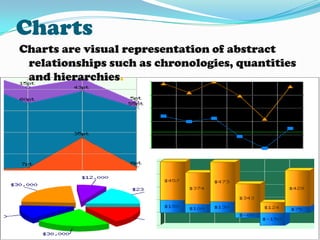
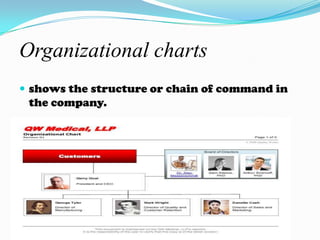
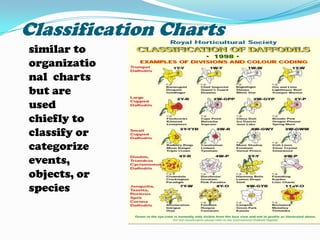
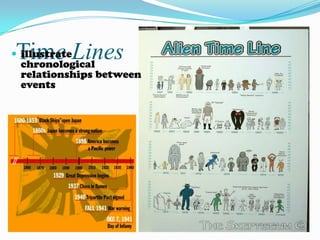
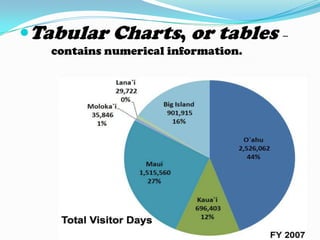
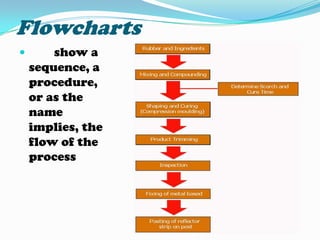
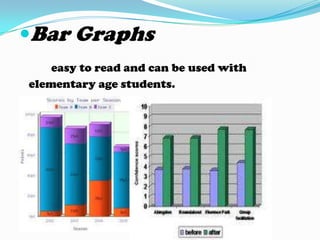
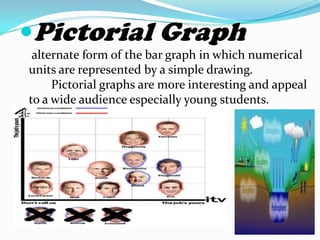
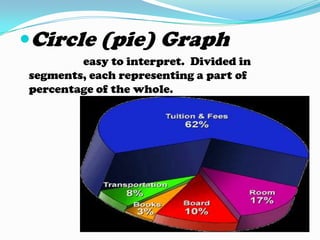
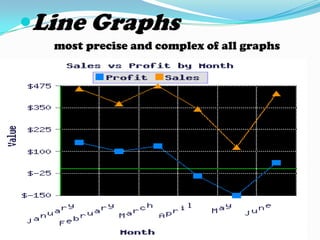
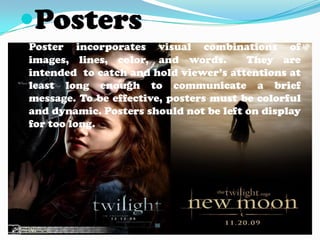
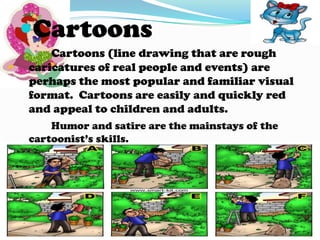
SlideShare a Scribd company logo
1 of 22
NON – PROJECTED  VISUAL
. Non-projected visuals can translate abstract ideas into a more realistic format.  They allow instruction to move down from the level of verbal symbols into a more concrete level.  
[object Object]
inexpensive
can be used in many ways at all levels of instruction and disciplines.
use to stimulate creative expression such as telling or writing stories or composing poetry
use in testing and evaluation,[object Object]
Still Pictures Still pictures  photographic(orphotograph like representat   ions of people, places, and things).
Photographic study prints  	enlargements printed in a durable form for individuals to use or for display. Example: Charts, illustrations and picture books
 Drawings	  The use of visual symbols greatly reduces the need for words in this multilingual diagram for assembling a plastic scale model of an automobile.
Charts							 Charts are visual representation of abstract relationships such as chronologies, quantities and hierarchies.
TYPES OF CHART
Organizational charts shows the structure or chain of command in the company.
 Classification Charts 	similar to organizational  charts but are used   chiefly to classify or categorize events, objects, or species
Time Lines 	 illustrate chronological relationships between events
Tabular Charts, or tables–	contains numerical information.
Flowcharts show a sequence, a procedure, or as the name implies, the flow of the process
Graphs   		Graph provides a visual representation of numerical data.  They also illustrate relationships among units of the data and trends in the data.     		Data can be interpreted more quickly in graph form than in tabular form.  Graphs are also more visually interesting than tables.    
Types of Graphs
Bar Graphs easy to read and can be used with elementary age students.
Pictorial Graph alternate form of the bar graph in which numerical units are represented by a simple drawing.   	Pictorial graphs are more interesting and appeal to a wide audience especially young students.
Circle (pie) Graph 			easy to interpret.  Divided in segments, each representing a part of percentage of the whole.

More Related Content

What's hot (20)

Projected teaching aids
Projected teaching aidsProjected teaching aids
Projected teaching aids
 
The Bulletin Board
The Bulletin BoardThe Bulletin Board
The Bulletin Board
 
Non projected pictures
Non projected picturesNon projected pictures
Non projected pictures
 
Demonstration seminar
Demonstration seminarDemonstration seminar
Demonstration seminar
 
Projected Aids - AV Aids
Projected Aids - AV AidsProjected Aids - AV Aids
Projected Aids - AV Aids
 
Flash card & flip chart
Flash card & flip chartFlash card & flip chart
Flash card & flip chart
 
Printed aids
Printed aidsPrinted aids
Printed aids
 
Audio visual aids in Education
Audio  visual aids in EducationAudio  visual aids in Education
Audio visual aids in Education
 
Graphic aids
Graphic aidsGraphic aids
Graphic aids
 
Cartoon
CartoonCartoon
Cartoon
 
Flip Charts
Flip ChartsFlip Charts
Flip Charts
 
Graphic aids
Graphic aidsGraphic aids
Graphic aids
 
Film strip ok
Film strip okFilm strip ok
Film strip ok
 
Instructional Media
Instructional MediaInstructional Media
Instructional Media
 
Projected and non projected aids.docx
Projected and non projected aids.docxProjected and non projected aids.docx
Projected and non projected aids.docx
 
Chalkboard
ChalkboardChalkboard
Chalkboard
 
A.v. aids education
A.v. aids  educationA.v. aids  education
A.v. aids education
 
Projected aids
Projected aidsProjected aids
Projected aids
 
Lesson 10: Projected Media
Lesson 10: Projected MediaLesson 10: Projected Media
Lesson 10: Projected Media
 
Film strips
Film stripsFilm strips
Film strips
 

Similar to Non – projected

Visual Symbol Presentation
Visual Symbol PresentationVisual Symbol Presentation
Visual Symbol PresentationRachel Villegas
 
Educational technology(report) ricalyn
Educational technology(report) ricalynEducational technology(report) ricalyn
Educational technology(report) ricalynricalynbells
 
Educational technology
Educational technologyEducational technology
Educational technologyricalynobal
 
Visual Presentations and Graphical Data
Visual Presentations and Graphical DataVisual Presentations and Graphical Data
Visual Presentations and Graphical DataRishi Taparia
 
Graphic inquiry
Graphic inquiryGraphic inquiry
Graphic inquiryJenn Alevy
 
using visual and symbols for teaching
using visual and symbols for teachingusing visual and symbols for teaching
using visual and symbols for teachingalexanderminoza
 
Teaching with Visual Symbol.pptx
Teaching with Visual Symbol.pptxTeaching with Visual Symbol.pptx
Teaching with Visual Symbol.pptxJohnReySRSoverano
 
charts.docx
charts.docxcharts.docx
charts.docxRajani17
 
Visual symbols by: Mary Joice T. De Jesus
Visual symbols by: Mary Joice T. De JesusVisual symbols by: Mary Joice T. De Jesus
Visual symbols by: Mary Joice T. De Jesusmary joice de jesus
 
Visual symbols by: Mary Joice T. De Jesus
Visual symbols  by: Mary Joice T. De JesusVisual symbols  by: Mary Joice T. De Jesus
Visual symbols by: Mary Joice T. De Jesusmary joice de jesus
 
Audio visual aids or Instructional aids
Audio visual aids or Instructional aidsAudio visual aids or Instructional aids
Audio visual aids or Instructional aids1302011987
 
Educational Technology 1 Graphic Materials
Educational Technology 1 Graphic Materials Educational Technology 1 Graphic Materials
Educational Technology 1 Graphic Materials Joyce
 

Similar to Non – projected (20)

Visual Symbol Presentation
Visual Symbol PresentationVisual Symbol Presentation
Visual Symbol Presentation
 
Graphic materials
Graphic materialsGraphic materials
Graphic materials
 
Diagram
DiagramDiagram
Diagram
 
teaching visual symbols
teaching visual symbolsteaching visual symbols
teaching visual symbols
 
Educational technology(report) ricalyn
Educational technology(report) ricalynEducational technology(report) ricalyn
Educational technology(report) ricalyn
 
Educational technology
Educational technologyEducational technology
Educational technology
 
Visual Presentations and Graphical Data
Visual Presentations and Graphical DataVisual Presentations and Graphical Data
Visual Presentations and Graphical Data
 
Graphic inquiry
Graphic inquiryGraphic inquiry
Graphic inquiry
 
using visual and symbols for teaching
using visual and symbols for teachingusing visual and symbols for teaching
using visual and symbols for teaching
 
Teaching with Visual Symbol.pptx
Teaching with Visual Symbol.pptxTeaching with Visual Symbol.pptx
Teaching with Visual Symbol.pptx
 
Hairo capitulo
Hairo capituloHairo capitulo
Hairo capitulo
 
seminar
seminarseminar
seminar
 
Visual symbols
Visual symbolsVisual symbols
Visual symbols
 
Lesson 13
Lesson 13Lesson 13
Lesson 13
 
charts.docx
charts.docxcharts.docx
charts.docx
 
Visual symbols by: Mary Joice T. De Jesus
Visual symbols by: Mary Joice T. De JesusVisual symbols by: Mary Joice T. De Jesus
Visual symbols by: Mary Joice T. De Jesus
 
Visual symbols by: Mary Joice T. De Jesus
Visual symbols  by: Mary Joice T. De JesusVisual symbols  by: Mary Joice T. De Jesus
Visual symbols by: Mary Joice T. De Jesus
 
Audio visual aids or Instructional aids
Audio visual aids or Instructional aidsAudio visual aids or Instructional aids
Audio visual aids or Instructional aids
 
Educational Technology 1 Graphic Materials
Educational Technology 1 Graphic Materials Educational Technology 1 Graphic Materials
Educational Technology 1 Graphic Materials
 
Visual symbols
Visual symbolsVisual symbols
Visual symbols
 

More from cheryl_tayco

More from cheryl_tayco (6)

Game
GameGame
Game
 
Game
GameGame
Game
 
Game
GameGame
Game
 
Non – projected
Non – projectedNon – projected
Non – projected
 
Non – projected
Non – projectedNon – projected
Non – projected
 
I objective
I  objectiveI  objective
I objective
 

Recently uploaded

Beyond Boundaries: Leveraging No-Code Solutions for Industry Innovation
Beyond Boundaries: Leveraging No-Code Solutions for Industry InnovationBeyond Boundaries: Leveraging No-Code Solutions for Industry Innovation
Beyond Boundaries: Leveraging No-Code Solutions for Industry InnovationSafe Software
 
CloudStudio User manual (basic edition):
CloudStudio User manual (basic edition):CloudStudio User manual (basic edition):
CloudStudio User manual (basic edition):comworks
 
Automating Business Process via MuleSoft Composer | Bangalore MuleSoft Meetup...
Automating Business Process via MuleSoft Composer | Bangalore MuleSoft Meetup...Automating Business Process via MuleSoft Composer | Bangalore MuleSoft Meetup...
Automating Business Process via MuleSoft Composer | Bangalore MuleSoft Meetup...shyamraj55
 
WhatsApp 9892124323 ✓Call Girls In Kalyan ( Mumbai ) secure service
WhatsApp 9892124323 ✓Call Girls In Kalyan ( Mumbai ) secure serviceWhatsApp 9892124323 ✓Call Girls In Kalyan ( Mumbai ) secure service
WhatsApp 9892124323 ✓Call Girls In Kalyan ( Mumbai ) secure servicePooja Nehwal
 
Key Features Of Token Development (1).pptx
Key  Features Of Token  Development (1).pptxKey  Features Of Token  Development (1).pptx
Key Features Of Token Development (1).pptxLBM Solutions
 
Install Stable Diffusion in windows machine
Install Stable Diffusion in windows machineInstall Stable Diffusion in windows machine
Install Stable Diffusion in windows machinePadma Pradeep
 
Human Factors of XR: Using Human Factors to Design XR Systems
Human Factors of XR: Using Human Factors to Design XR SystemsHuman Factors of XR: Using Human Factors to Design XR Systems
Human Factors of XR: Using Human Factors to Design XR SystemsMark Billinghurst
 
Presentation on how to chat with PDF using ChatGPT code interpreter
Presentation on how to chat with PDF using ChatGPT code interpreterPresentation on how to chat with PDF using ChatGPT code interpreter
Presentation on how to chat with PDF using ChatGPT code interpreternaman860154
 
Transforming Data Streams with Kafka Connect: An Introduction to Single Messa...
Transforming Data Streams with Kafka Connect: An Introduction to Single Messa...Transforming Data Streams with Kafka Connect: An Introduction to Single Messa...
Transforming Data Streams with Kafka Connect: An Introduction to Single Messa...HostedbyConfluent
 
08448380779 Call Girls In Friends Colony Women Seeking Men
08448380779 Call Girls In Friends Colony Women Seeking Men08448380779 Call Girls In Friends Colony Women Seeking Men
08448380779 Call Girls In Friends Colony Women Seeking MenDelhi Call girls
 
Azure Monitor & Application Insight to monitor Infrastructure & Application
Azure Monitor & Application Insight to monitor Infrastructure & ApplicationAzure Monitor & Application Insight to monitor Infrastructure & Application
Azure Monitor & Application Insight to monitor Infrastructure & ApplicationAndikSusilo4
 
Unblocking The Main Thread Solving ANRs and Frozen Frames
Unblocking The Main Thread Solving ANRs and Frozen FramesUnblocking The Main Thread Solving ANRs and Frozen Frames
Unblocking The Main Thread Solving ANRs and Frozen FramesSinan KOZAK
 
Maximizing Board Effectiveness 2024 Webinar.pptx
Maximizing Board Effectiveness 2024 Webinar.pptxMaximizing Board Effectiveness 2024 Webinar.pptx
Maximizing Board Effectiveness 2024 Webinar.pptxOnBoard
 
GenCyber Cyber Security Day Presentation
GenCyber Cyber Security Day PresentationGenCyber Cyber Security Day Presentation
GenCyber Cyber Security Day PresentationMichael W. Hawkins
 
#StandardsGoals for 2024: What’s new for BISAC - Tech Forum 2024
#StandardsGoals for 2024: What’s new for BISAC - Tech Forum 2024#StandardsGoals for 2024: What’s new for BISAC - Tech Forum 2024
#StandardsGoals for 2024: What’s new for BISAC - Tech Forum 2024BookNet Canada
 
Benefits Of Flutter Compared To Other Frameworks
Benefits Of Flutter Compared To Other FrameworksBenefits Of Flutter Compared To Other Frameworks
Benefits Of Flutter Compared To Other FrameworksSoftradix Technologies
 
Slack Application Development 101 Slides
Slack Application Development 101 SlidesSlack Application Development 101 Slides
Slack Application Development 101 Slidespraypatel2
 
SIEMENS: RAPUNZEL – A Tale About Knowledge Graph
SIEMENS: RAPUNZEL – A Tale About Knowledge GraphSIEMENS: RAPUNZEL – A Tale About Knowledge Graph
SIEMENS: RAPUNZEL – A Tale About Knowledge GraphNeo4j
 
Tech-Forward - Achieving Business Readiness For Copilot in Microsoft 365
Tech-Forward - Achieving Business Readiness For Copilot in Microsoft 365Tech-Forward - Achieving Business Readiness For Copilot in Microsoft 365
Tech-Forward - Achieving Business Readiness For Copilot in Microsoft 3652toLead Limited
 

Recently uploaded (20)

Beyond Boundaries: Leveraging No-Code Solutions for Industry Innovation
Beyond Boundaries: Leveraging No-Code Solutions for Industry InnovationBeyond Boundaries: Leveraging No-Code Solutions for Industry Innovation
Beyond Boundaries: Leveraging No-Code Solutions for Industry Innovation
 
CloudStudio User manual (basic edition):
CloudStudio User manual (basic edition):CloudStudio User manual (basic edition):
CloudStudio User manual (basic edition):
 
Automating Business Process via MuleSoft Composer | Bangalore MuleSoft Meetup...
Automating Business Process via MuleSoft Composer | Bangalore MuleSoft Meetup...Automating Business Process via MuleSoft Composer | Bangalore MuleSoft Meetup...
Automating Business Process via MuleSoft Composer | Bangalore MuleSoft Meetup...
 
Vulnerability_Management_GRC_by Sohang Sengupta.pptx
Vulnerability_Management_GRC_by Sohang Sengupta.pptxVulnerability_Management_GRC_by Sohang Sengupta.pptx
Vulnerability_Management_GRC_by Sohang Sengupta.pptx
 
WhatsApp 9892124323 ✓Call Girls In Kalyan ( Mumbai ) secure service
WhatsApp 9892124323 ✓Call Girls In Kalyan ( Mumbai ) secure serviceWhatsApp 9892124323 ✓Call Girls In Kalyan ( Mumbai ) secure service
WhatsApp 9892124323 ✓Call Girls In Kalyan ( Mumbai ) secure service
 
Key Features Of Token Development (1).pptx
Key  Features Of Token  Development (1).pptxKey  Features Of Token  Development (1).pptx
Key Features Of Token Development (1).pptx
 
Install Stable Diffusion in windows machine
Install Stable Diffusion in windows machineInstall Stable Diffusion in windows machine
Install Stable Diffusion in windows machine
 
Human Factors of XR: Using Human Factors to Design XR Systems
Human Factors of XR: Using Human Factors to Design XR SystemsHuman Factors of XR: Using Human Factors to Design XR Systems
Human Factors of XR: Using Human Factors to Design XR Systems
 
Presentation on how to chat with PDF using ChatGPT code interpreter
Presentation on how to chat with PDF using ChatGPT code interpreterPresentation on how to chat with PDF using ChatGPT code interpreter
Presentation on how to chat with PDF using ChatGPT code interpreter
 
Transforming Data Streams with Kafka Connect: An Introduction to Single Messa...
Transforming Data Streams with Kafka Connect: An Introduction to Single Messa...Transforming Data Streams with Kafka Connect: An Introduction to Single Messa...
Transforming Data Streams with Kafka Connect: An Introduction to Single Messa...
 
08448380779 Call Girls In Friends Colony Women Seeking Men
08448380779 Call Girls In Friends Colony Women Seeking Men08448380779 Call Girls In Friends Colony Women Seeking Men
08448380779 Call Girls In Friends Colony Women Seeking Men
 
Azure Monitor & Application Insight to monitor Infrastructure & Application
Azure Monitor & Application Insight to monitor Infrastructure & ApplicationAzure Monitor & Application Insight to monitor Infrastructure & Application
Azure Monitor & Application Insight to monitor Infrastructure & Application
 
Unblocking The Main Thread Solving ANRs and Frozen Frames
Unblocking The Main Thread Solving ANRs and Frozen FramesUnblocking The Main Thread Solving ANRs and Frozen Frames
Unblocking The Main Thread Solving ANRs and Frozen Frames
 
Maximizing Board Effectiveness 2024 Webinar.pptx
Maximizing Board Effectiveness 2024 Webinar.pptxMaximizing Board Effectiveness 2024 Webinar.pptx
Maximizing Board Effectiveness 2024 Webinar.pptx
 
GenCyber Cyber Security Day Presentation
GenCyber Cyber Security Day PresentationGenCyber Cyber Security Day Presentation
GenCyber Cyber Security Day Presentation
 
#StandardsGoals for 2024: What’s new for BISAC - Tech Forum 2024
#StandardsGoals for 2024: What’s new for BISAC - Tech Forum 2024#StandardsGoals for 2024: What’s new for BISAC - Tech Forum 2024
#StandardsGoals for 2024: What’s new for BISAC - Tech Forum 2024
 
Benefits Of Flutter Compared To Other Frameworks
Benefits Of Flutter Compared To Other FrameworksBenefits Of Flutter Compared To Other Frameworks
Benefits Of Flutter Compared To Other Frameworks
 
Slack Application Development 101 Slides
Slack Application Development 101 SlidesSlack Application Development 101 Slides
Slack Application Development 101 Slides
 
SIEMENS: RAPUNZEL – A Tale About Knowledge Graph
SIEMENS: RAPUNZEL – A Tale About Knowledge GraphSIEMENS: RAPUNZEL – A Tale About Knowledge Graph
SIEMENS: RAPUNZEL – A Tale About Knowledge Graph
 
Tech-Forward - Achieving Business Readiness For Copilot in Microsoft 365
Tech-Forward - Achieving Business Readiness For Copilot in Microsoft 365Tech-Forward - Achieving Business Readiness For Copilot in Microsoft 365
Tech-Forward - Achieving Business Readiness For Copilot in Microsoft 365
 

Non – projected

  • 2. . Non-projected visuals can translate abstract ideas into a more realistic format. They allow instruction to move down from the level of verbal symbols into a more concrete level.  
  • 3.
  • 5. can be used in many ways at all levels of instruction and disciplines.
  • 6. use to stimulate creative expression such as telling or writing stories or composing poetry
  • 7.
  • 8. Still Pictures Still pictures photographic(orphotograph like representat ions of people, places, and things).
  • 9. Photographic study prints enlargements printed in a durable form for individuals to use or for display. Example: Charts, illustrations and picture books
  • 10.  Drawings   The use of visual symbols greatly reduces the need for words in this multilingual diagram for assembling a plastic scale model of an automobile.
  • 11. Charts Charts are visual representation of abstract relationships such as chronologies, quantities and hierarchies.
  • 13. Organizational charts shows the structure or chain of command in the company.
  • 14. Classification Charts similar to organizational charts but are used chiefly to classify or categorize events, objects, or species
  • 15. Time Lines illustrate chronological relationships between events
  • 16. Tabular Charts, or tables– contains numerical information.
  • 17. Flowcharts show a sequence, a procedure, or as the name implies, the flow of the process
  • 18. Graphs   Graph provides a visual representation of numerical data. They also illustrate relationships among units of the data and trends in the data.   Data can be interpreted more quickly in graph form than in tabular form. Graphs are also more visually interesting than tables.    
  • 20. Bar Graphs easy to read and can be used with elementary age students.
  • 21. Pictorial Graph alternate form of the bar graph in which numerical units are represented by a simple drawing. Pictorial graphs are more interesting and appeal to a wide audience especially young students.
  • 22. Circle (pie) Graph easy to interpret. Divided in segments, each representing a part of percentage of the whole.
  • 23. Line Graphs most precise and complex of all graphs
  • 24. Posters Poster incorporates visual combinations of images, lines, color, and words. They are intended to catch and hold viewer’s attentions at least long enough to communicate a brief message. To be effective, posters must be colorful and dynamic. Posters should not be left on display for too long.
  • 25. Cartoons   Cartoons (line drawing that are rough caricatures of real people and events) are perhaps the most popular and familiar visual format. Cartoons are easily and quickly red and appeal to children and adults.   Humor and satire are the mainstays of the cartoonist’s skills.