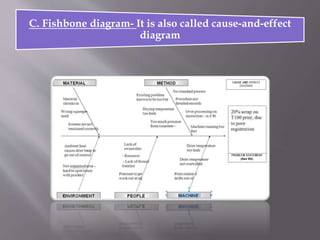
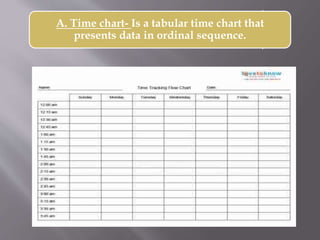
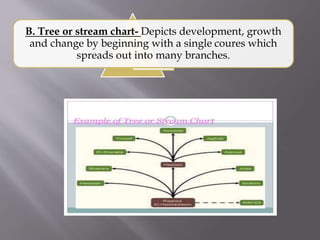
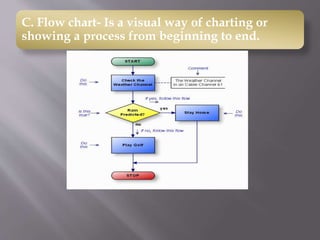
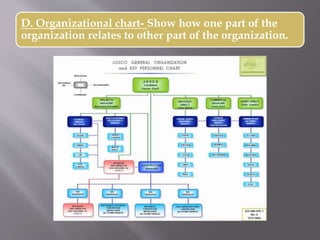
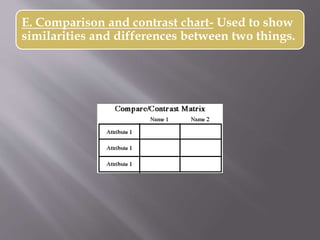
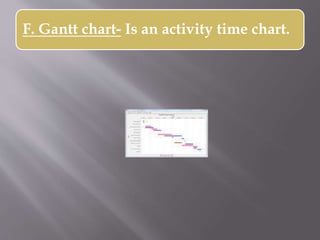
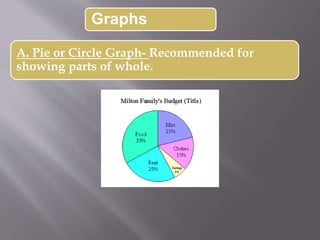
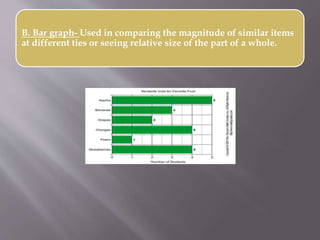
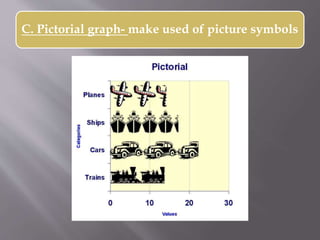
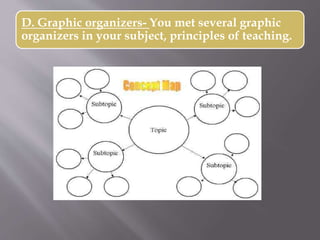
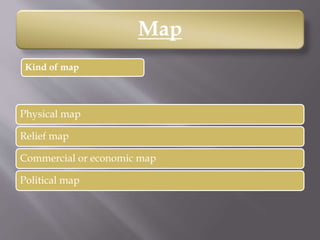
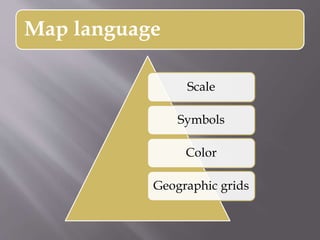
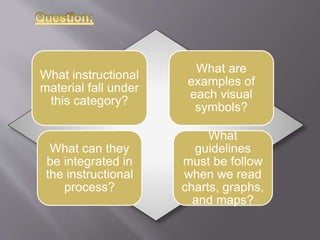
Are representations of direct reality,
which comes in the form of signs and
symbols. The following is a detailed
discussion on the different kinds of visual
symbols which are drawing, cartoon, strip
drawing, diagram, chart, graph, map.
1. DRAWING- A drawing may not be the real
thing but better to have a concrete visual aid than
nothing. To avoid conclusion, it is good that our
drawing correctly represents the real thing.
2. CARTOON- Another useful symbols that can bring
novelty to our teaching is the cartoon. The perfect
cartoon needs no caption
3. STRIP DRAWING- These are commonly called comics
or comic strip. Make use of strips that are educational and
entertaining at the same time
4. DIAGRAM- It is any line drawing
that shows arrangement and relations as
of parts to the whole, relative values,
origins and development, chronological
fluctuations, distribution, etc.
Types of diagram
A. Affinity diagram- Used to cluster complex
apparently unrelated data into natural and
meaningful groups.
B. Tree diagram- Used to chart out, in increasing
detail, the various tasks that must be accomplished to
complete a project or achieve a specific objective.
C. Fishbone diagram- It is also called cause-and-effect
diagram
A. Time chart- Is a tabular time chart that
presents data in ordinal sequence.
B. Tree or stream chart- Depicts development, growth
and change by beginning with a single coures which
spreads out into many branches.
C. Flow chart- Is a visual way of charting or
showing a process from beginning to end.
D. Organizational chart- Show how one part of the
organization relates to other part of the organization.
E. Comparison and contrast chart- Used to show
similarities and differences between two things.
E. Pareto chart- Is a type of bar chart, prioritized in descending
order of magnitude or importance from left to right.
F. Gantt chart- Is an activity time chart.
A. Pie or Circle Graph- Recommended for
showing parts of whole.
Graphs
B. Bar graph- Used in comparing the magnitude of similar items
at different ties or seeing relative size of the part of a whole.
C. Pictorial graph- make used of picture symbols
D. Graphic organizers- You met several graphic
organizers in your subject, principles of teaching.
Map
Physical map
Relief map
Commercial or economic map
Political map
Kind of map
Map language
Scale
Symbols
Color
Geographic grids
What instructional
material fall under
this category?
What are
examples of
each visual
symbols?
What can they
be integrated in
the instructional
process?
What
guidelines
must be follow
when we read
charts, graphs,
and maps?
Hairo N. Capitulo
2BEED- 2A
(Student)
Jaydee S. De leon
(teacher)

Hairo capitulo

  • 2.
    Are representations ofdirect reality, which comes in the form of signs and symbols. The following is a detailed discussion on the different kinds of visual symbols which are drawing, cartoon, strip drawing, diagram, chart, graph, map.
  • 3.
    1. DRAWING- Adrawing may not be the real thing but better to have a concrete visual aid than nothing. To avoid conclusion, it is good that our drawing correctly represents the real thing.
  • 4.
    2. CARTOON- Anotheruseful symbols that can bring novelty to our teaching is the cartoon. The perfect cartoon needs no caption
  • 5.
    3. STRIP DRAWING-These are commonly called comics or comic strip. Make use of strips that are educational and entertaining at the same time
  • 6.
    4. DIAGRAM- Itis any line drawing that shows arrangement and relations as of parts to the whole, relative values, origins and development, chronological fluctuations, distribution, etc.
  • 7.
    Types of diagram A.Affinity diagram- Used to cluster complex apparently unrelated data into natural and meaningful groups.
  • 8.
    B. Tree diagram-Used to chart out, in increasing detail, the various tasks that must be accomplished to complete a project or achieve a specific objective.
  • 9.
    C. Fishbone diagram-It is also called cause-and-effect diagram
  • 10.
    A. Time chart-Is a tabular time chart that presents data in ordinal sequence.
  • 11.
    B. Tree orstream chart- Depicts development, growth and change by beginning with a single coures which spreads out into many branches.
  • 12.
    C. Flow chart-Is a visual way of charting or showing a process from beginning to end.
  • 13.
    D. Organizational chart-Show how one part of the organization relates to other part of the organization.
  • 14.
    E. Comparison andcontrast chart- Used to show similarities and differences between two things.
  • 15.
    E. Pareto chart-Is a type of bar chart, prioritized in descending order of magnitude or importance from left to right.
  • 16.
    F. Gantt chart-Is an activity time chart.
  • 17.
    A. Pie orCircle Graph- Recommended for showing parts of whole. Graphs
  • 18.
    B. Bar graph-Used in comparing the magnitude of similar items at different ties or seeing relative size of the part of a whole.
  • 19.
    C. Pictorial graph-make used of picture symbols
  • 20.
    D. Graphic organizers-You met several graphic organizers in your subject, principles of teaching.
  • 21.
    Map Physical map Relief map Commercialor economic map Political map Kind of map
  • 22.
  • 23.
    What instructional material fallunder this category? What are examples of each visual symbols? What can they be integrated in the instructional process? What guidelines must be follow when we read charts, graphs, and maps?
  • 24.
    Hairo N. Capitulo 2BEED-2A (Student) Jaydee S. De leon (teacher)