Downloaded 314 times

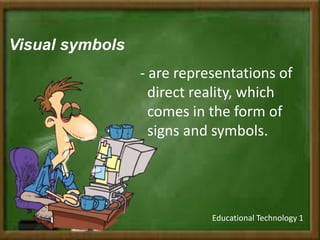
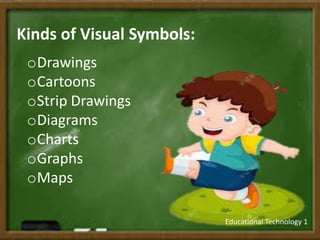


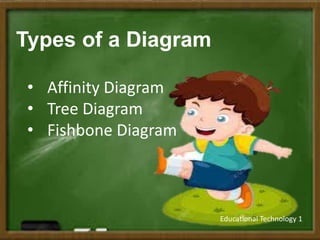
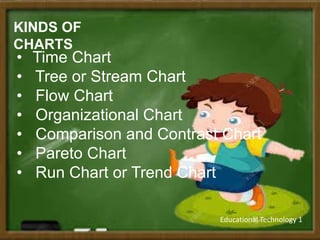


This document discusses different types of visual symbols that can be used for teaching, including drawings, cartoons, strip drawings, diagrams, charts, graphs, and maps. It provides examples and definitions for each type of visual symbol. The overall message is that visual symbols can effectively summarize experiences and lessons by representing complex information in a simple way.


![Teaching visual-symbols[1]](https://cdn.slidesharecdn.com/ss_thumbnails/teaching-visual-symbols1-150913025207-lva1-app6892-thumbnail.jpg?width=640&height=640&fit=bounds)


