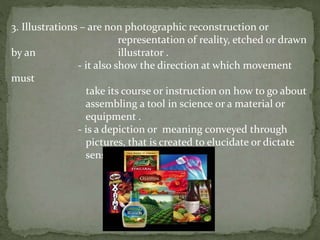
Download to read offline

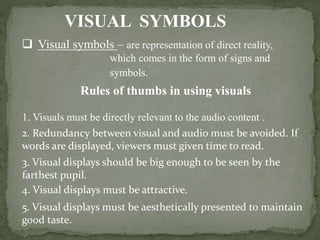
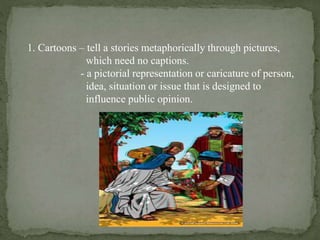


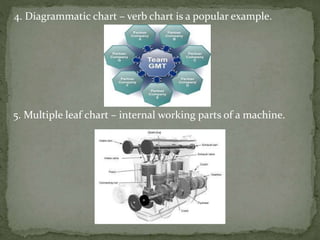


This document discusses different types of visual symbols that can be used for teaching, including their purposes and characteristics. It describes cartoons, photographs, illustrations, posters, drawings, diagrams, charts, graphs, strip drawings, and flashcards. For each type of visual symbol, the document provides examples and discusses how they can be used to concretize concepts, motivate students, and correct misconceptions. It also outlines best practices for creating and using different visual symbols, such as ensuring they are relevant, clear, and attractive to maintain students' attention.