Download to read offline


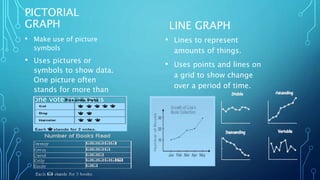


This document discusses various types of visual representations that can be used to communicate information beyond just stories. It describes graphs like pie graphs, bar graphs, pictorial graphs, and line graphs that represent data visually. It also discusses graphic organizers and different types of maps like physical maps, relief maps, economic maps, and political maps. The document provides examples of how each visual symbol can be used and emphasizes that these tools provide alternative ways to learn and teach information compared to just using text.


