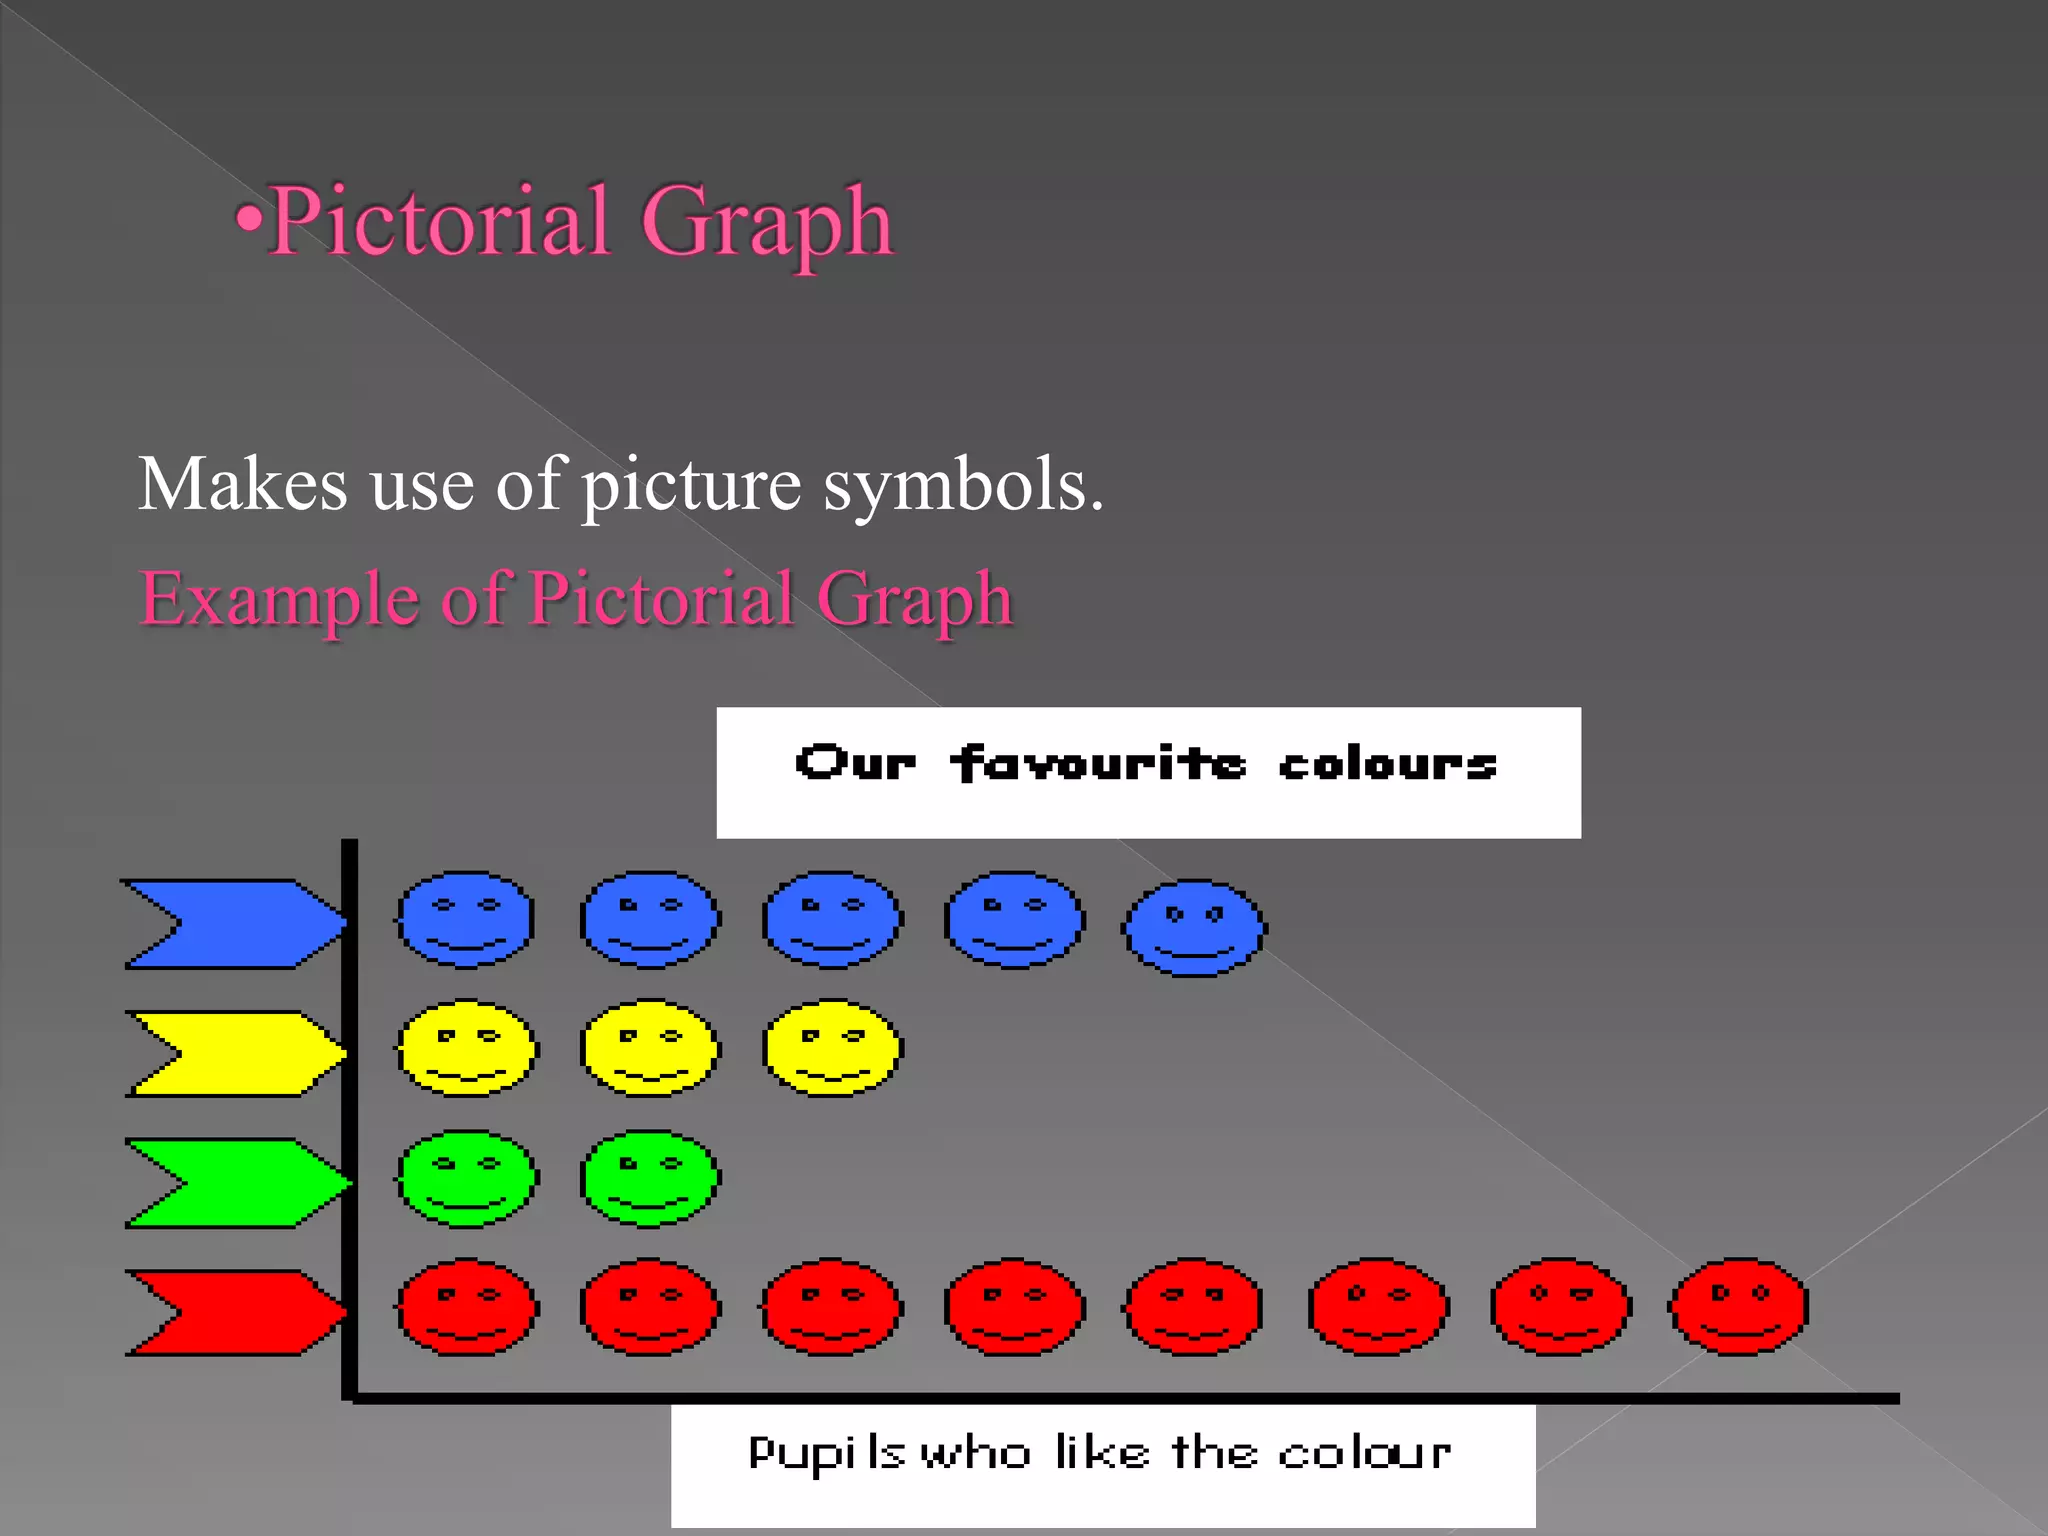
A visual symbol is a real experiences we
proceed to a world of symbol
1. Drawing
2. Cartoon
3. Strip Drawing
4. Diagram
5. Chart
6. Graph
7. Map
A drawing may not be a real thing but better to have a
concrete visual symbol
Example of Drawing
Another useful visual symbol that can be bring novelty
to our teaching .
Example of Cartoon
These are commonly called “comics or comic strip”
Example of Strip Drawing
A diagram is any line drawing that shows arrangement
and relations as of parts to the whole
Types of a Diagram
 Affinity Diagram
 Tree Diagram
 Fishbone Diagram
Used to cluster complex apparently unrelated data.
Example of Affinity Diagram
Used to chart out, in increasing detail .
Example of Tree Diagram
It is also called “cause and effect” Diagram. It is a
structure from brainstorming that graphically shows.
Example of Fishbone Diagram
A chart is a diagrammatic representation of relationships
among individual within an organization.
Example of Chart
 Time Chart
 Tree or Stream Chart
 Flow Chart
 Organizational Chart
 Comparison and Contrast Chart
 Pareto Chart
 Gannt Chart
Is a tabular time chart that present data in ordinal
sequence.
Example of Time Chart
It depicts development , growth and change by
beginning with a single course .
Example of Tree or Stream Chart
Is a visual way of charting or showing a process from
beginning to end. It is mean analyzing process.
Example of Flow Chart
Shows how one part of the organization relates to other
parts of the organization/
Example of Organizational Chart
Used to show similarities and differences between two
things.(people,ideas,etc.) key frame and question.
Example of Comparison and Contrast
Is a type of bar chart, prioritized in descending order of
magnitude or importance from left to right.
Example of Pareto Chart
Is an activity time chart.
Example of Gannt Chart
There are several types of graphs. They are:
 Circle or Pie Graph
 Bar Graph
 Pictorial Graph
 Line Graph
Recommended for showing parts as whole.
Example of Pie or Circle Graph
Used in comparing the magnitude of similar items at
different ties or seeing relative sizes of the part as
whole.
Example of Bar Graph
Makes use of picture symbols.
Example of Pictorial Graph
A map is a “representation of the surface of the earth or
some part of it.
Kinds of Map
 Physical Map
 Relief Map
 Commercial or Economic Map
 Political Map
Combines in a single projection data like altitude,
temperature, rainfall, precipitation, vegetation and
soil.
Example of Physical Map
Has three dimensional representations and shows
contours of the physical data of the earth.
Example of Relief Map
Also called product or industrial map since they show
land areas in relation to the economy.
Example of Commercial or Economic Map
Gives detail information about country, provinces,
cities and towns, and highways.
Example of Political Map
From an experiences of real-world experience we
proceed to a world of symbol. We don’t see real
things but symbols. Visual symbols include
drawings, cartoons, strip drawings, diagrams,
formulas, charts, graphs, maps and globe.
Class if you have a question ask me.
Thank you for Listening   
I hope you’ll enjoy 
God blessed

Visual symbols

  • 2.
    A visual symbolis a real experiences we proceed to a world of symbol
  • 3.
    1. Drawing 2. Cartoon 3.Strip Drawing 4. Diagram 5. Chart 6. Graph 7. Map
  • 4.
    A drawing maynot be a real thing but better to have a concrete visual symbol Example of Drawing
  • 5.
    Another useful visualsymbol that can be bring novelty to our teaching . Example of Cartoon
  • 6.
    These are commonlycalled “comics or comic strip” Example of Strip Drawing
  • 7.
    A diagram isany line drawing that shows arrangement and relations as of parts to the whole Types of a Diagram  Affinity Diagram  Tree Diagram  Fishbone Diagram
  • 8.
    Used to clustercomplex apparently unrelated data. Example of Affinity Diagram
  • 9.
    Used to chartout, in increasing detail . Example of Tree Diagram
  • 10.
    It is alsocalled “cause and effect” Diagram. It is a structure from brainstorming that graphically shows. Example of Fishbone Diagram
  • 11.
    A chart isa diagrammatic representation of relationships among individual within an organization. Example of Chart  Time Chart  Tree or Stream Chart  Flow Chart  Organizational Chart  Comparison and Contrast Chart  Pareto Chart  Gannt Chart
  • 12.
    Is a tabulartime chart that present data in ordinal sequence. Example of Time Chart
  • 13.
    It depicts development, growth and change by beginning with a single course . Example of Tree or Stream Chart
  • 14.
    Is a visualway of charting or showing a process from beginning to end. It is mean analyzing process. Example of Flow Chart
  • 15.
    Shows how onepart of the organization relates to other parts of the organization/ Example of Organizational Chart
  • 16.
    Used to showsimilarities and differences between two things.(people,ideas,etc.) key frame and question. Example of Comparison and Contrast
  • 17.
    Is a typeof bar chart, prioritized in descending order of magnitude or importance from left to right. Example of Pareto Chart
  • 18.
    Is an activitytime chart. Example of Gannt Chart
  • 19.
    There are severaltypes of graphs. They are:  Circle or Pie Graph  Bar Graph  Pictorial Graph  Line Graph
  • 20.
    Recommended for showingparts as whole. Example of Pie or Circle Graph
  • 21.
    Used in comparingthe magnitude of similar items at different ties or seeing relative sizes of the part as whole. Example of Bar Graph
  • 22.
    Makes use ofpicture symbols. Example of Pictorial Graph
  • 23.
    A map isa “representation of the surface of the earth or some part of it. Kinds of Map  Physical Map  Relief Map  Commercial or Economic Map  Political Map
  • 24.
    Combines in asingle projection data like altitude, temperature, rainfall, precipitation, vegetation and soil. Example of Physical Map
  • 25.
    Has three dimensionalrepresentations and shows contours of the physical data of the earth. Example of Relief Map
  • 26.
    Also called productor industrial map since they show land areas in relation to the economy. Example of Commercial or Economic Map
  • 27.
    Gives detail informationabout country, provinces, cities and towns, and highways. Example of Political Map
  • 28.
    From an experiencesof real-world experience we proceed to a world of symbol. We don’t see real things but symbols. Visual symbols include drawings, cartoons, strip drawings, diagrams, formulas, charts, graphs, maps and globe.
  • 29.
    Class if youhave a question ask me.
  • 30.
    Thank you forListening    I hope you’ll enjoy  God blessed