Downloaded 168 times

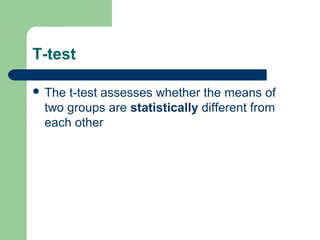
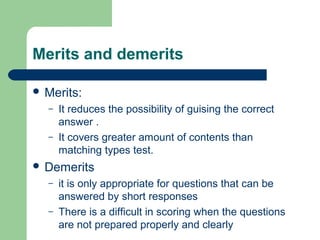
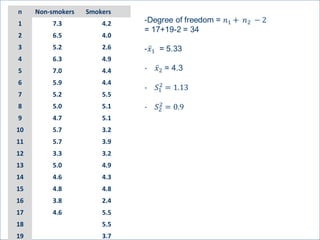
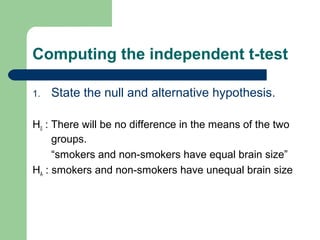
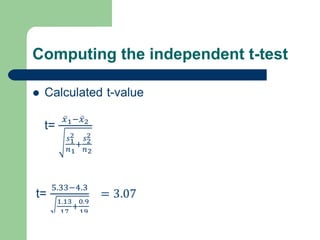
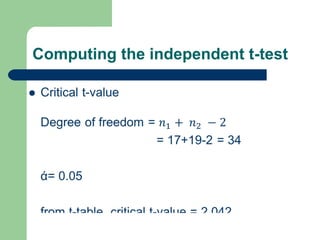
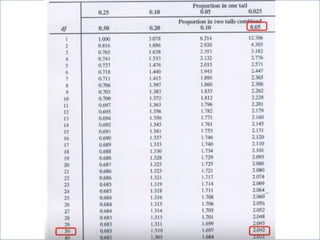
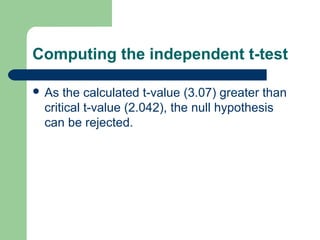
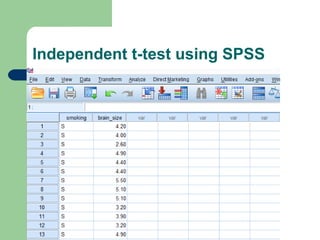
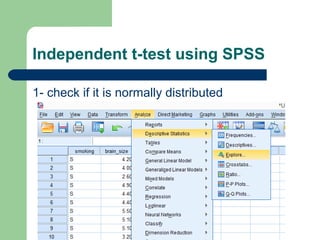
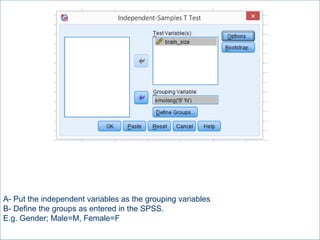
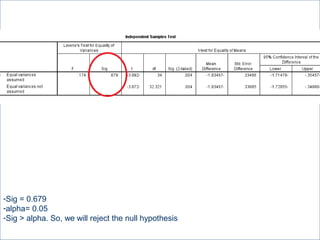
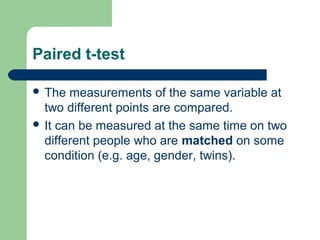
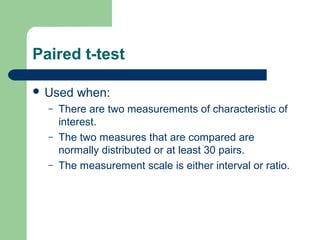
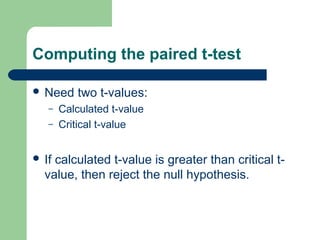
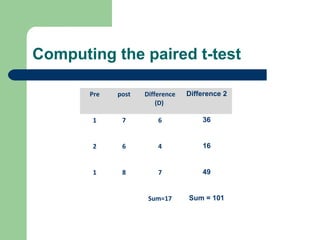
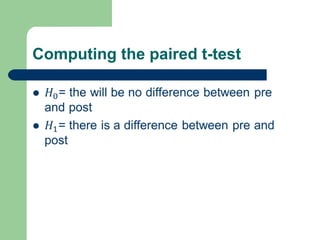
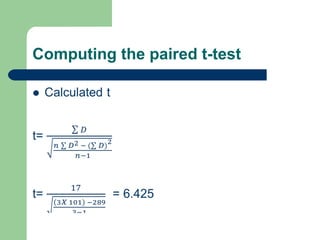
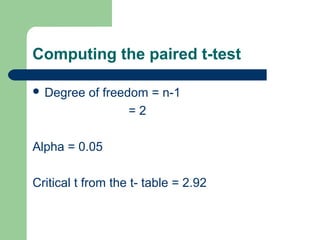
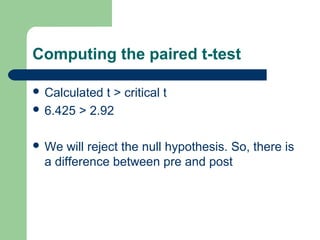
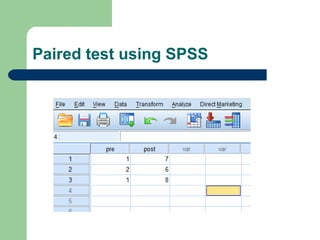
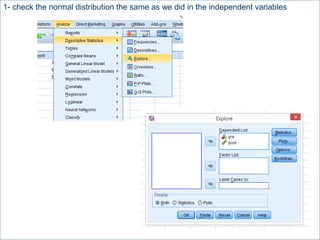
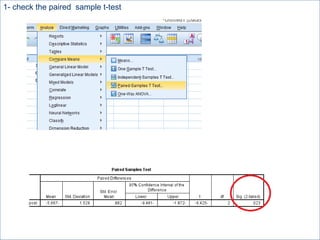
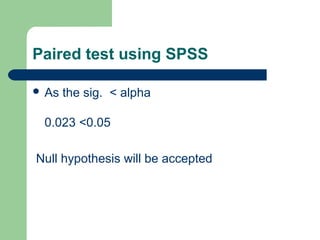
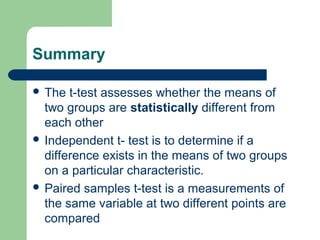
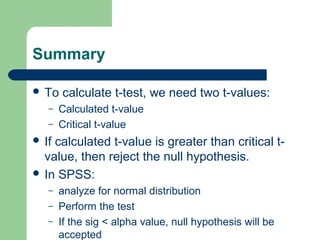

This document summarizes a seminar on independent and paired t-tests. The t-test assesses whether the means of two groups are statistically different. An independent t-test is used to compare the means of two independent groups, while a paired t-test compares the means of the same variable measured at two different time points. Both tests calculate a critical t-value to compare to the calculated t-value to determine whether to reject the null hypothesis of no difference between the means. The document provides examples of performing independent and paired t-tests using formulas and the statistical software SPSS.


