Downloaded 118 times

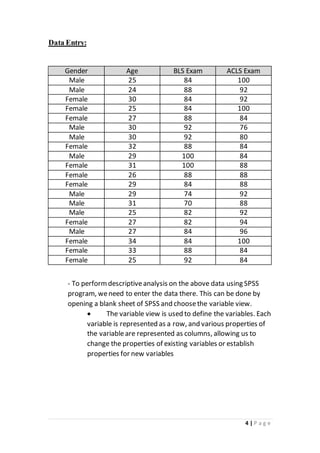


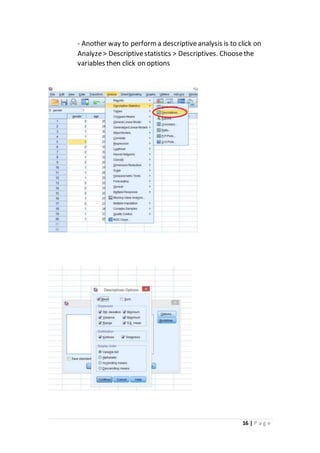
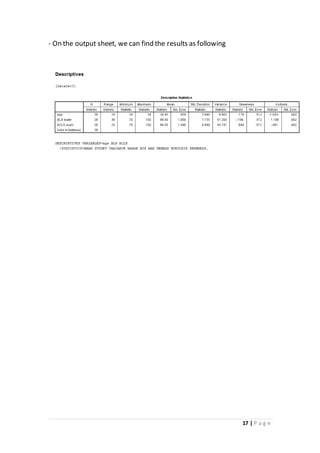
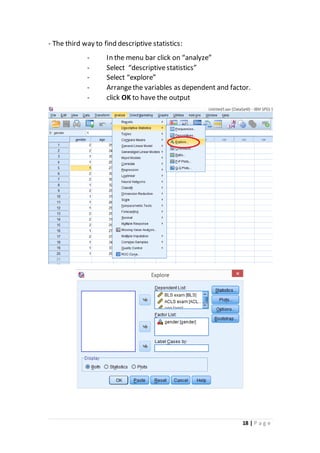
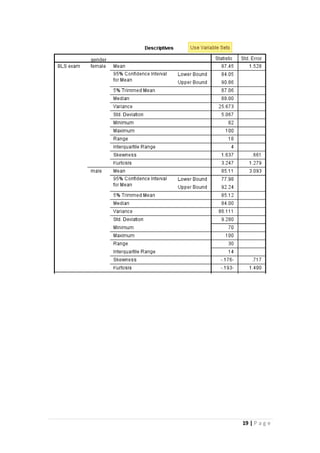

This document describes how to calculate descriptive statistics using SPSS. It discusses entering data into SPSS, calculating frequencies, means, medians, modes, standard deviations and other measures. It provides three methods for computing descriptive statistics in SPSS: frequencies analysis, descriptives analysis, and explore analysis. Finally, it demonstrates how to create graphs like histograms, bar charts and pie charts to represent the data visually. The overall purpose is to introduce the key concepts and applications of descriptive statistics using the SPSS software package.


![Polymer [ बहुलक ] Chemistry Notes PDF - Irfanullah Mehar - JJ Sir Chemistry.pdf](https://cdn.slidesharecdn.com/ss_thumbnails/polymerchemistrynotespdf-irfanullahmehar-jjsirchemistry-260210172118-3f9b37f7-thumbnail.jpg?width=640&height=640&fit=bounds)

