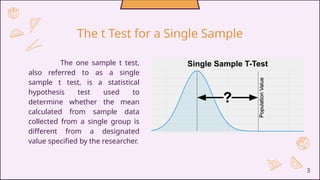
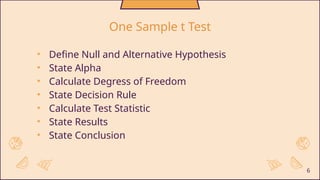
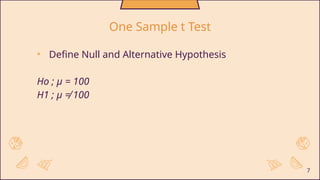
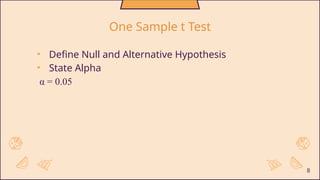
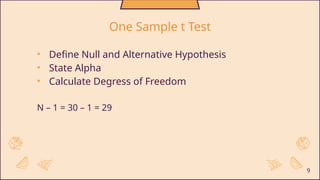
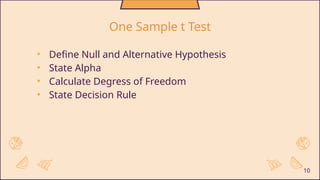
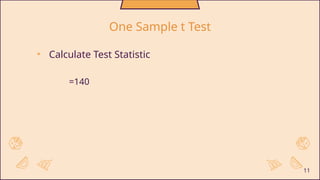
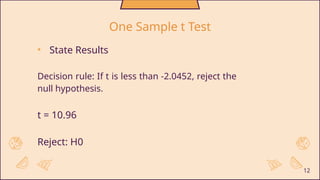
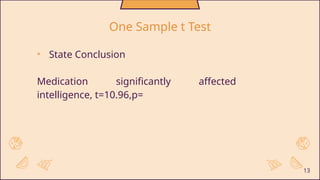
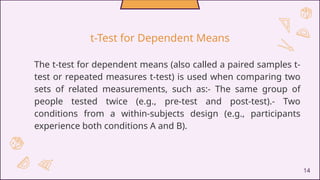
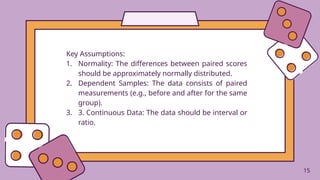
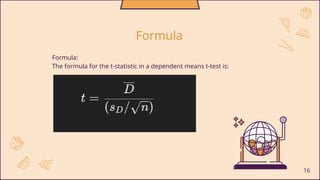
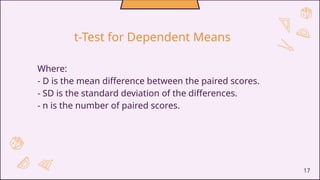
Psychological Statistics
INTRODUCTION
TO T-TESTS
GROUP 1
What is t Test?
A t-test (also known as Student's t-test) is a tool for evaluating
the means of one or two populations using hypothesis testing. A t-test
may be used to evaluate whether a single group differs from a known
value (a one-sample t-test), whether two groups differ from each other
(an independent two-sample t-test), or whether there is a significant
difference in paired measurements (a paired, or dependent samples t-
test).
The one sample t test,
also referred to as a single
sample t test, is a statistical
hypothesis test used to
determine whether the mean
calculated from sample data
collected from a single group is
different from a designated
value specified by the researcher.
3
The t Test for a Single Sample
4
One Sample t Test Assumptions
For a valid test, we need data values that are:
• Independent (values are not related to one another).
• Continuous.
• Obtained via a simple random sample from the population.
Also, the population is assumed to be normally distributed.
Example:
In the population, the average IQ is 100. A
team of scientists wants to test a new medication to
see if it has either a positive or negative effect on
intelligence or no effect at all. A sample of 30
participants who have taken the medication has a
mean of 140 with a standard deviation of 20. Did the
medication affect intelligence?
Alpha = 0.05
5
• Define Null and Alternative Hypothesis
• State Alpha
• Calculate Degress of Freedom
• State Decision Rule
• Calculate Test Statistic
• State Results
• State Conclusion
6
One Sample t Test
• Define Null and Alternative Hypothesis
Ho ; µ = 100
H1 ; µ ≠ 100
7
One Sample t Test
• Define Null and Alternative Hypothesis
• State Alpha
α = 0.05
8
One Sample t Test
• Define Null and Alternative Hypothesis
• State Alpha
• Calculate Degress of Freedom
N – 1 = 30 – 1 = 29
9
One Sample t Test
• Define Null and Alternative Hypothesis
• State Alpha
• Calculate Degress of Freedom
• State Decision Rule
10
One Sample t Test
• Calculate Test Statistic
=140
11
One Sample t Test
• State Results
Decision rule: If t is less than -2.0452, reject the
null hypothesis.
t = 10.96
Reject: H0
12
One Sample t Test
• State Conclusion
Medication significantly affected
intelligence, t=10.96,p=
13
One Sample t Test
The t-test for dependent means (also called a paired samples t-
test or repeated measures t-test) is used when comparing two
sets of related measurements, such as:- The same group of
people tested twice (e.g., pre-test and post-test).- Two
conditions from a within-subjects design (e.g., participants
experience both conditions A and B).
14
t-Test for Dependent Means
15
Key Assumptions:
1. Normality: The differences between paired scores
should be approximately normally distributed.
2. Dependent Samples: The data consists of paired
measurements (e.g., before and after for the same
group).
3. 3. Continuous Data: The data should be interval or
ratio.
15
16
Formula
Formula:
The formula for the t-statistic in a dependent means t-test is:
17
Where:
- D is the mean difference between the paired scores.
- SD is the standard deviation of the differences.
- n is the number of paired scores.
t-Test for Dependent Means
18
Steps to perform the t-test:
1. Calculate the differences between the paired measurements.
2. Compute the mean of the differences (D).
3. Find the standard deviation of the differences, (sD).
4. Plug the values into the formula and calculate the t-statistic.
5. Determine the degrees of freedom, (df = n - 1), where ( n ) is the
number of paired observations.
6. Compare the t-value to the critical value from the t-distribution table (or
use the p-value) to determine statistical significance.
19
Example of paired scores for dependent t-test:
Imagine a teacher wants to know if a new teaching method
improves student performance. She gives a group of 5
students a math test before and after using the new
method. In this example:
Student Pre-Test Post-Test Difference
(Post-Pre)
1 70 75
2 80 85
3 60 70
4 90 95
5 85 80
Effect Size
Tells you how meaningful the relationship
between variables or the difference
between group is. It indicates the practical
of a research outcome.
Effect Size Formula:
20
𝑀1 − 𝑀2
𝜎
21
The Distribution of Difference Between Means
difference between sample means from two
independent groups.
It’s the difference between the average (means) of two
groups.
22
Example: Group 1 has a mean score of 75, and Group 2
has a mean score of 85. The difference is 85 - 75 = 10.
What is the Difference Between Means?
23
Sample mean vs Population Mean
● Sample means are taken from subsets of the population.
● Example: Comparing the average scores of students from two
different schools.
• It’s the distribution of all possible differences between two sample
means.
Sampling Distribution of the Difference Between
Means
24
Formula for Difference Between Means
● Formula
Difference =
Where:
● = Mean of sample 1
25
Standard Error of the Difference
Formula:
SE
Where:
• , = variances of the two samples
• = sample sizes
26
Hypothesis Testing Example
Null Hypothesis : No difference between the means
Alternative Hypothesis
Example:
Group 1: Mean = 100, SD = 10, n = 30
Group 2: Mean = 95, SD = 12, n = 30
Calculate the Difference between means and test for significance.
27
• The t-test for independent means compares the difference
between two independent sample means to an expectation about
the difference in the population.
• The Independent Samples t Test can only compare the means for
two (and only two) groups.
• It cannot make comparisons among more than two groups.
• The t-test for independent means requires that there is no
overlap between the two groups in the research design.
HYPOTHESIS TESTING WITH THE T-TEST
FOR INDEPENDENT MEANS
The Independent Samples t Test is commonly used
to test the following:
•Statistical differences between the means of two
groups
•Statistical differences between the means of two
interventions
•Statistical differences between the means of two
change scores
28
Assumptions of the t-Test for
Independent Means
1. Data are Numeric
2. Independence of Observation
3. Normality
4. Equal Variances
Thank You
30
31
GROUP MEMBERS
Alyssa Vellesco
Clarisse Urbano
Jaslyn Boday
Nickie Aman
Danica Aguirre
Wella Mae Anta
Demilyn Yocte

PSYCH-STAT-PPT-GR1-1.pptx dsdsdsdsdsdsdsds

  • 1.
  • 2.
    What is tTest? A t-test (also known as Student's t-test) is a tool for evaluating the means of one or two populations using hypothesis testing. A t-test may be used to evaluate whether a single group differs from a known value (a one-sample t-test), whether two groups differ from each other (an independent two-sample t-test), or whether there is a significant difference in paired measurements (a paired, or dependent samples t- test).
  • 3.
    The one samplet test, also referred to as a single sample t test, is a statistical hypothesis test used to determine whether the mean calculated from sample data collected from a single group is different from a designated value specified by the researcher. 3 The t Test for a Single Sample
  • 4.
    4 One Sample tTest Assumptions For a valid test, we need data values that are: • Independent (values are not related to one another). • Continuous. • Obtained via a simple random sample from the population. Also, the population is assumed to be normally distributed.
  • 5.
    Example: In the population,the average IQ is 100. A team of scientists wants to test a new medication to see if it has either a positive or negative effect on intelligence or no effect at all. A sample of 30 participants who have taken the medication has a mean of 140 with a standard deviation of 20. Did the medication affect intelligence? Alpha = 0.05 5
  • 6.
    • Define Nulland Alternative Hypothesis • State Alpha • Calculate Degress of Freedom • State Decision Rule • Calculate Test Statistic • State Results • State Conclusion 6 One Sample t Test
  • 7.
    • Define Nulland Alternative Hypothesis Ho ; µ = 100 H1 ; µ ≠ 100 7 One Sample t Test
  • 8.
    • Define Nulland Alternative Hypothesis • State Alpha α = 0.05 8 One Sample t Test
  • 9.
    • Define Nulland Alternative Hypothesis • State Alpha • Calculate Degress of Freedom N – 1 = 30 – 1 = 29 9 One Sample t Test
  • 10.
    • Define Nulland Alternative Hypothesis • State Alpha • Calculate Degress of Freedom • State Decision Rule 10 One Sample t Test
  • 11.
    • Calculate TestStatistic =140 11 One Sample t Test
  • 12.
    • State Results Decisionrule: If t is less than -2.0452, reject the null hypothesis. t = 10.96 Reject: H0 12 One Sample t Test
  • 13.
    • State Conclusion Medicationsignificantly affected intelligence, t=10.96,p= 13 One Sample t Test
  • 14.
    The t-test fordependent means (also called a paired samples t- test or repeated measures t-test) is used when comparing two sets of related measurements, such as:- The same group of people tested twice (e.g., pre-test and post-test).- Two conditions from a within-subjects design (e.g., participants experience both conditions A and B). 14 t-Test for Dependent Means
  • 15.
    15 Key Assumptions: 1. Normality:The differences between paired scores should be approximately normally distributed. 2. Dependent Samples: The data consists of paired measurements (e.g., before and after for the same group). 3. 3. Continuous Data: The data should be interval or ratio. 15
  • 16.
    16 Formula Formula: The formula forthe t-statistic in a dependent means t-test is:
  • 17.
    17 Where: - D isthe mean difference between the paired scores. - SD is the standard deviation of the differences. - n is the number of paired scores. t-Test for Dependent Means
  • 18.
    18 Steps to performthe t-test: 1. Calculate the differences between the paired measurements. 2. Compute the mean of the differences (D). 3. Find the standard deviation of the differences, (sD). 4. Plug the values into the formula and calculate the t-statistic. 5. Determine the degrees of freedom, (df = n - 1), where ( n ) is the number of paired observations. 6. Compare the t-value to the critical value from the t-distribution table (or use the p-value) to determine statistical significance.
  • 19.
    19 Example of pairedscores for dependent t-test: Imagine a teacher wants to know if a new teaching method improves student performance. She gives a group of 5 students a math test before and after using the new method. In this example: Student Pre-Test Post-Test Difference (Post-Pre) 1 70 75 2 80 85 3 60 70 4 90 95 5 85 80
  • 20.
    Effect Size Tells youhow meaningful the relationship between variables or the difference between group is. It indicates the practical of a research outcome. Effect Size Formula: 20 𝑀1 − 𝑀2 𝜎
  • 21.
    21 The Distribution ofDifference Between Means difference between sample means from two independent groups.
  • 22.
    It’s the differencebetween the average (means) of two groups. 22 Example: Group 1 has a mean score of 75, and Group 2 has a mean score of 85. The difference is 85 - 75 = 10. What is the Difference Between Means?
  • 23.
    23 Sample mean vsPopulation Mean ● Sample means are taken from subsets of the population. ● Example: Comparing the average scores of students from two different schools. • It’s the distribution of all possible differences between two sample means. Sampling Distribution of the Difference Between Means
  • 24.
    24 Formula for DifferenceBetween Means ● Formula Difference = Where: ● = Mean of sample 1
  • 25.
    25 Standard Error ofthe Difference Formula: SE Where: • , = variances of the two samples • = sample sizes
  • 26.
    26 Hypothesis Testing Example NullHypothesis : No difference between the means Alternative Hypothesis Example: Group 1: Mean = 100, SD = 10, n = 30 Group 2: Mean = 95, SD = 12, n = 30 Calculate the Difference between means and test for significance.
  • 27.
    27 • The t-testfor independent means compares the difference between two independent sample means to an expectation about the difference in the population. • The Independent Samples t Test can only compare the means for two (and only two) groups. • It cannot make comparisons among more than two groups. • The t-test for independent means requires that there is no overlap between the two groups in the research design. HYPOTHESIS TESTING WITH THE T-TEST FOR INDEPENDENT MEANS
  • 28.
    The Independent Samplest Test is commonly used to test the following: •Statistical differences between the means of two groups •Statistical differences between the means of two interventions •Statistical differences between the means of two change scores 28
  • 29.
    Assumptions of thet-Test for Independent Means 1. Data are Numeric 2. Independence of Observation 3. Normality 4. Equal Variances
  • 30.
  • 31.
    31 GROUP MEMBERS Alyssa Vellesco ClarisseUrbano Jaslyn Boday Nickie Aman Danica Aguirre Wella Mae Anta Demilyn Yocte