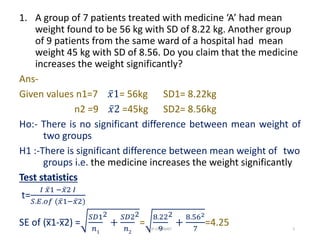
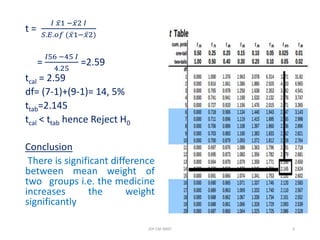
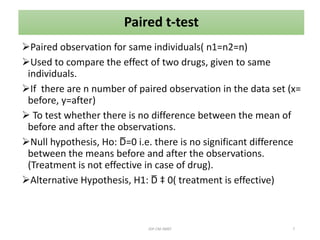
1) The document describes the unpaired t-test and paired t-test. The unpaired t-test is used to compare the means of two independent samples, while the paired t-test compares the means of two related samples or samples measured under different conditions.
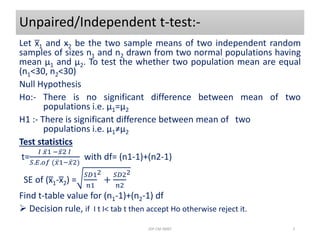
2) For the unpaired t-test, the null hypothesis is that there is no difference between the population means, while the alternative hypothesis is that there is a difference. The test statistic is calculated as the difference between the sample means divided by the standard error.
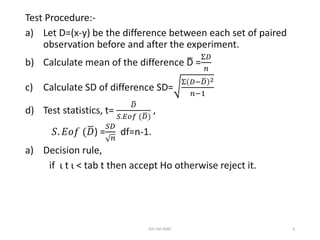
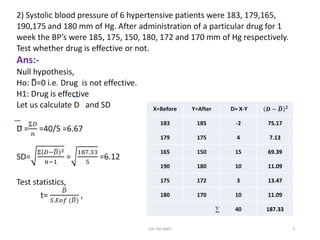
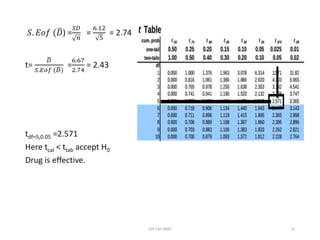
3) For the paired t-test, the null hypothesis is that the mean of the differences between pairs is zero, indicating no change. The alternative hypothesis is that the mean