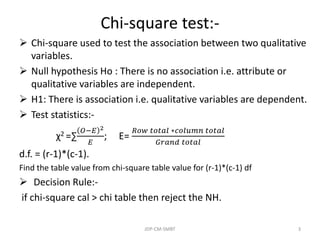
- The document describes how to perform a chi-square test of association between two qualitative variables.
- It provides the null hypothesis (H0), alternative hypothesis (H1), test statistic formula, and decision rule for the chi-square test.
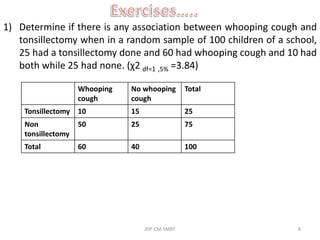
- An example applies the chi-square test to determine if there is an association between type of work and obesity using a contingency table with observed and expected frequencies. The calculated chi-square value exceeds the critical value, so the null hypothesis of no association is rejected.