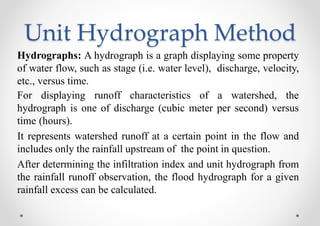
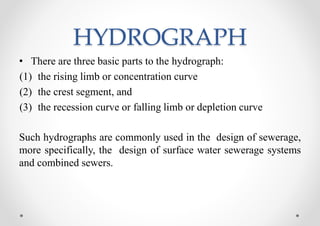
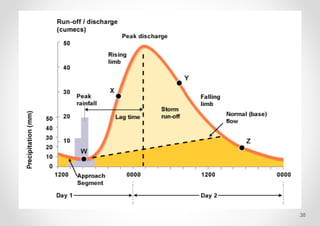
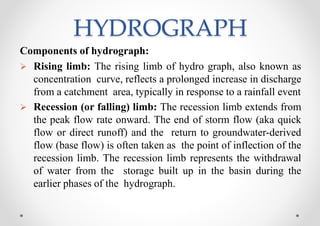
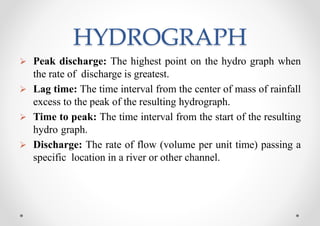
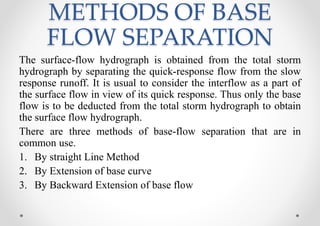
This document discusses runoff and provides definitions, processes, types, factors affecting runoff, and methods to estimate runoff. It defines runoff as the portion of precipitation that flows towards rivers and oceans as surface or subsurface flow. The key types of runoff discussed are surface runoff, subsurface/interflow, and baseflow. Factors affecting runoff include precipitation characteristics, catchment characteristics, topography, geology, and storage features. Methods to estimate runoff include direct measurement and indirect methods like empirical formulas, the rational method, and unit hydrograph analysis.
![8
a. Surface Runoff:
That portion of rainfall which enters the stream
immediately after the rainfall.
It occurs when all loses is satisfied and rainfall is still
continued and rate of rainfall [intensity] in greater
than infiltration rate.
b. Sub-Surface Runoff:
That part of rainfall which first leaches into the soil
and moves laterally without joining the water table, to
the stream, rivers or ocean is known as sub-surface
Runoff. It is usually referred is inter-flow.](https://image.slidesharecdn.com/4runoffandfloods-201012102520/85/4-runoff-and-floods-8-320.jpg)
![14
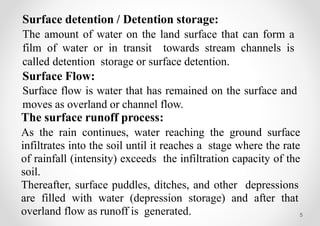
Two types of shape:
A) Fan shape [tends to produce higher runoff very
early]
B) Fern shape [tend to produced less runoff]
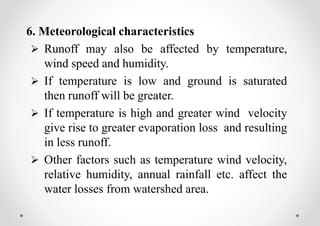
Slope of Watershed: It has complex effect. It controls
the time of overland flow and time of concentration of
rainfall. E.g. sloppy watershed results in greater runoff
due to greater runoff velocity and vice-versa.
Orientation of Watershed: This affects the evaporation
and transpiration losses from the area. The north or south
orientation, affects the time of melting of collected snow.](https://image.slidesharecdn.com/4runoffandfloods-201012102520/85/4-runoff-and-floods-14-320.jpg)
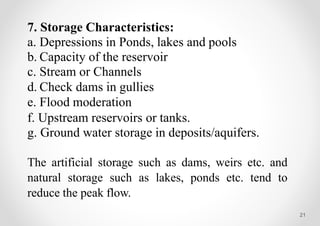
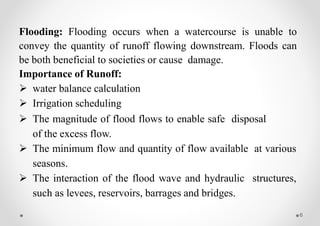
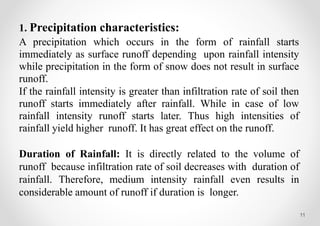
![A] Fan shaped catchment:
All the tributaries are
approximately of the same
size.
Gives greater runoff because
the peak flood from the
tributaries is likely to reach
the main stream
approximately at the same
time.](https://image.slidesharecdn.com/4runoffandfloods-201012102520/85/4-runoff-and-floods-15-320.jpg)
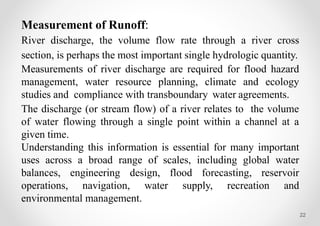
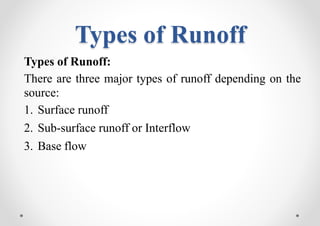
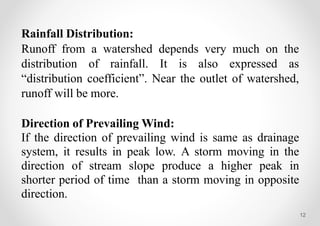
![B] Fern leaf catchment:
The tributaries are generally of
different lengths and meet the
main stream at the regular
intervals.
Such a narrow catchments the
peak flood intensity is reduced
since discharges are likely to be
distributed over a long period of
time.](https://image.slidesharecdn.com/4runoffandfloods-201012102520/85/4-runoff-and-floods-16-320.jpg)
![18
4. Topographic characteristics:
It includes those topographic features which affects
the runoff. E.g. inclination or slope of catchment also
upon whether the catchment area is smooth or rugged
terrain. Undulating land has greater runoff than flat
land.
Drainage Density:
It is defined as the ratio of the total channel length [L]
in the watershed to total watershed area [A]. Greater
drainage density gives more runoff.
Drainage density = L/A](https://image.slidesharecdn.com/4runoffandfloods-201012102520/85/4-runoff-and-floods-18-320.jpg)