
Recommended
More Related Content
Similar to WATERSHED CATCHMENT.pdf
Similar to WATERSHED CATCHMENT.pdf (20)
More from CtKamariahMdSaat
More from CtKamariahMdSaat (8)
Recently uploaded
Recently uploaded (20)
WATERSHED CATCHMENT.pdf
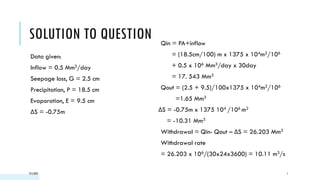
- 1. SOLUTION TO QUESTION Data given: Inflow = 0.5 Mm3/day Seepage loss, G = 2.5 cm Precipitation, P = 18.5 cm Evaporation, E = 9.5 cm ΔS = -0.75m Qin = PA+inflow = (18.5cm/100) m x 1375 x 104m2/106 + 0.5 x 10⁶ Mm3/day x 30day = 17. 543 Mm3 Qout = (2.5 + 9.5)/100x1375 x 104m2/106 =1.65 Mm3 ΔS = -0.75m x 1375 104 /106 m2 = -10.31 Mm3 Withdrawal = Qin- Qout – ΔS = 26.203 Mm3 Withdrawal rate = 26.203 x 10⁶/(30x24x3600) = 10.11 m3/s 9/5/2021 1
- 2. CONCEPT AND MEASUREMENT OF WATERSHED ERT257 HYDROLOGY AND WATER RESOURCES ENGINEERING Mrs Siti Kamariah Md Sa’at FTKK UniMAP
- 3. WATERSHED A basin, drainage or catchment area that is the land area that contributes runoff to an outlet point Outlet point Watershed boundary
- 4. WATERSHEDS Area of land draining into a stream at a given location. In US called watershed. Also known as Catchment, Catchment area, Catchment basin, Drainage area, River basin, Water basin Rainfall that falls in a watershed will generate runoff to that watershed outlet. Topographic elevation is used to define a Watershed boundary (land survey or LIDAR) Scale is a big issue for analysis 9/5/2021 ADD A FOOTER 4
- 5. We all live in a watershed! Area of land from which all water drains, running downhill, to a shared destination - a river, pond, stream, lake, or estuary
- 6. FUNCTIONS Captures precipitation – its characteristics influence how much is captured Stores water once it infiltrates into soil (important to plants) Slowly releases water into streams, rivers, oceans
- 7. WHY ARE WATERSHEDS IMPORTANT? Activities within a watershed impact runoff and water quality of water leaving the watershed Must manage at a watershed level rather than other boundaries to attain goals related to runoff and water quality
- 8. TYPES OF WATERSHED •Forested watershed •Urban watershed •Agricultural watershed •Rural watershed •Coastal/swamp/desert watershed •Combination of above 9/5/2021 ADD A FOOTER 8
- 9. HYDROLOGIC ANALYSIS Two important hydraulic parameters in hydrologic analysis – Outfall/drainage outlet, i.e. the common point of discharge – Watershed boundary – any rain that falls within the boundary will be directed towards point of discharge – Because of various nature of river system, a watershed may have any number of sub-watershed within it 9/5/2021 ADD A FOOTER 9
- 11. Watershed Characteristics Size Slope Shape Soil type/Land use Storage capacity Reservoir Divide Natural stream Urban Concrete channel 1 mile
- 12. WATERSHED SIZE Watershed area (km2, ha) Runoff generation on these watersheds can be considered in two phases:i) land phase and ii) channel phase Small watersheds (< 250 km2) They have dominant land phase and overland flow, have relatively less conspicuous channel phase. They are highly sensitive to high-intensity, short-duration rainfalls. Large watersheds (>250 km2) They have well-developed channel networks and channel phase, and, thus, channel storage is dominant. They are less sensitive to high-intensity rainfalls of short duration. 9/5/2021 ADD A FOOTER 12
- 13. WATERSHED SLOPES The slope govern how fast water will drain to the channel • steep slopes - peaked hydrograph • gentle slopes - flat hydrograph • Consider the average gradient of hill slopes (slope: vertical/horizontal distance) • Formula for land slope, S: Where: L = total length of contours (m), CI= contour interval (m) A= watershed area (m2) 9/5/2021 ADD A FOOTER 13
- 14. • Important hydrologic characteristic • Elongated Shape • Concentrated Shape • Affects Timing and Peak Flow • Determined by geo - morphology of stream WATERSHED SHAPES
- 15. 9/5/2021 ADD A FOOTER 15
- 16. 9/5/2021 ADD A FOOTER 16 Sub-watershed
- 17. SUB-WATERSHED 9/5/2021 ADD A FOOTER 17
- 18. WATERSHED DELINEATION 9/5/2021 ADD A FOOTER 18
- 19. LANGAT RIVER BASIN 9/5/2021 ADD A FOOTER 19
- 20. RUNOFF What is runoff? 9/5/2021 ADD A FOOTER 20
- 21. WHAT IS RUNOFF? Runoff = draining or flowing off of precipitation from a catchment area through a surface channel enters into stream channel. Output from catchment in a given unit of time. Based on the time delay between the precipitation and the runoff, the runoff is classified into two categories; as (a) Direct runoff : runoff which enters the stream immediately after the rainfall. It includes surface runoff, prompt interflow and rainfall on the surface of the stream. Direct storm runoff and storm runoff are also used to designate direct runoff. (b) Base flow : The delayed flow that reaches a stream essentially as groundwater flow is called base flow. 9/5/2021 21
- 22. COMPONENTS OF RUNOFF 9/5/2021 ADD A FOOTER 22
- 23. FACTORS AFFECTING CATCHMENT RUNOFF a) Precipitation characteristics b) Shape and size of catchment c) Topography d) Geologic characteristics e) Meteorological characteristics f) Storage characteristics of a catchment 9/5/2021 ADD A FOOTER 23
- 24. RUNOFF ESTIMATION Rational method
- 25. RUNOFF ESTIMATION METHOD Rational method Infiltration Approach Hydrograph method NRCS Curve Number (Formerly SCS) Method 9/5/2021 25
- 26. RATIONAL METHOD Used for determination of peak flow rate Assumption: A constant intensity of rain uniformly distributed over an area maximum runoff: occur when the rainfall duration equals the time of concentration For small size (<50 km2) catchments This not cover what is MSMA (Manual Saliran Mesra Alam Malaysia)/Urban Stormwater Management Manual.
- 27. RATIONAL METHOD The maximum possible flow generated by rainfall event of a watershed • Knowledge of Qp is required for drainage design to avoid/minimize project from flooding • Rational method: is a prediction method and based on characteristics of watershed and rainfall Assumptions: • Waters is small (<200 acres) • Peak flow occurs when the entire area is contributing • Rainfall intensity is uniform over a time of concentration • A rational coefficient represent rainfall:runoff ratio 9/5/2021 ADD A FOOTER 27
- 28. RATIONAL METHOD Standard Rational Method Qp = C i A Where Qp=peak discharge C=coefficient of runoff i = mean intensity of precipitation for duration equal to tc A=drainage area To compute Qp, requires tc,i and C Rational runoff Coefficient, C – Defined as the rate of rainfall over a watershed to rate of runoff from that watershed – The value is highly dependent on land use and slope (Table)
- 29. RATIONAL METHOD 9/5/2021 ADD A FOOTER 29
- 30. RATIONAL METHOD
- 31. RUNOFF COEFFICIENT Coefficient that represents the fraction of runoff to rainfall Depends on type of surface When a drainage area has distinct parts with different coefficients… Use weighted average A A C .. A C A C C i n n 2 2 1 1 Σ + … + + =
- 34. 9/5/2021 ADD A FOOTER 34
- 35. TIME OF CONCENTRATION (TC) Time for water to flow from hydraulically most distant point on the watershed to the point of interest Assumes peak runoff occurs when i lasts as long or longer than tc
- 36. TIME OF CONCENTRATION, TC For other catchment, use Kirpich Equation (1940) tc=0.01947 L0.77S-0.385 where tc in min L= maximum length of travel time in m S= slope catchment = ∆H/L ∆H = difference of elevation between the most remote point on the catchment and the outlet
- 37. TIME OF CONCENTRATION, TC Sometimes its written as tc= 0.01947 K1 0.77 Where K1= L = max length of travel (m) ∆H = different of elevation H) / (L3 ∆
- 38. TIME OF CONCENTRATION, TC 38
- 39. TIME OF CONCENTRATION (TC) Depends on: Size and shape of drainage area Type of surface Slope of drainage area Rainfall intensity Whether flow is entirely overland or whether some is channelized
- 40. RAINFALL INTENSITY, I Corresponding to a duration tc and the desired probability of exceedence P Return period, T=1/P Found from rainfall intensity—duration-frequency (IDF) curve
- 41. INTENSITY-DURATION-FREQUENCY CURVE 9/5/2021 ADD A FOOTER 41
- 42. RAINFALL INTENSITY, I Average intensity for a selected frequency and duration Based on “design” event (i.e. 50-year storm) Overdesign is costly (what else?) Underdesign may be inadequate
- 43. RAINFALL INTENSITY, I Based on values of tc and T tc = time of concentration T = recurrence interval or design frequency As a minimum equal to the time of concentration, tc, (mm/hr)
- 44. RECURRENCE INTERVAL (DESIGN EVENT) 2-year interval -- Design of intakes and spread of water on pavement for primary highways and city streets 10-year interval -- Design of intakes and spread of water on pavement for freeways and interstate highways 50 - year -- Design of subways (underpasses) and sag vertical curves where storm sewer pipe is the only outlet 100 – year interval -- Major storm check on all projects ARI = Average recurrent interval - Average length of time between rain events that exceed the same magnitude, volume and duration
- 45. DESIGN ACCORDING TO MSMA 9/5/2021 ADD A FOOTER 45
- 46. EXAMPLE 1: RATIONAL METHOD An urban catchment has an area of 85 ha. The slope of the catchment is 0.006 and the maximum length of travel of water is 950m. The maximum depth of rainfall with a 25-year return period is as below Duration (min) 5 10 20 30 40 60 Depth of rainfall (mm) 17 26 40 50 57 62 If a culvert for drainage at the outlet of this area is to be designed for a return period of 25years, estimate the required peak-flow rate, by assuming runoff coefficient is 0.3
- 47. SOLUTION tc using Kirpich formula: tc=0.01947 L0.77S-0.385 = 0.01947 x (950)0.77 x (0.006)-0.385 = 27.4 minutes By interpolation, i = (50-40)/10 x 7.4 + 40 = 47.4 mm Average intensity, i tc,p = 47.4/27.4 x60 = 103.8 mm/hr Q = 0.3 x 103.8 x 0.85/3.6 = 7.35 m3/s 47
- 48. EXAMPLE 2: RATIONAL METHOD If the urban area of example 1, the land use of the area and the corresponding runoff coefficients are as given below, calculate the equivalent runoff coefficient. Land Use Area (ha) Runoff coefficient Roads 8 0.70 Lawn 17 0.10 Residential Area 50 0.30 Industrial Area 10 0.80
- 49. SOLUTION 49 C = C1A1 + C2A2 + ….. + CnAn ΣAi = 0.7 (8)+ 0.1(17)+0.3(50)+0.8 (10) (8+17+50+10) = 0.36
- 50. EXAMPLE 3 50 A catchment area of 120 ha has a time of concentration of 30 min and runoff coefficient of 0.3. If a storm of duration 45 min results in 3.0 cm of rainfall over the catchment, estimate the resulting peak flow rate. i = 30 mm/(45 min/hr x 60) = 40 mm/hr C = 0.3 A = 120 ha Q = 0.3(40)(120)/360 = 4 m3/s
- 51. WORKED EXAMPLE Determine the design peak for flow generated from residential area of 10 hectares in Kuala Lumpur for design return period 50 years. Assume 80 m of overland flow followed by 400 m of flow in open drain. Catchment area average slope is 0.5%. Solution: 1. Determine tc = to + td = 8 + 7 = 15 min From overland flow chart: to = 8 minutes td = L/v (Manning equation), Assume v = 1 m/s, then td = 400 s = 6.7 min. Use 7 min 2. Refer IDF curve to obtain i. i = 200mm/hr 3. Choose rational coefficient, C (Table) = 0.7 4. Compute Qp = C I A 9/5/2021 ADD A FOOTER 51
- 52. 9/5/2021 ADD A FOOTER 52
- 53. IDF CURVE KUALA LUMPUR 9/5/2021 ADD A FOOTER 53
- 54. TRY Problems 7.2 & 7.4 9/5/2021 ADD A FOOTER 54
- 55. THANK YOU Any question? 9/5/2021 ADD A FOOTER 55