Downloaded 700 times

![23
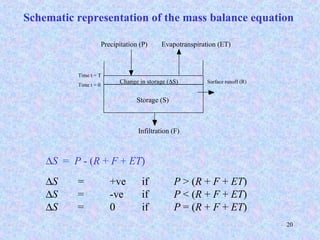
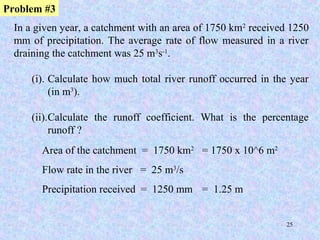
(iii). The water balance equation can be arranged to
produce:
ET+F= P - R - ΔS
where:
P = (1.3 × 2500×106
)
= 3.25×10⁹
m3
R = 9.4608×10⁸
m3
(from [i])
ΔS = 0 (i.e. no change in storage)
So,
ET + F = 3.25×10⁹
- 9.4608×108
= 2.30392×10⁹
m3
= (2.30392×10⁹
) / (2500×106
)
= 0.92 m
Problem #1](https://image.slidesharecdn.com/lec-150816090146-lva1-app6891/85/Lec-01-introduction-to-hydrology-23-320.jpg)

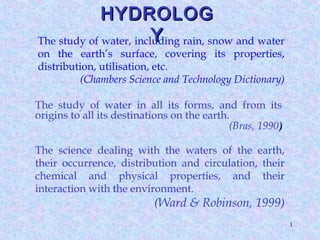
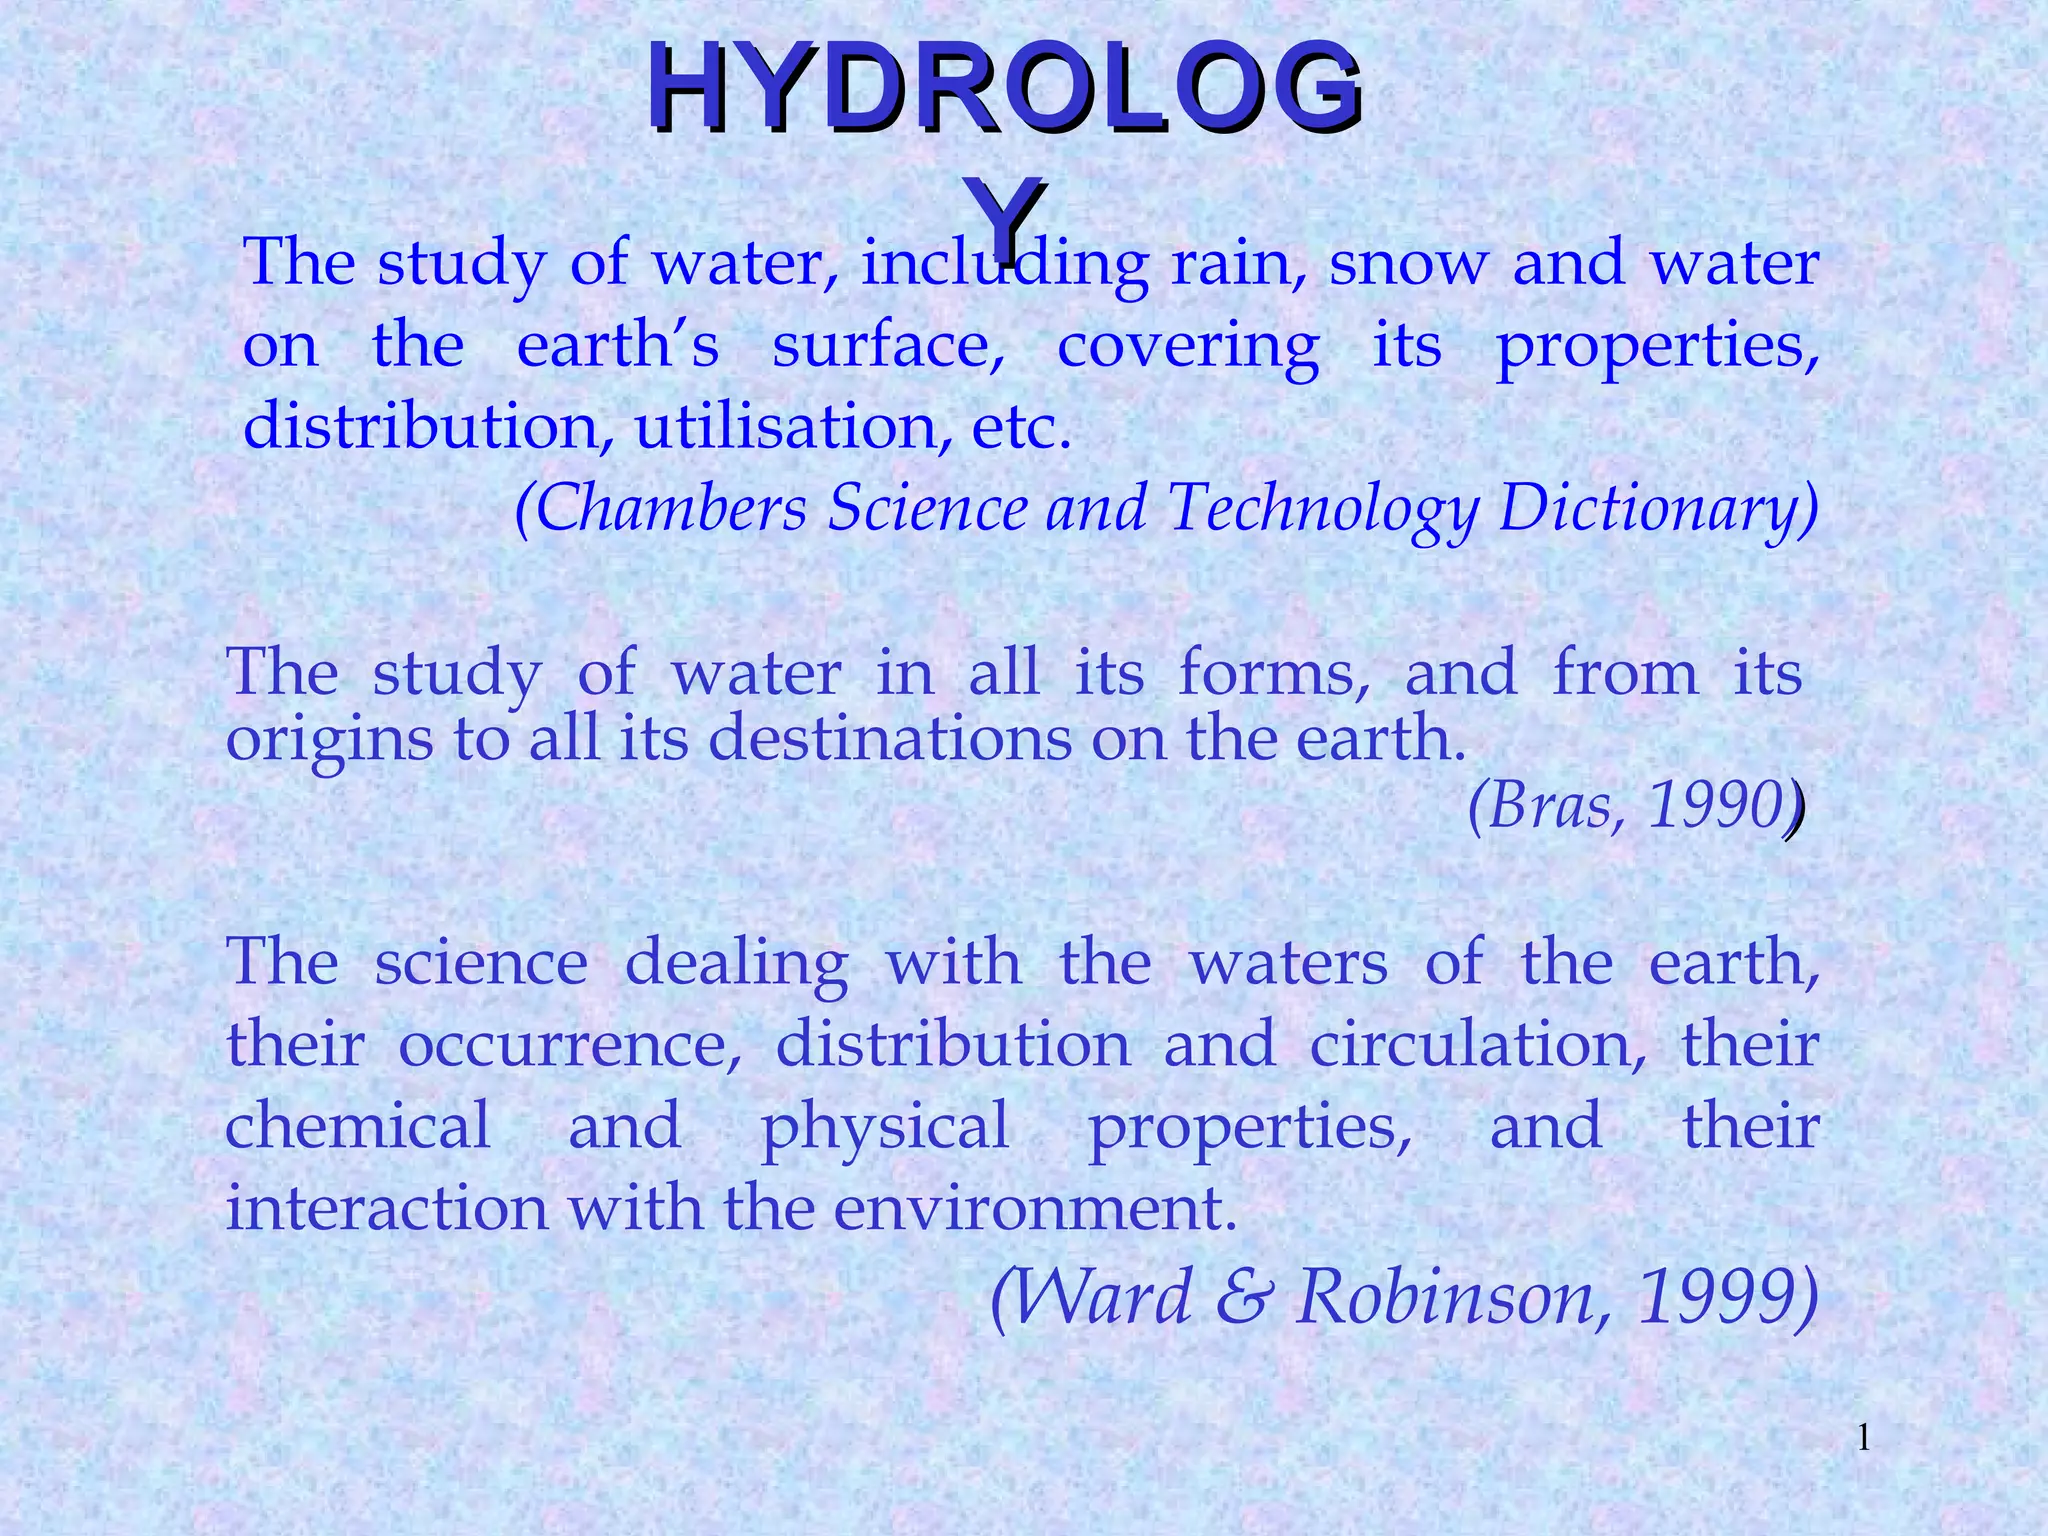
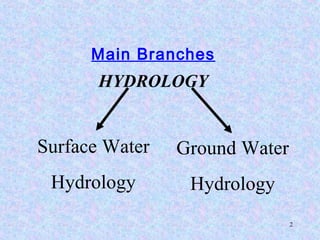
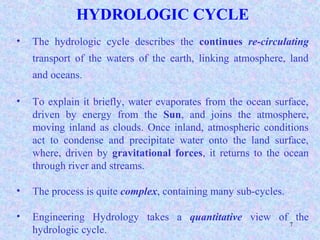
The document discusses engineering hydrology, which uses hydrologic principles to solve problems related to water resource management and development. It defines engineering hydrology as studying the hydrologic cycle and its components like precipitation, evaporation, infiltration and runoff. Engineering hydrologists work on projects for water control, utilization and management by estimating maximum floods, droughts, water supply and more using statistical and modeling techniques. The key aspects of hydrology discussed are data collection, analysis and prediction.