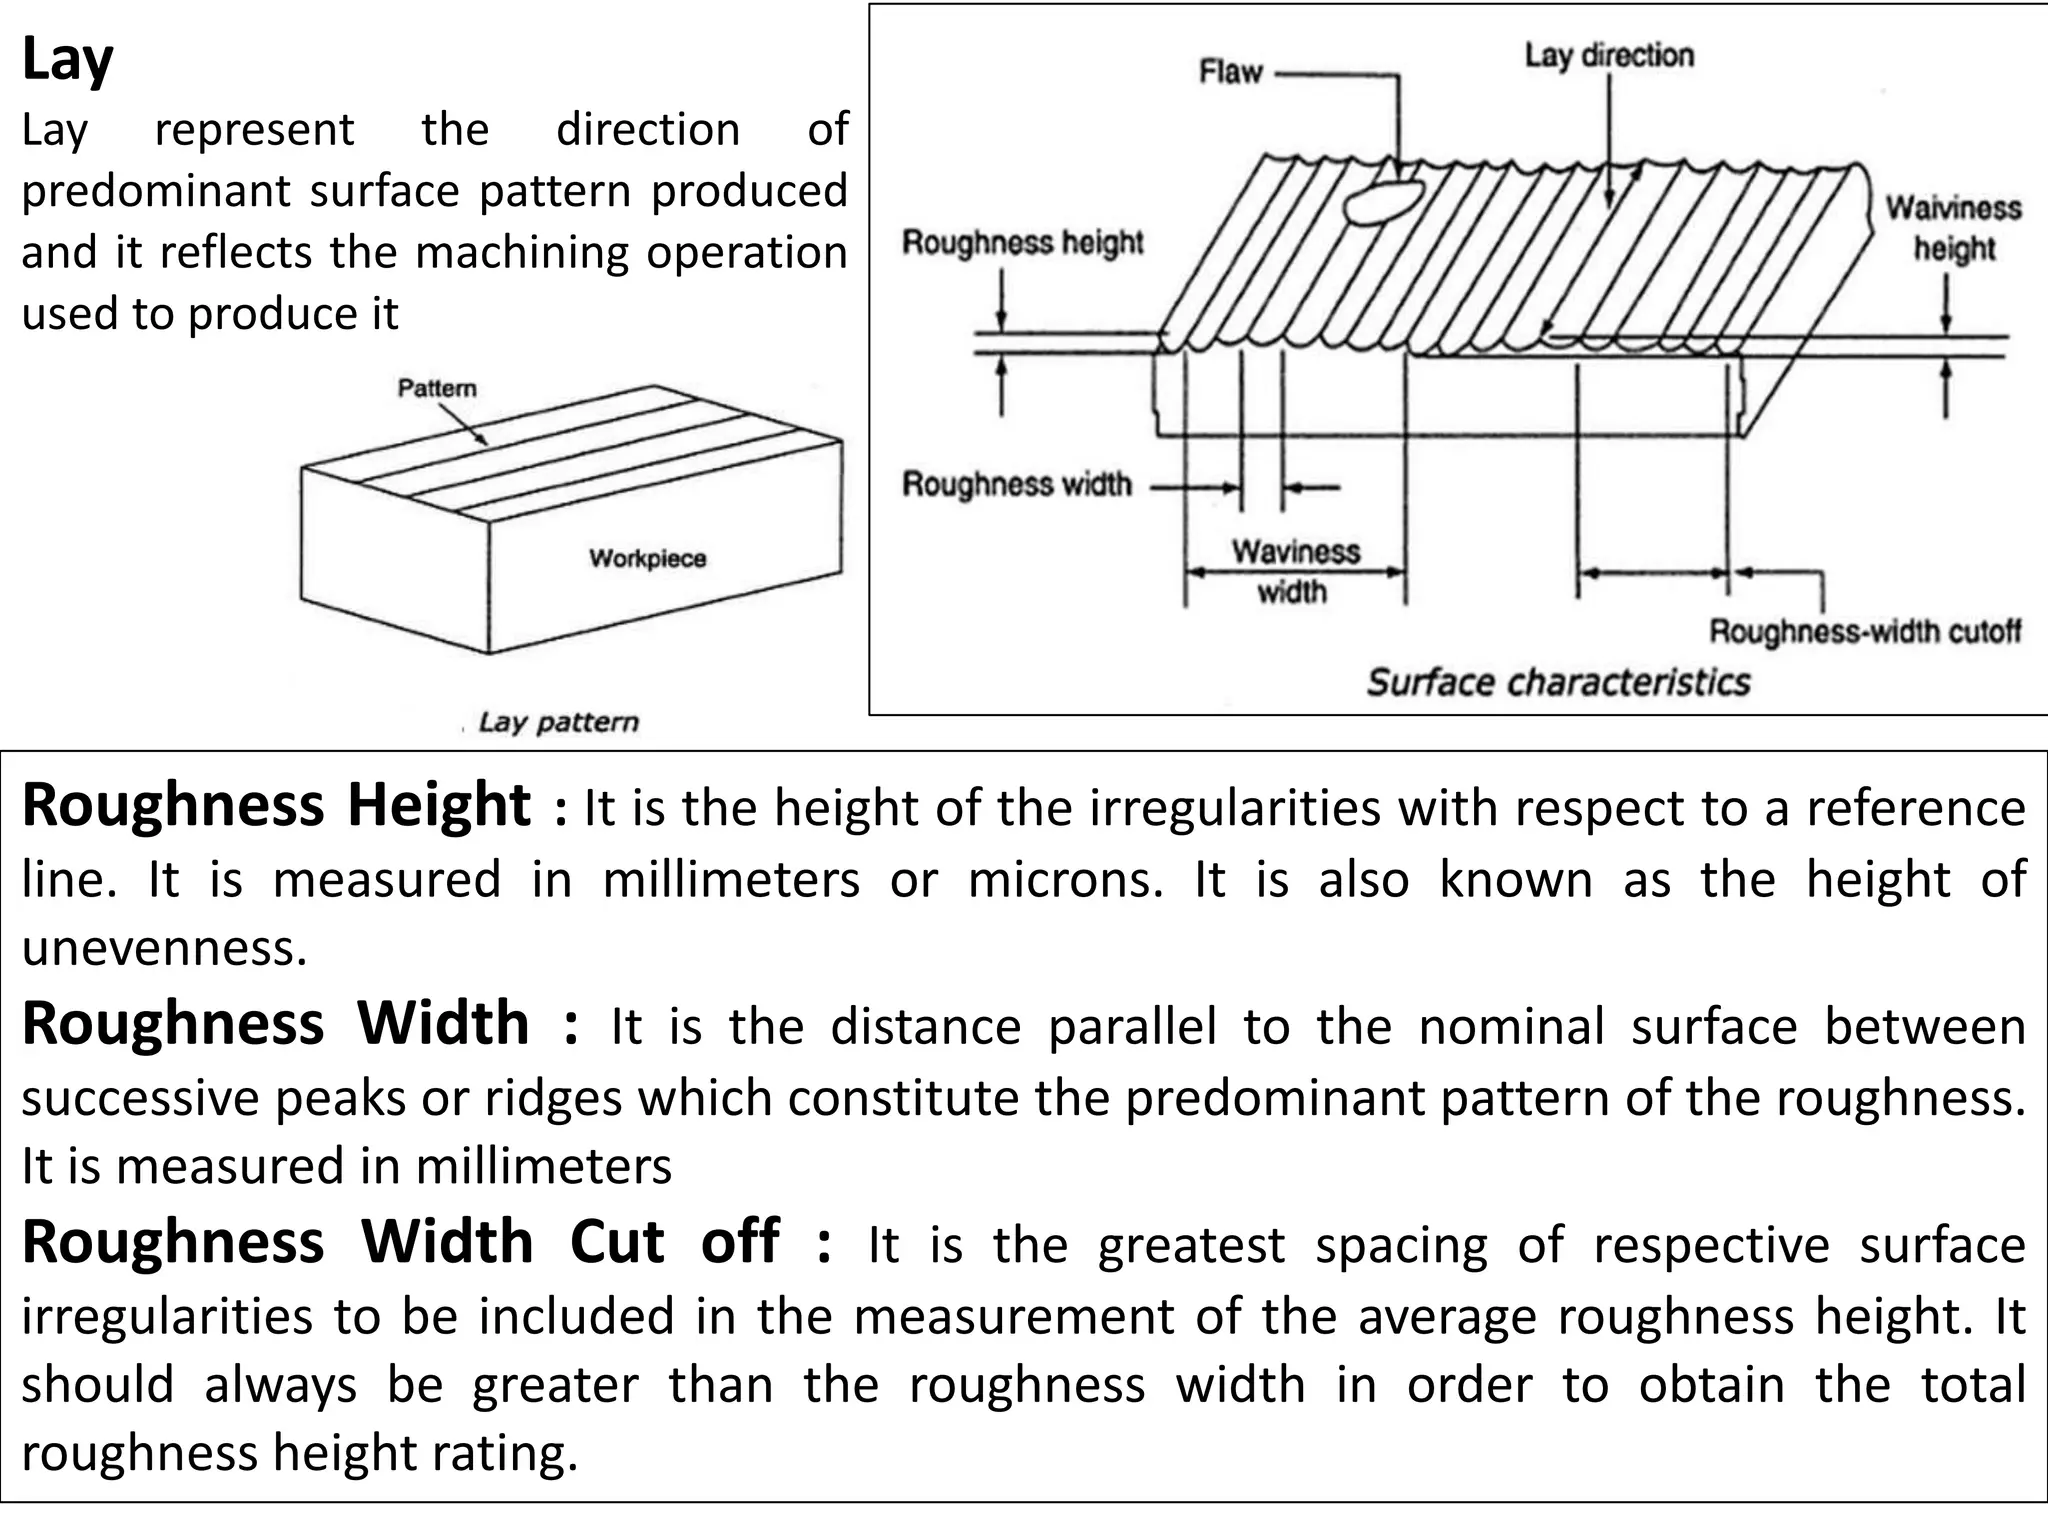
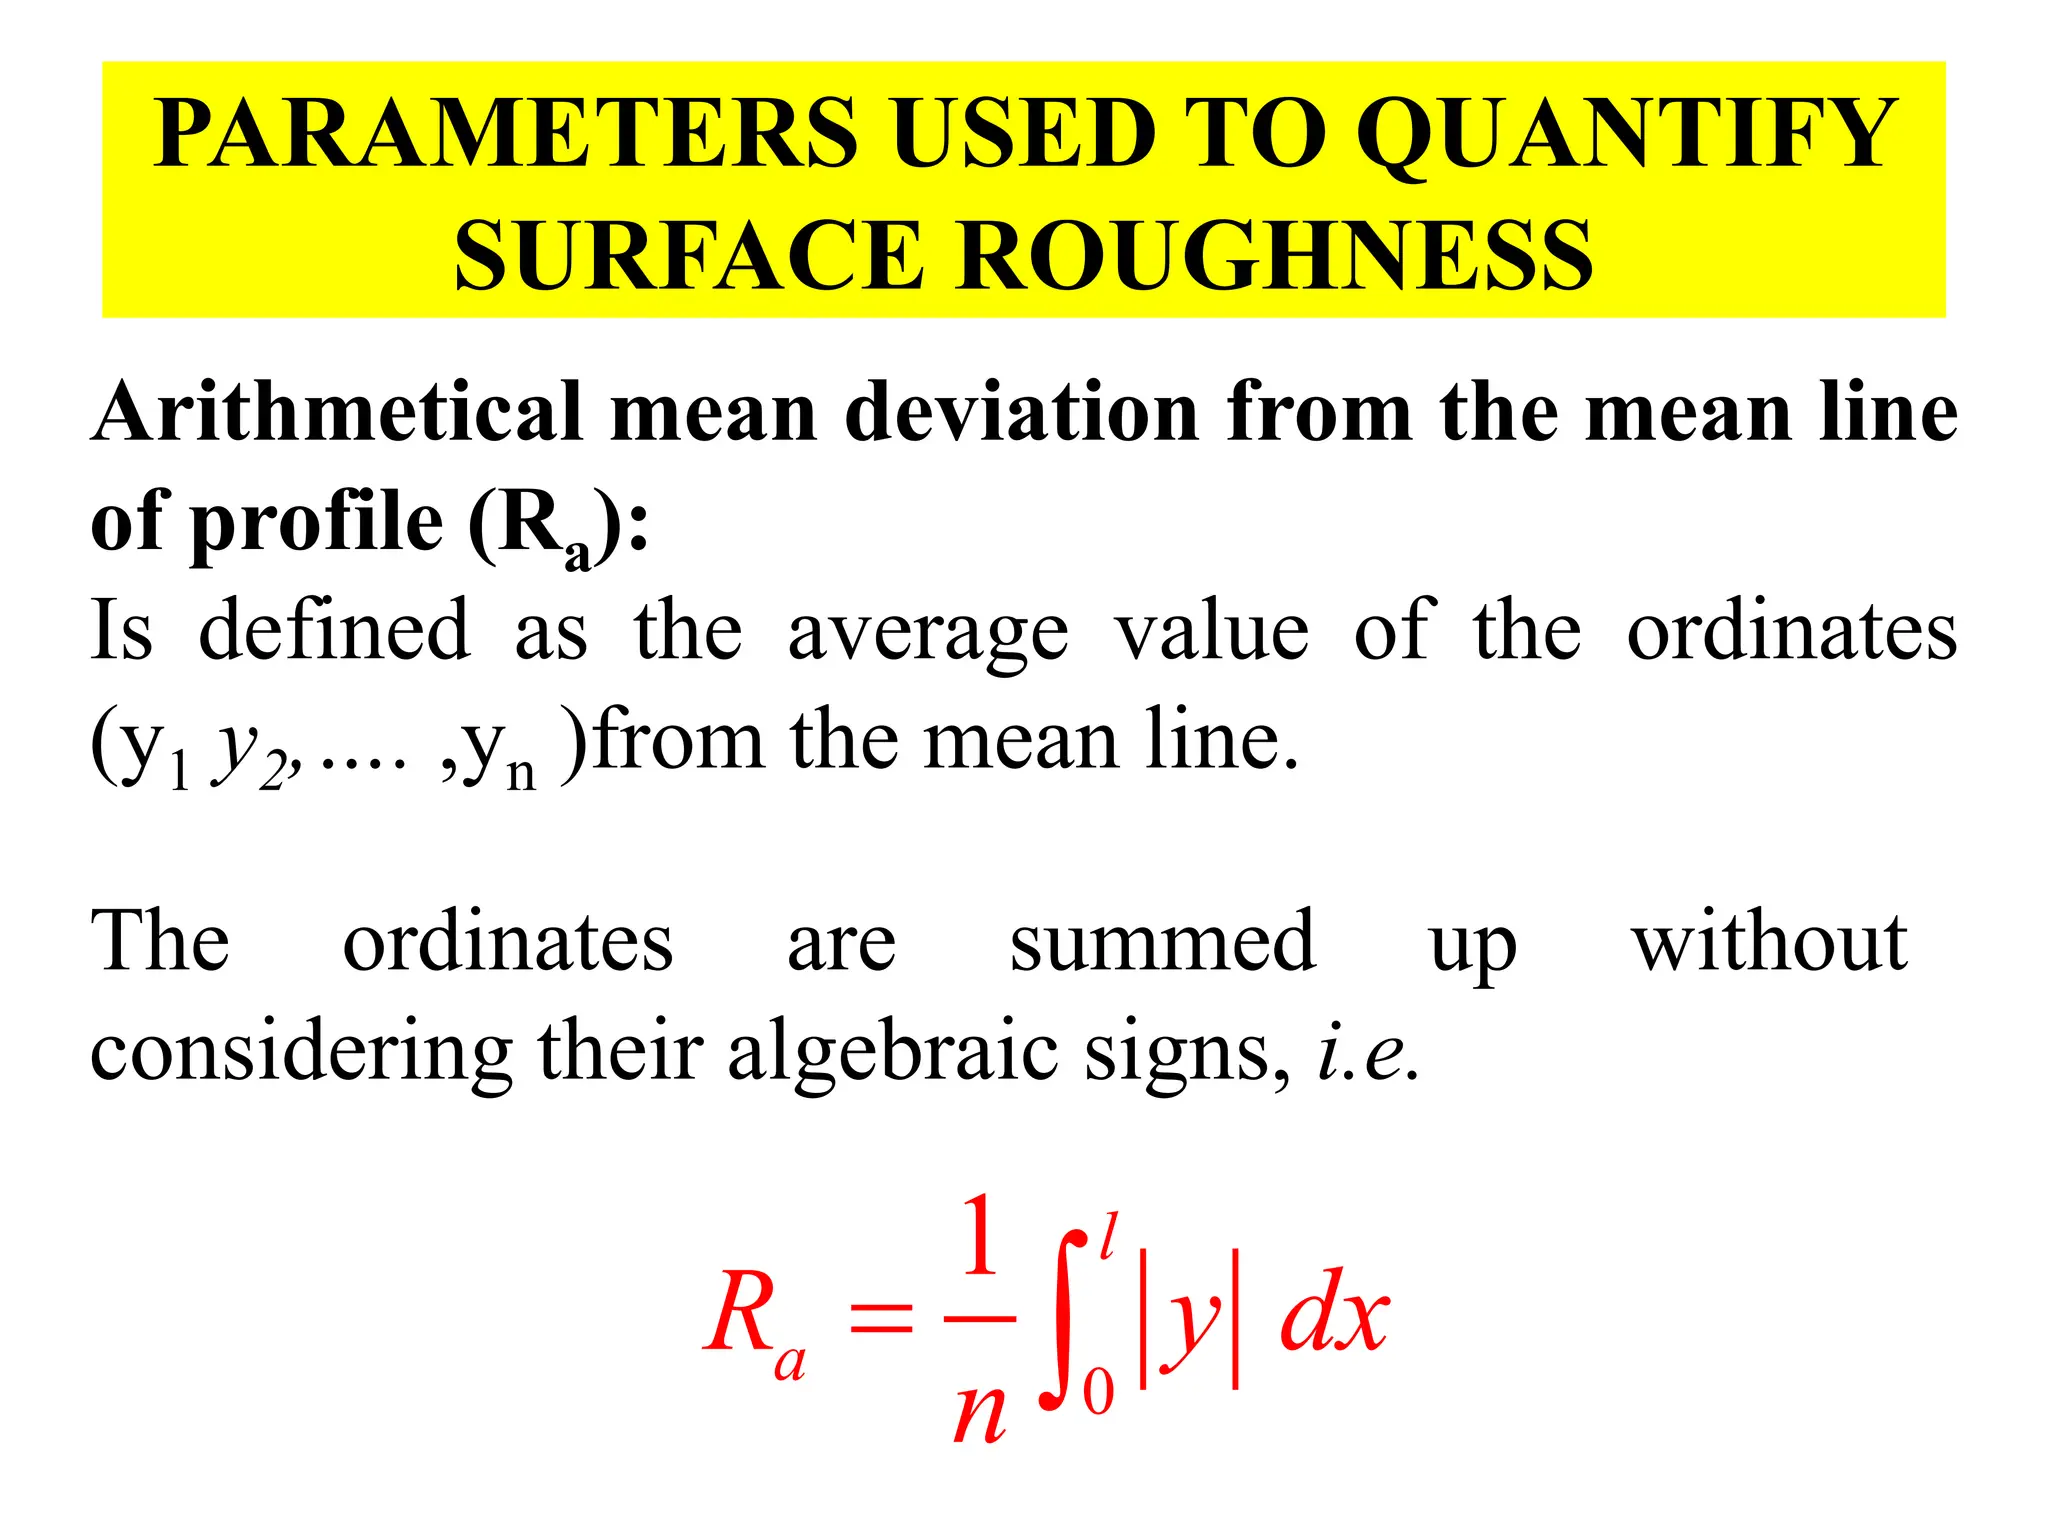
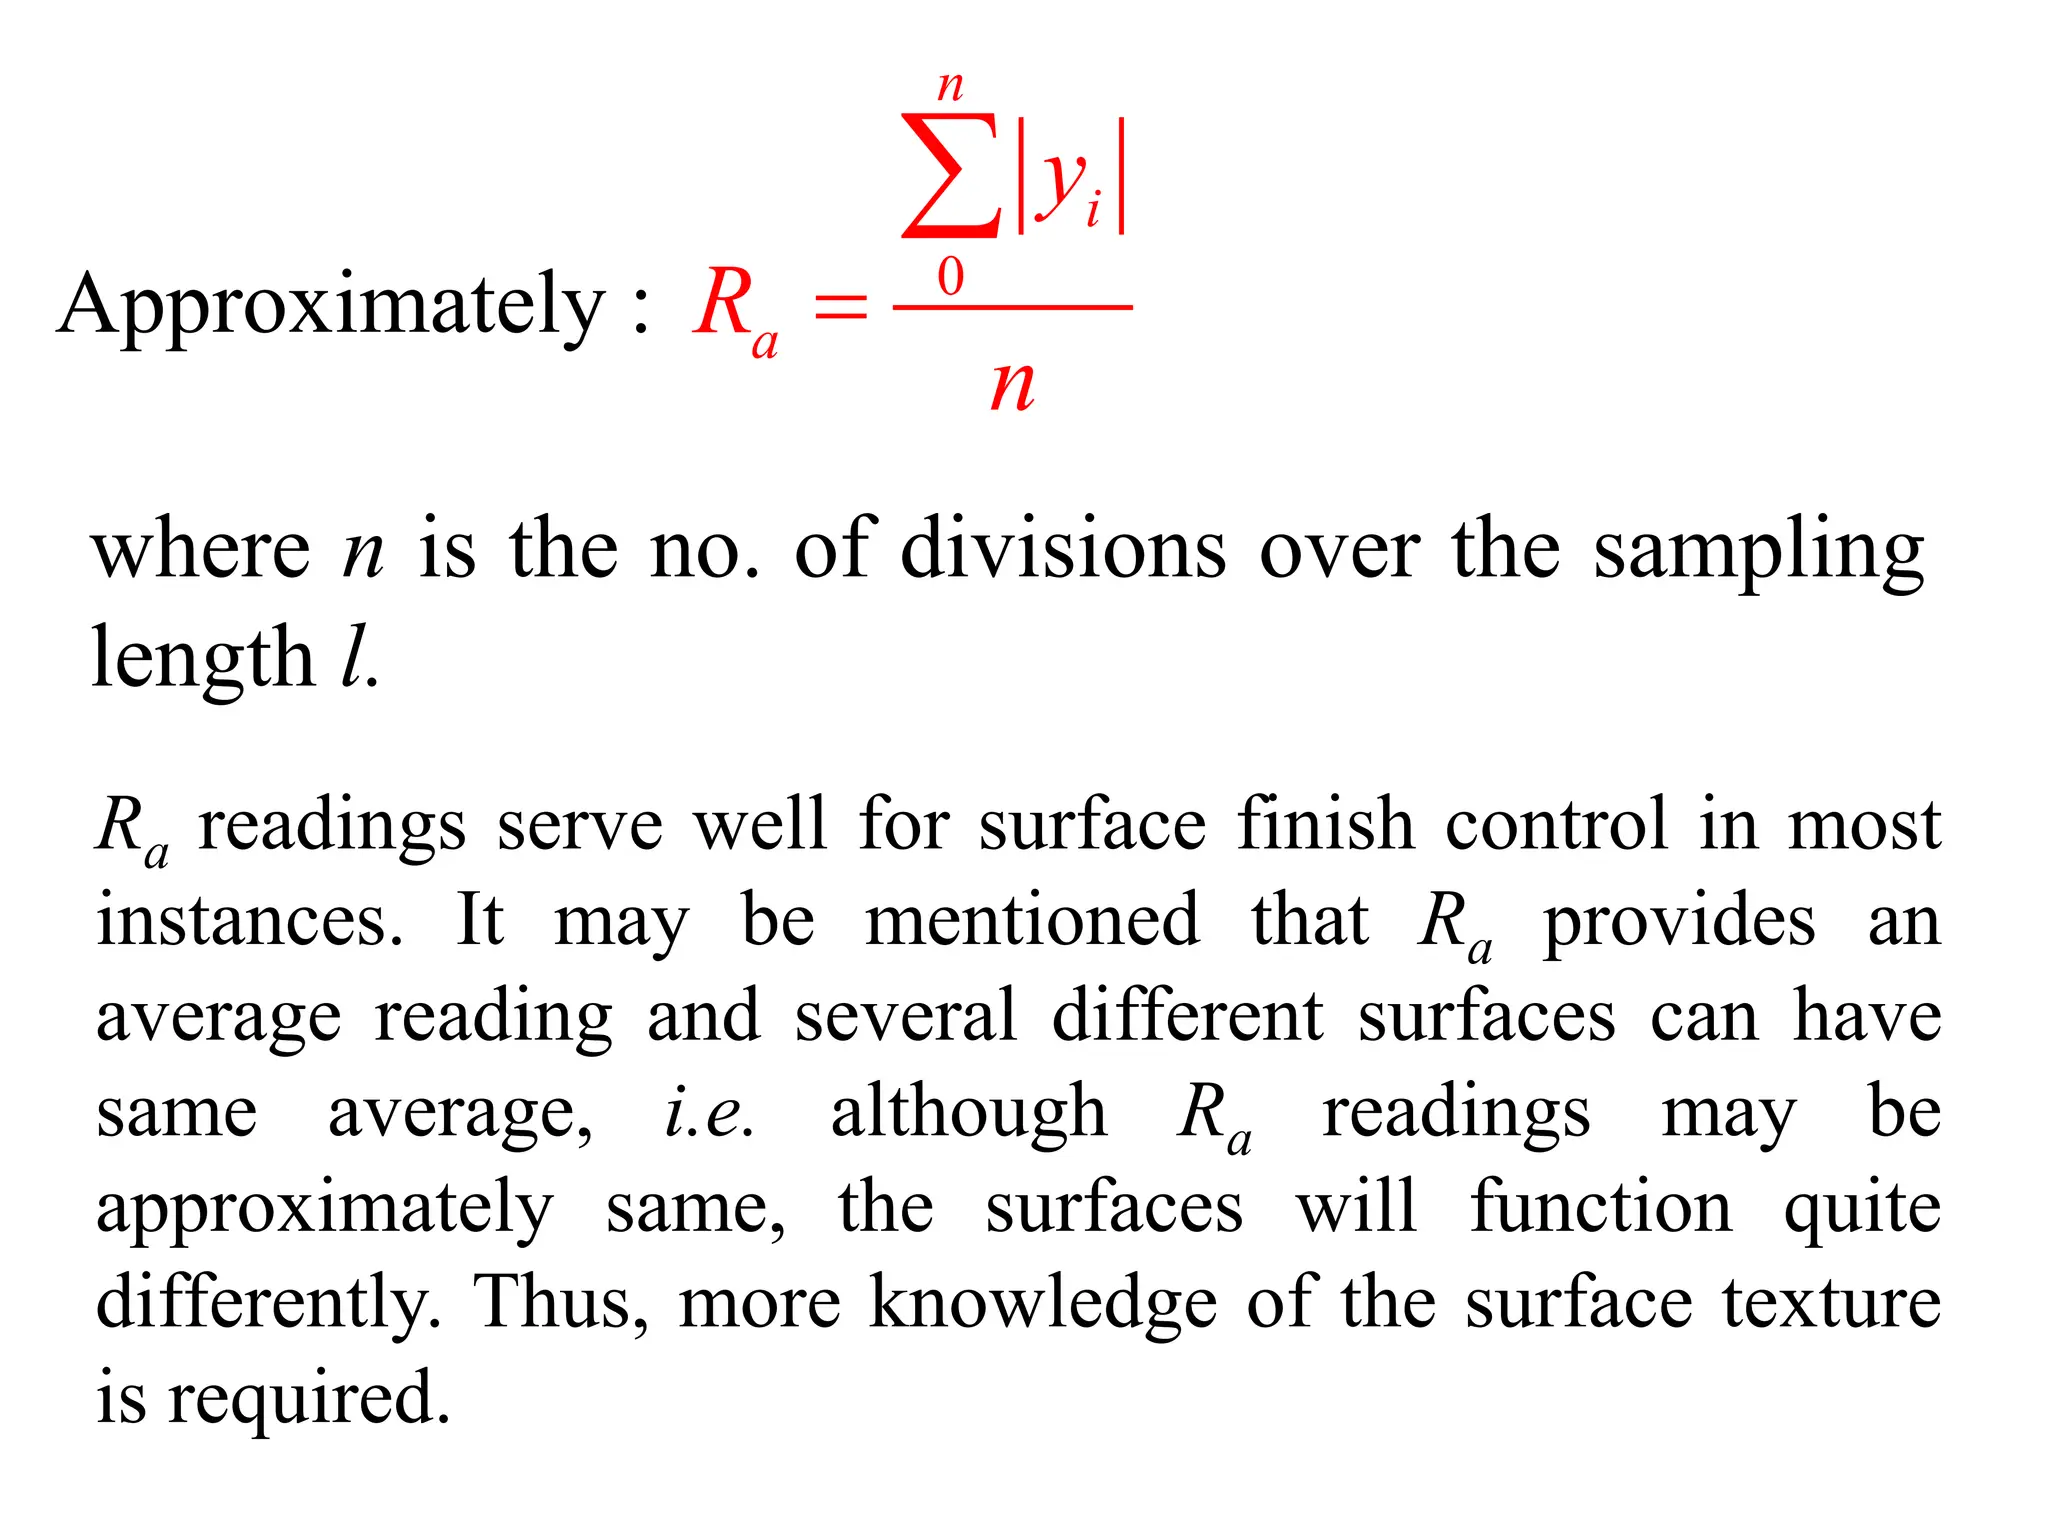
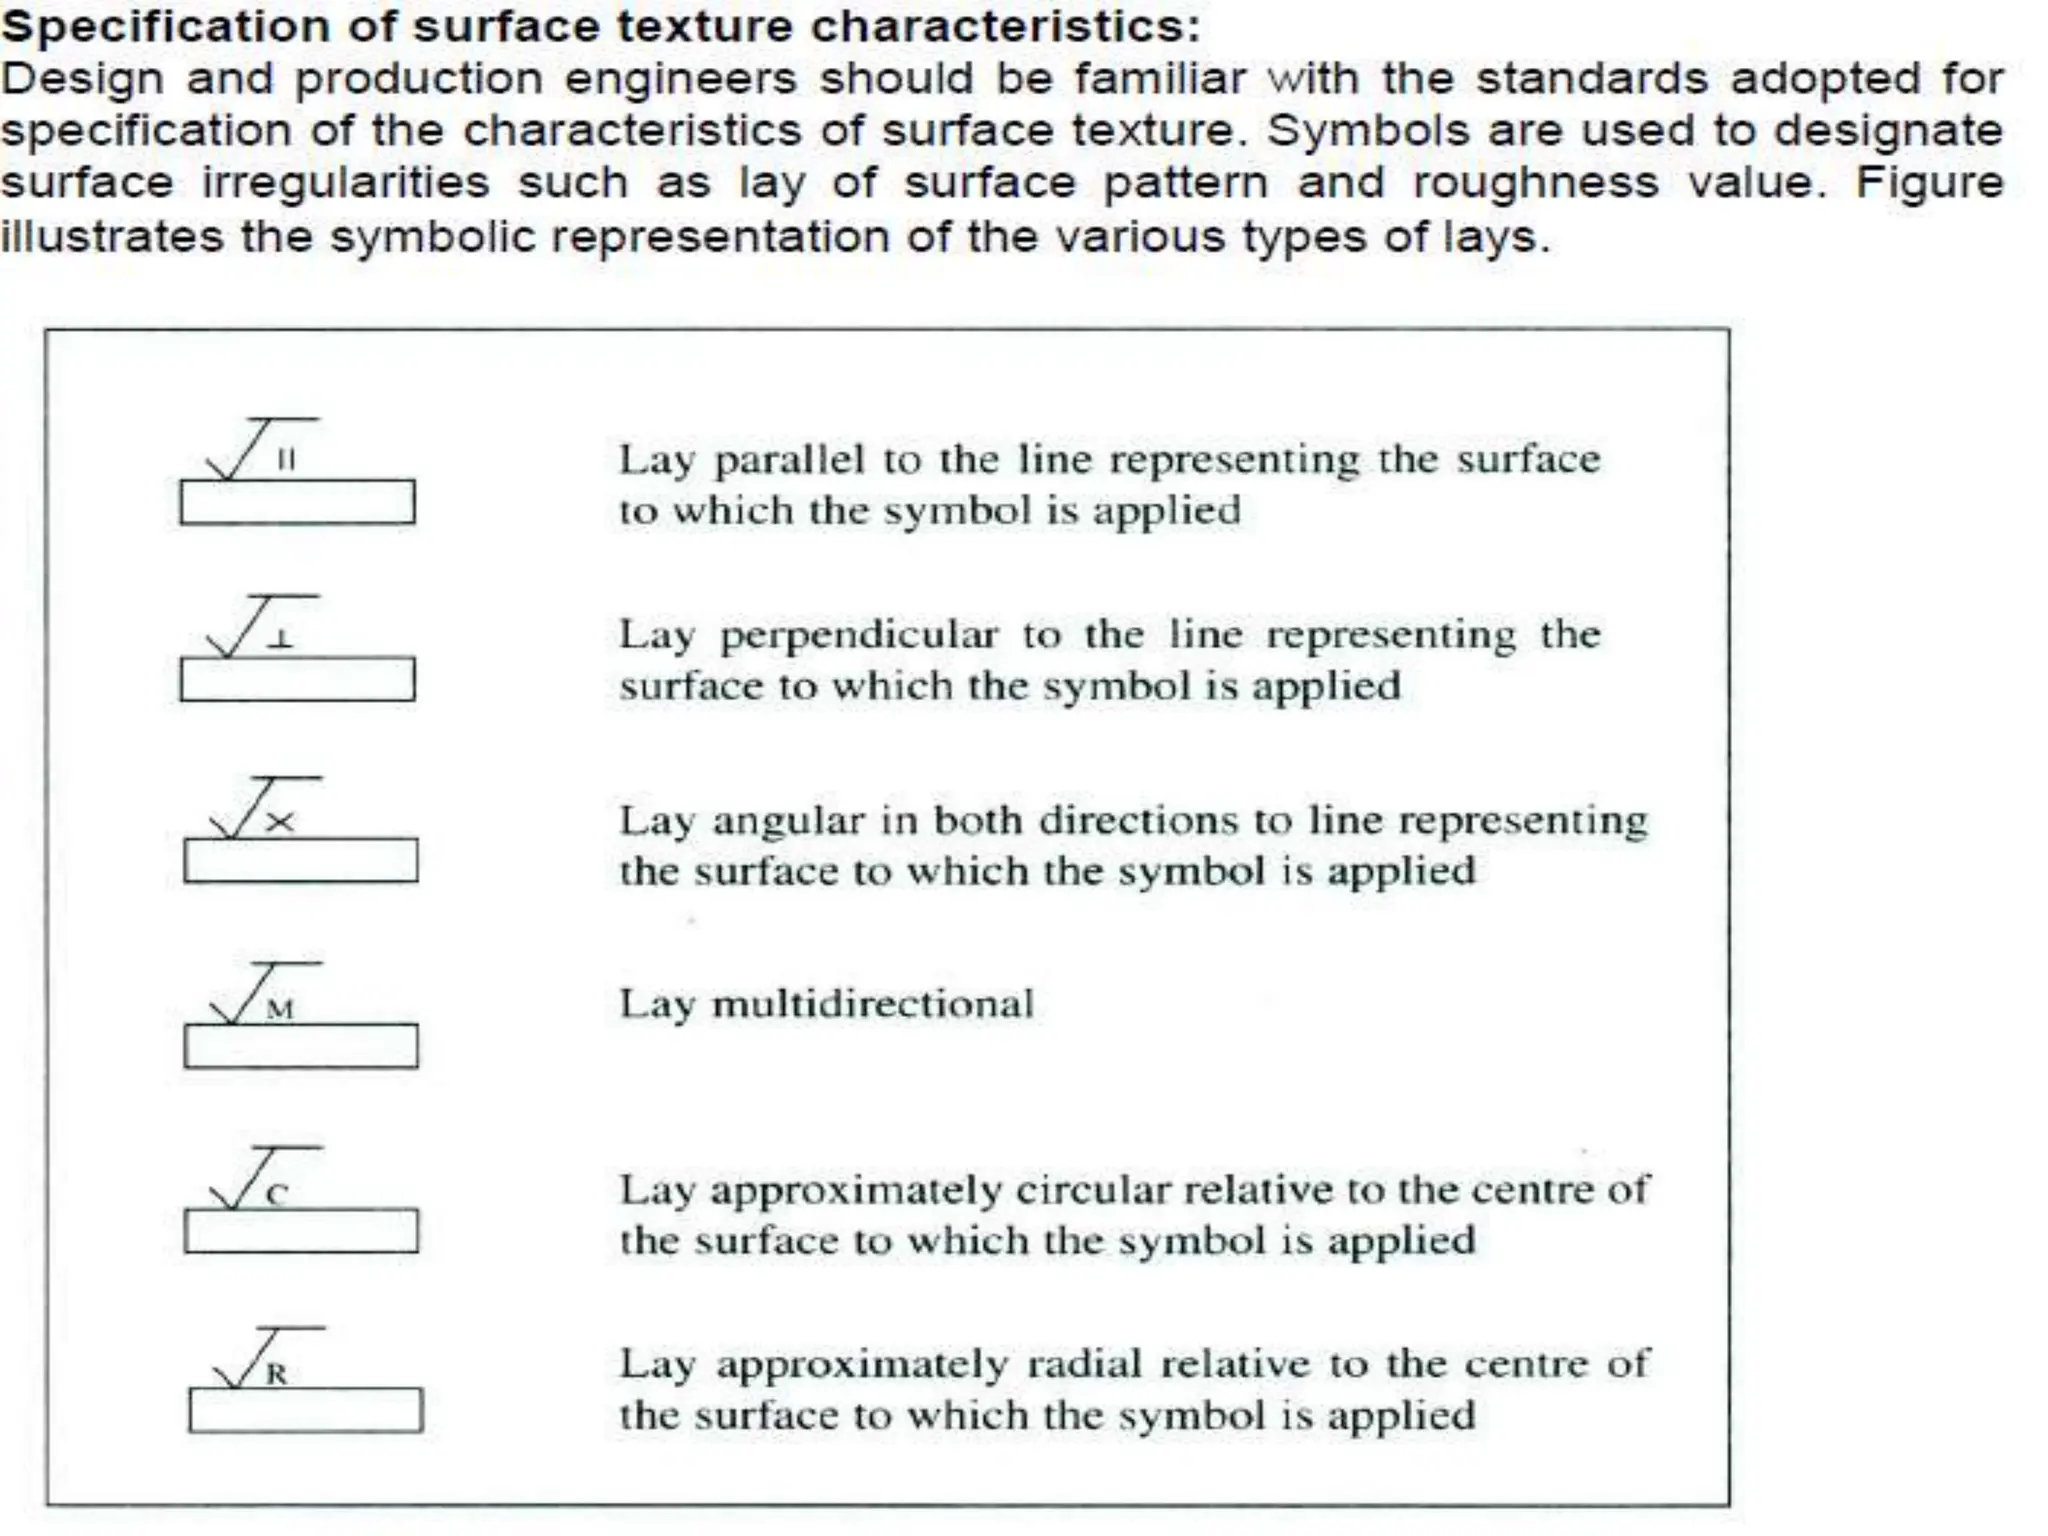
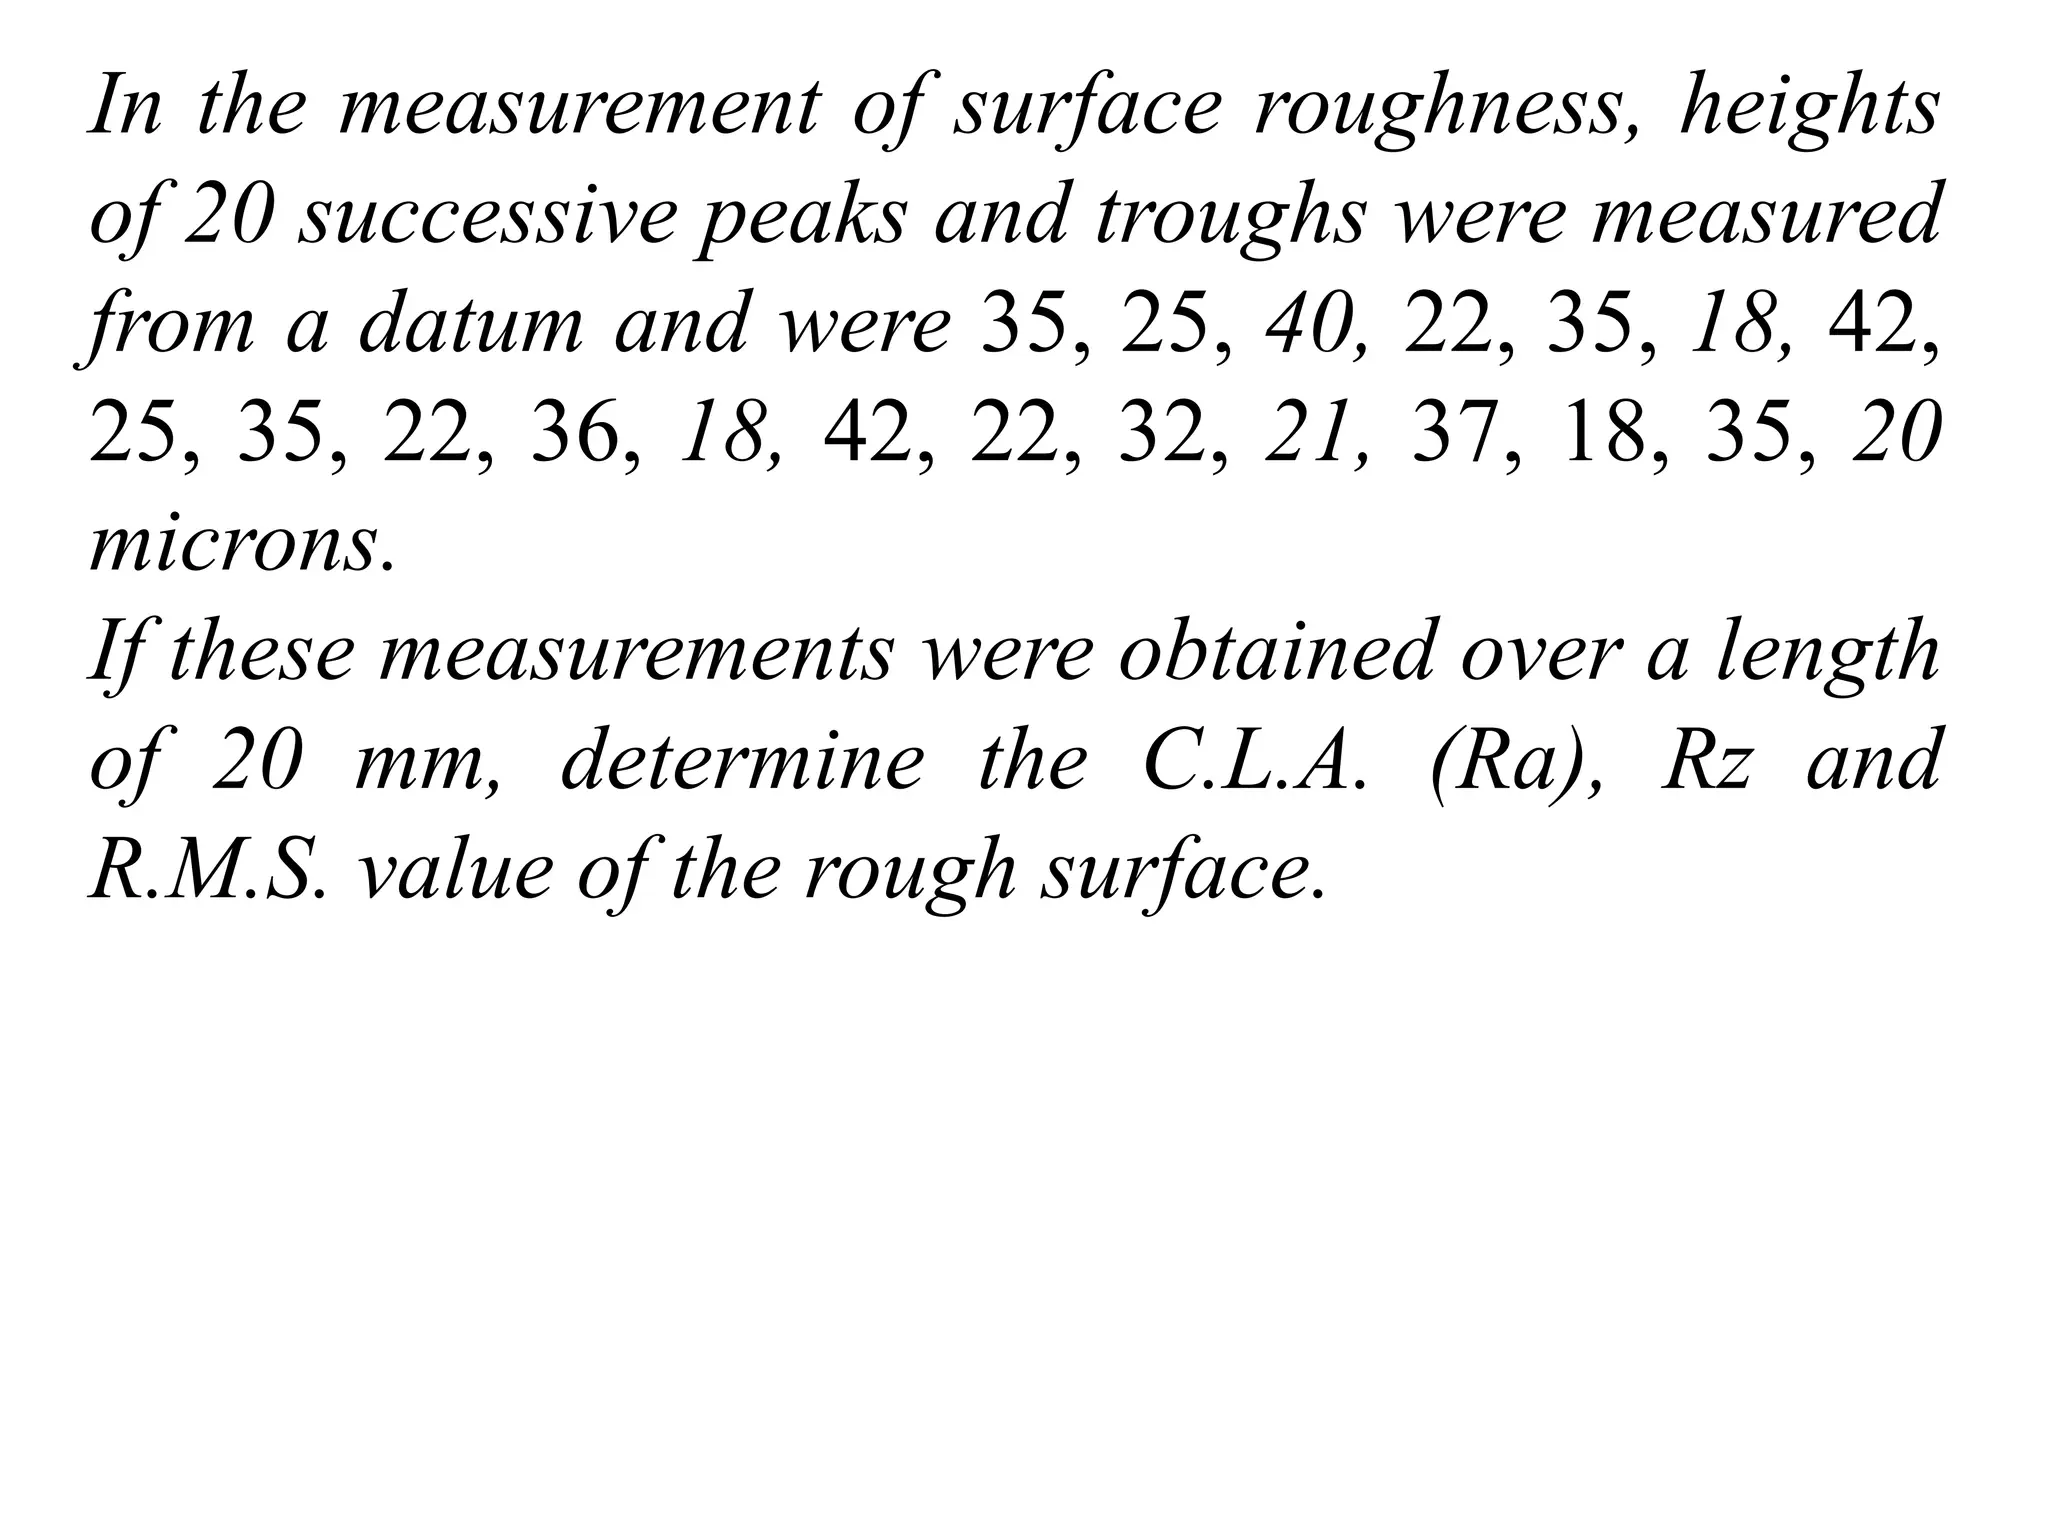
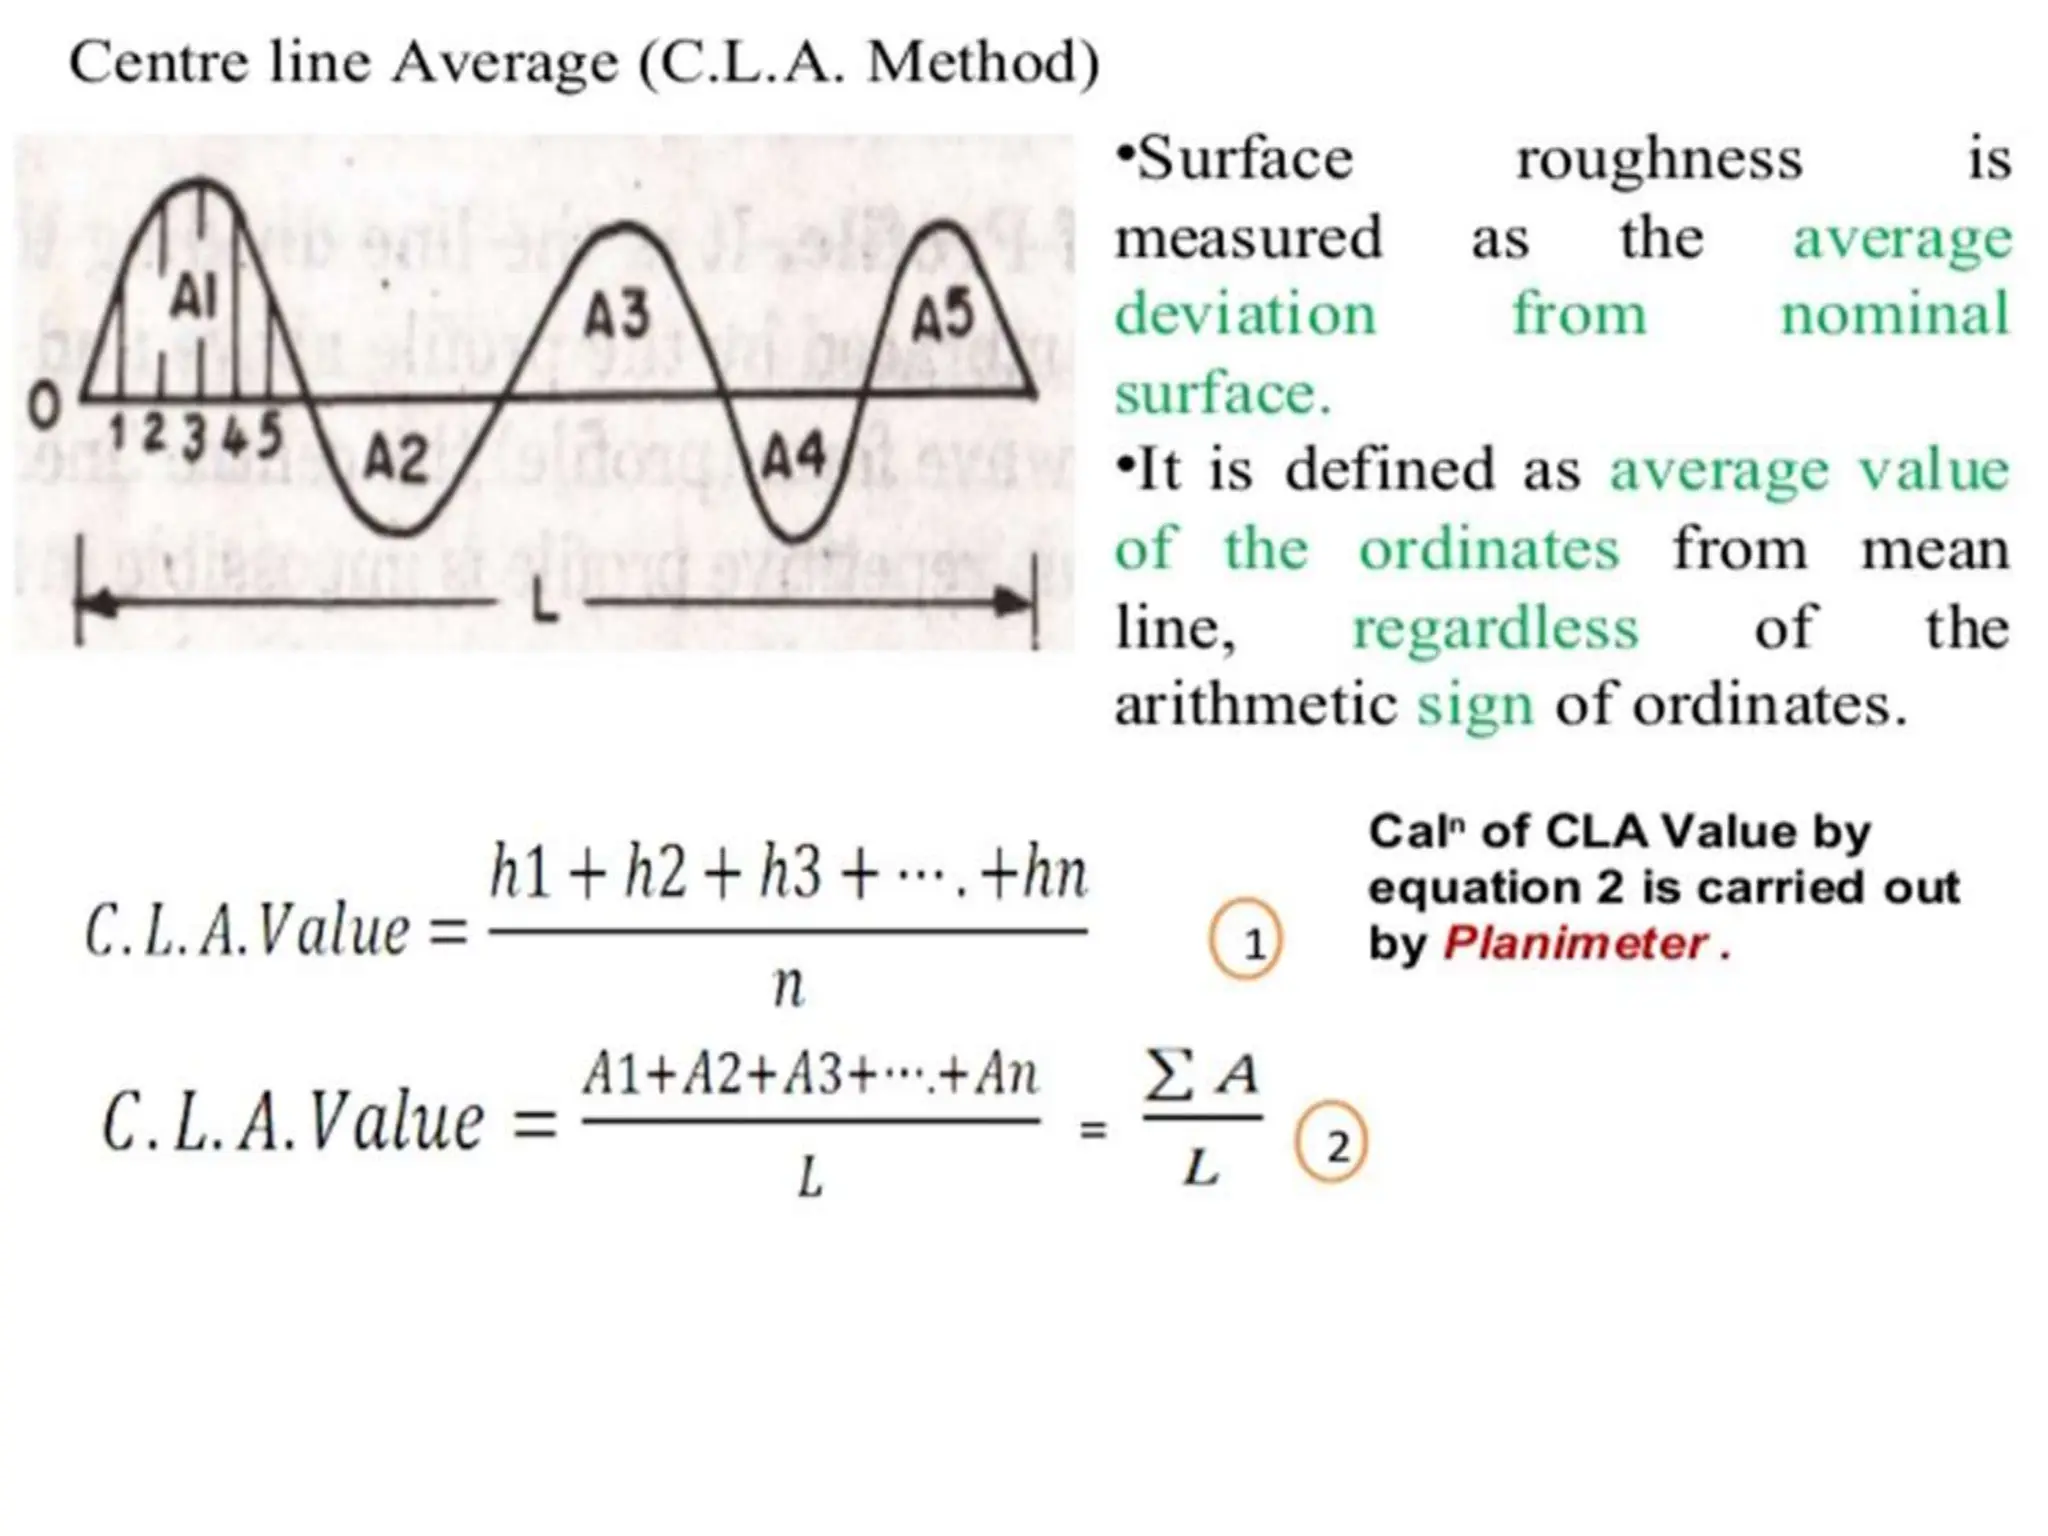
METROLOGY
MEASUREMENT OF
SURFACE TEXTURE
Meaning of Surface Texture
Definitions
Usually the concept of surface roughness is sensory
and it is capable of being understood in an intuitive
way. Generally the surface roughness has been
experienced and understood by the sense of light and
touch etc.
Therefore, to define surface roughness in terms of
measurable attributes presents great difficulties. The
definition of surface roughness could probably be best
understood on a causative basis and independent of
intuition
Terminology as per Indian Standards
Surface Texture/Surface Finish/Surface Topography:
Repetitive or random deviations from the nominal surface (true flat
surface) which form the pattern of the surface. Surface texture includes
roughness, waviness, lay and flaws.
Surface Roughness/Roughness:
It is a component of surface texture.
It concerns all those irregularities which form surface relief and which
are conventionally defined within the area where deviations of “form”
and “waviness” are eliminated.
Note : We will understand the terms Waviness, Forms, Roughness, lay, flaws, etc in the coming
slides.
Any material being machined by chip removal process
can't be finished perfectly due to some departures from
ideal conditions as envisaged by the designer. Due to
conditions not being ideal, the surface produced will
have some irregularities; and these geometrical
irregularities could be classified into four categories.
First Order.
This includes the irregularities arising out of
inaccuracies in the machine tool itself e.g. lack
of straightness of guideways on which tool post
is moving. This includes the surface irregularities
arising due to deformation of work under the
action of cutting forces and the weight of the
material itself.
Second Order.
Some irregularities are caused due to vibrations
of any kind such as chatter marks and are
included in second order.
Third Order.
Even if the machine were perfect and completely
free of vibrations, some irregularities are caused
by machining itself due to characteristic of the
process. This also includes the feed marks of the
cutting tool.
Fourth Order.
This includes the irregularities arising from the
rupture of the material during the separation of
the chip.
First group includes irregularities of small wavelength
caused by the direct action of the cutting element on the
material or by some other disturbance such as friction,
wear, or corrosion.
These errors are chiefly caused due to tool feed rate and
due to tool chatter, i.e. it includes irregularities of third and
fourth order and constitutes the micro geometrical errors.
Errors in this group are referred to as Roughness or
Primary Texture
Further these irregularities of four orders can
be grouped under two groups:
Second group includes irregularities of considerable wave-
length of a periodic character resulting from mechanical
disturbances in the generating set-up. These errors are
termed as macro-geometrical errors and include
irregularities of first and second order and are mainly due to
misalignment of centres, lack of straightness of guide-ways
and non-linear feed motion. These errors are also referred to
as Waviness or secondary texture
First Order Second Order Third Order Fourth Order
First Group
Micro geometrical
error
Roughness
Primary Texture
Second Group
Macro geometrical
error
Waviness
Secondary Texture
Surface Irregularities
Primary Texture (Roughness) :
It is caused due to the irregularities in the surface
roughness which result from the inherent action
of the production process. These are deemed to
include transverse feed-marks and the
irregularities within them.
Secondary Texture (Waviness):
It results from the factors such as machine or
work deflections, vibrations, chatter, heat
treatment or warping strains. Waviness is the
component of surface roughness upon which
roughness is superimposed.
Primary Texture (Roughness) : Secondary Texture (Waviness):
It is caused due to the
irregularities in the surface
roughness which result
from the inherent action of
the production process.
It results from the factors
such as machine or work
deflections, vibrations,
chatter, heat treatment or
warping strains.
These are deemed to
include transverse feed-
marks and the
irregularities within them.
Waviness is the
component of surface
roughness upon which
roughness is
superimposed.
Lay
Lay represent the direction of
predominant surface pattern produced
and it reflects the machining operation
used to produce it
Roughness Height : It is the height of the irregularities with respect to a reference
line. It is measured in millimeters or microns. It is also known as the height of
unevenness.
Roughness Width : It is the distance parallel to the nominal surface between
successive peaks or ridges which constitute the predominant pattern of the roughness.
It is measured in millimeters
Roughness Width Cut off : It is the greatest spacing of respective surface
irregularities to be included in the measurement of the average roughness height. It
should always be greater than the roughness width in order to obtain the total
roughness height rating.
Terms used in connection with
Surface Finish
Flaws:
Flaws are irregularities which occur at one place or at relatively infrequent or widely varying
intervals in a surface (like scratches, cracks, random blemishes, etc).
Waviness width is the distance between
the two successive peaks or ridges of the
predominant surface pattern, which is measured
in a direction parallel to the surface.
Form: This is the general shape of the surface, ignoring variations due to roughness and
waviness. Deviation from the desired form can be caused by many factors. For example, the part
being held too firmly or not firmly enough, inaccuracies of slides or guide ways of machines, or
due to stress patterns in the component.
Waviness Height is the peak-to-
valley distance of the surface profile,
measured in millimetres.
Sample Length: After the data has been filtered with a cut-off, we then sample it.
Breaking the data in to equal sample lengths does sampling. The sample lengths have
the same numeric value as the cut-off. In other words, if you use a 0.8mm cut-off then
the filtered data will be broken down in to 0.8mm sample lengths. These sample
lengths are chosen in such a way that a good statistical analysis can be made of the
surface. In most cases, five or six sample lengths are used for analysis.
SURFACE ROUGHNESS RANGE/SYMBOL
Ra
μm
0.025 0.05 0.1 0.2 0.4 0.8 1.6 3.2 6.3 12.5 25 50
N-Grade N1 N2 N3 N4 N5 N6 N7 N8 N9 N10 N11 N12
Triangular
Indication
Finish
Lapping/Super
finishing
Ground Finishes Smooth Turned Medium Turned Rough Machined
22
Traversing length:
Is the length of the profile necessary for the
evaluation of the surface roughness parameters.
The traversing length may include one or more
sampling lengths.
Sampling length (l):
Is the length of profile necessary for the evaluation of the
irregularities to be taken into account. This is also known
as the “cut-off” length in regard to the measuring
instruments.
It is measured in a direction parallel to the general
direction of the profile. It is very difficult to specify any
value for spacing (i.e. the length over which the surface
profile is to be considered).
However, for majority of engineering work, value of 0.8
mm is generally considered to be quite satisfactory for
instrument cut-off and upper limit of 25 mm is
commonly accepted as suitable for most waviness
measurements.
Mean line of the profile:
Is the line having the form of the geometrical profile and dividing the
effective profile so that within the sampling length the sum of the squares
of distances (y1 y2, ... Yn) between effective points and the mean line is
a minimum.
Demonstration of variation of mean line with an
example for understanding purpose
Mean line lowered by 1 unit
results in higher average
Ideal Mean line for the given condition
Centre line of profile: The line about which roughness is measured.
It is the line parallel to the general direction of the profile for which the
areas embraced by the profile above and below the line are equal.
When the waveform is repetitive, the mean line and the centre line are
equivalent.
PARAMETERS USED TO QUANTIFY
SURFACE ROUGHNESS
Arithmetical mean deviation from the mean line
of profile (Ra):
Is defined as the average value of the ordinates
(y1 y2,…. ,yn )from the mean line.
The ordinates are summed up without
considering their algebraic signs, i.e.
0
1 l
a
R y dx
n
 
Approximately : 0
n
i
a
y
R
n


where n is the no. of divisions over the sampling
length l.
Ra readings serve well for surface finish control in most
instances. It may be mentioned that Ra provides an
average reading and several different surfaces can have
same average, i.e. although Ra readings may be
approximately same, the surfaces will function quite
differently. Thus, more knowledge of the surface texture
is required.
The Ra measurement does not give a true picture of
the real surface profile
For instance, measurement of peak heights may be needed
in painting, plating and glass applications, to control the
pitting of gear teeth, improve seals between surfaces and
increase the stiffness of press fits.
Is defined as the average
difference between the
five highest peaks and the
five deepest valleys
within the sampling
length measured from a
line, parallel to the mean
line and not crossing the
profile.
   
2 4 6 8 1
1 3 5 7 9 0
5
z
R R R R
R
R
R R R R R
    
   

Ten point height of irregularities (Rz)
Stylus Probe Instruments.
Consists of the following units:
(i) A skid or shoe which is
drawn slowly over the
surface either by hand or by
motor drive.
(ii) A stylus or probe which moves over the
surface with the skid.
The skid when moved over the surface, follows its
general contours and provides a datum for the
measurements.
(iii) An amplifying device for magnifying the
stylus movement and an indicator.
(iv) A recording device to produce a trace or
record of the surface profile. Usually the vertical
movement is magnified more in comparison to
horizontal movement, thus the record will not
give the actual picture of surface roughness but a
distorted trace obtained.
(v) A means for analyzing the trace is obtained:
The analysis can be done separately or some
automatic device may be incorporated in the
instrument for analysis
The Taylor-Hobson
“Talysurf”
Note: In the exam students are
required to draw both sketches.
Indicating surface roughness on drawings
Roughness
grade number
Roughness value
Ra
(m)
Roughness
symbol
N12 50
~
N11 25

N10 12.5
N9 6.3

N8 3.2
N7 1.6
N6 0.8

N5 0.4
N4 0.2
N3 0.1

N2 0.05
N1 0.025
Indicating lay on drawings
Straight
Criss Cross Straight
Criss Cross Arcuate
(shaped like a bow; curved)
Circular
Parallel to the plane of projection of the view in which
the symbol is used
Approximately radial relative to the centre of the surface
to which the symbols applied.
Approximately circular relative to the centre of the
surface to which the symbol is applied
Multi-directional
Crossed in two slant directions with regard to the plane
of projection of the view in which the symbol is used.
Perpendicular to the plane of projection of the view in
which the symbol is used.
In the measurement of surface roughness, heights
of 20 successive peaks and troughs were measured
from a datum and were 35, 25, 40, 22, 35, 18, 42,
25, 35, 22, 36, 18, 42, 22, 32, 21, 37, 18, 35, 20
microns.
If these measurements were obtained over a length
of 20 mm, determine the C.L.A. (Ra), Rz and
R.M.S. value of the rough surface.
(35+40+35+42+35)-(25+22+18+25+22)
5
Rz = 75/5= 15m
   
2 4 6 8 1
1 3 5 7 9 0
5
z
R R R R
R
R
R R R R R
    
   

0
n
i
a
y
R
n


Adopt this
(35+40+35+42+35)-(25+22+18+25+22)
5
Rz = 75/5= 15m
Adopt this
   
2 4 6 8 1
1 3 5 7 9 0
5
z
R R R R
R
R
R R R R R
    
   

0
n
i
a
y
R
n


Calculate the CLA (Ra) value of a surface for
which the sampling length was 0.8 mm.
The graph was drawn to a vertical magnification
of 10,000 and a horizontal magnification of 100.
and the areas above and below the datum line
were :
Above : 150 170 150 120 mm2
Below : 80 60 80 40 mm2
The C.L.A. or Ra
value is given by
2
( ) 1000 1
( )
Sum of areas mm
Sampling length mm Vertical magnification Horizontal magnification
 
2
150 80 170 40 80 60 150 120 850
Sum of areas mm
        
850 1000 1
. . .
0.8 10,00 0
1.06
0 10
C L A or Ra value m

    
Ignore the conversion factor (1000) and follow traditional unit
conversion method

SURFACE TEXTURE 2022.pptx .

  • 1.
  • 2.
    Meaning of SurfaceTexture Definitions Usually the concept of surface roughness is sensory and it is capable of being understood in an intuitive way. Generally the surface roughness has been experienced and understood by the sense of light and touch etc. Therefore, to define surface roughness in terms of measurable attributes presents great difficulties. The definition of surface roughness could probably be best understood on a causative basis and independent of intuition
  • 3.
    Terminology as perIndian Standards Surface Texture/Surface Finish/Surface Topography: Repetitive or random deviations from the nominal surface (true flat surface) which form the pattern of the surface. Surface texture includes roughness, waviness, lay and flaws. Surface Roughness/Roughness: It is a component of surface texture. It concerns all those irregularities which form surface relief and which are conventionally defined within the area where deviations of “form” and “waviness” are eliminated. Note : We will understand the terms Waviness, Forms, Roughness, lay, flaws, etc in the coming slides.
  • 4.
    Any material beingmachined by chip removal process can't be finished perfectly due to some departures from ideal conditions as envisaged by the designer. Due to conditions not being ideal, the surface produced will have some irregularities; and these geometrical irregularities could be classified into four categories.
  • 5.
    First Order. This includesthe irregularities arising out of inaccuracies in the machine tool itself e.g. lack of straightness of guideways on which tool post is moving. This includes the surface irregularities arising due to deformation of work under the action of cutting forces and the weight of the material itself. Second Order. Some irregularities are caused due to vibrations of any kind such as chatter marks and are included in second order.
  • 7.
    Third Order. Even ifthe machine were perfect and completely free of vibrations, some irregularities are caused by machining itself due to characteristic of the process. This also includes the feed marks of the cutting tool. Fourth Order. This includes the irregularities arising from the rupture of the material during the separation of the chip.
  • 9.
    First group includesirregularities of small wavelength caused by the direct action of the cutting element on the material or by some other disturbance such as friction, wear, or corrosion. These errors are chiefly caused due to tool feed rate and due to tool chatter, i.e. it includes irregularities of third and fourth order and constitutes the micro geometrical errors. Errors in this group are referred to as Roughness or Primary Texture Further these irregularities of four orders can be grouped under two groups:
  • 10.
    Second group includesirregularities of considerable wave- length of a periodic character resulting from mechanical disturbances in the generating set-up. These errors are termed as macro-geometrical errors and include irregularities of first and second order and are mainly due to misalignment of centres, lack of straightness of guide-ways and non-linear feed motion. These errors are also referred to as Waviness or secondary texture
  • 11.
    First Order SecondOrder Third Order Fourth Order First Group Micro geometrical error Roughness Primary Texture Second Group Macro geometrical error Waviness Secondary Texture Surface Irregularities
  • 12.
    Primary Texture (Roughness): It is caused due to the irregularities in the surface roughness which result from the inherent action of the production process. These are deemed to include transverse feed-marks and the irregularities within them. Secondary Texture (Waviness): It results from the factors such as machine or work deflections, vibrations, chatter, heat treatment or warping strains. Waviness is the component of surface roughness upon which roughness is superimposed.
  • 13.
    Primary Texture (Roughness): Secondary Texture (Waviness): It is caused due to the irregularities in the surface roughness which result from the inherent action of the production process. It results from the factors such as machine or work deflections, vibrations, chatter, heat treatment or warping strains. These are deemed to include transverse feed- marks and the irregularities within them. Waviness is the component of surface roughness upon which roughness is superimposed.
  • 15.
    Lay Lay represent thedirection of predominant surface pattern produced and it reflects the machining operation used to produce it Roughness Height : It is the height of the irregularities with respect to a reference line. It is measured in millimeters or microns. It is also known as the height of unevenness. Roughness Width : It is the distance parallel to the nominal surface between successive peaks or ridges which constitute the predominant pattern of the roughness. It is measured in millimeters Roughness Width Cut off : It is the greatest spacing of respective surface irregularities to be included in the measurement of the average roughness height. It should always be greater than the roughness width in order to obtain the total roughness height rating.
  • 16.
    Terms used inconnection with Surface Finish
  • 17.
    Flaws: Flaws are irregularitieswhich occur at one place or at relatively infrequent or widely varying intervals in a surface (like scratches, cracks, random blemishes, etc). Waviness width is the distance between the two successive peaks or ridges of the predominant surface pattern, which is measured in a direction parallel to the surface. Form: This is the general shape of the surface, ignoring variations due to roughness and waviness. Deviation from the desired form can be caused by many factors. For example, the part being held too firmly or not firmly enough, inaccuracies of slides or guide ways of machines, or due to stress patterns in the component. Waviness Height is the peak-to- valley distance of the surface profile, measured in millimetres.
  • 18.
    Sample Length: Afterthe data has been filtered with a cut-off, we then sample it. Breaking the data in to equal sample lengths does sampling. The sample lengths have the same numeric value as the cut-off. In other words, if you use a 0.8mm cut-off then the filtered data will be broken down in to 0.8mm sample lengths. These sample lengths are chosen in such a way that a good statistical analysis can be made of the surface. In most cases, five or six sample lengths are used for analysis.
  • 20.
    SURFACE ROUGHNESS RANGE/SYMBOL Ra μm 0.0250.05 0.1 0.2 0.4 0.8 1.6 3.2 6.3 12.5 25 50 N-Grade N1 N2 N3 N4 N5 N6 N7 N8 N9 N10 N11 N12 Triangular Indication Finish Lapping/Super finishing Ground Finishes Smooth Turned Medium Turned Rough Machined 22
  • 21.
    Traversing length: Is thelength of the profile necessary for the evaluation of the surface roughness parameters. The traversing length may include one or more sampling lengths.
  • 22.
    Sampling length (l): Isthe length of profile necessary for the evaluation of the irregularities to be taken into account. This is also known as the “cut-off” length in regard to the measuring instruments. It is measured in a direction parallel to the general direction of the profile. It is very difficult to specify any value for spacing (i.e. the length over which the surface profile is to be considered). However, for majority of engineering work, value of 0.8 mm is generally considered to be quite satisfactory for instrument cut-off and upper limit of 25 mm is commonly accepted as suitable for most waviness measurements.
  • 23.
    Mean line ofthe profile: Is the line having the form of the geometrical profile and dividing the effective profile so that within the sampling length the sum of the squares of distances (y1 y2, ... Yn) between effective points and the mean line is a minimum.
  • 24.
    Demonstration of variationof mean line with an example for understanding purpose Mean line lowered by 1 unit results in higher average Ideal Mean line for the given condition
  • 25.
    Centre line ofprofile: The line about which roughness is measured. It is the line parallel to the general direction of the profile for which the areas embraced by the profile above and below the line are equal. When the waveform is repetitive, the mean line and the centre line are equivalent.
  • 26.
    PARAMETERS USED TOQUANTIFY SURFACE ROUGHNESS Arithmetical mean deviation from the mean line of profile (Ra): Is defined as the average value of the ordinates (y1 y2,…. ,yn )from the mean line. The ordinates are summed up without considering their algebraic signs, i.e. 0 1 l a R y dx n  
  • 27.
    Approximately : 0 n i a y R n   wheren is the no. of divisions over the sampling length l. Ra readings serve well for surface finish control in most instances. It may be mentioned that Ra provides an average reading and several different surfaces can have same average, i.e. although Ra readings may be approximately same, the surfaces will function quite differently. Thus, more knowledge of the surface texture is required.
  • 28.
    The Ra measurementdoes not give a true picture of the real surface profile
  • 29.
    For instance, measurementof peak heights may be needed in painting, plating and glass applications, to control the pitting of gear teeth, improve seals between surfaces and increase the stiffness of press fits.
  • 30.
    Is defined asthe average difference between the five highest peaks and the five deepest valleys within the sampling length measured from a line, parallel to the mean line and not crossing the profile.     2 4 6 8 1 1 3 5 7 9 0 5 z R R R R R R R R R R R           Ten point height of irregularities (Rz)
  • 32.
    Stylus Probe Instruments. Consistsof the following units: (i) A skid or shoe which is drawn slowly over the surface either by hand or by motor drive. (ii) A stylus or probe which moves over the surface with the skid. The skid when moved over the surface, follows its general contours and provides a datum for the measurements.
  • 33.
    (iii) An amplifyingdevice for magnifying the stylus movement and an indicator. (iv) A recording device to produce a trace or record of the surface profile. Usually the vertical movement is magnified more in comparison to horizontal movement, thus the record will not give the actual picture of surface roughness but a distorted trace obtained. (v) A means for analyzing the trace is obtained: The analysis can be done separately or some automatic device may be incorporated in the instrument for analysis
  • 35.
    The Taylor-Hobson “Talysurf” Note: Inthe exam students are required to draw both sketches.
  • 36.
    Indicating surface roughnesson drawings Roughness grade number Roughness value Ra (m) Roughness symbol N12 50 ~ N11 25  N10 12.5 N9 6.3  N8 3.2 N7 1.6 N6 0.8  N5 0.4 N4 0.2 N3 0.1  N2 0.05 N1 0.025
  • 37.
    Indicating lay ondrawings Straight Criss Cross Straight Criss Cross Arcuate (shaped like a bow; curved) Circular
  • 38.
    Parallel to theplane of projection of the view in which the symbol is used Approximately radial relative to the centre of the surface to which the symbols applied. Approximately circular relative to the centre of the surface to which the symbol is applied Multi-directional Crossed in two slant directions with regard to the plane of projection of the view in which the symbol is used. Perpendicular to the plane of projection of the view in which the symbol is used.
  • 42.
    In the measurementof surface roughness, heights of 20 successive peaks and troughs were measured from a datum and were 35, 25, 40, 22, 35, 18, 42, 25, 35, 22, 36, 18, 42, 22, 32, 21, 37, 18, 35, 20 microns. If these measurements were obtained over a length of 20 mm, determine the C.L.A. (Ra), Rz and R.M.S. value of the rough surface.
  • 43.
    (35+40+35+42+35)-(25+22+18+25+22) 5 Rz = 75/5=15m     2 4 6 8 1 1 3 5 7 9 0 5 z R R R R R R R R R R R           0 n i a y R n   Adopt this
  • 44.
    (35+40+35+42+35)-(25+22+18+25+22) 5 Rz = 75/5=15m Adopt this     2 4 6 8 1 1 3 5 7 9 0 5 z R R R R R R R R R R R           0 n i a y R n  
  • 46.
    Calculate the CLA(Ra) value of a surface for which the sampling length was 0.8 mm. The graph was drawn to a vertical magnification of 10,000 and a horizontal magnification of 100. and the areas above and below the datum line were : Above : 150 170 150 120 mm2 Below : 80 60 80 40 mm2
  • 47.
    The C.L.A. orRa value is given by 2 ( ) 1000 1 ( ) Sum of areas mm Sampling length mm Vertical magnification Horizontal magnification   2 150 80 170 40 80 60 150 120 850 Sum of areas mm          850 1000 1 . . . 0.8 10,00 0 1.06 0 10 C L A or Ra value m       Ignore the conversion factor (1000) and follow traditional unit conversion method