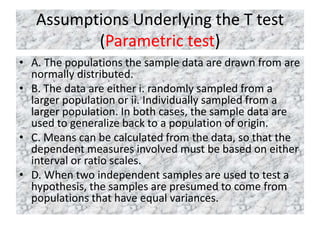
MEAN COMPARISON 1: THE t
TEST
THE t TEST
Desmond Ayim-Aboagye, Ph.D.
THE t TEST
• How to make inferences from sample data
when the samples are small and the variability
of the larger population is unknown.
William A Gosset (1876-1937)
• Statistical test
• 1. Enabling the brewery to detect differences
between grains and hops
• 2. Kegs of beer
• Prior to this objective analysis of such problems
was difficult
• -- Is one strain of barley superior to another?
• -- Is one batch of beer darker in color or richer in
flavor than a separate batch?
•
The t Test
• Sample statistics to make inferences about
population characteristics
• A. Mean ˉX
• B. Standard deviation s
• T test examines differences existing between
two means only
Three Variations of the t Test
• 1. One variation of the t test is used for hypothesis
testing about a sample mean when relevant population
mean (𝜇) and standard deviation (𝜎) are unknown.
• 2. It is specifically designed to detect significant
differences between a control group and an
experimental group in any classic two-group
randomized experiment.
• 3. The t test for dependent groups enables an
investigator to demonstrate the presence of
measurable change in the average attitudes or
behavior of a group from one point in time (𝑡𝑖𝑚𝑒₁ ) to
another time (𝑡𝑖𝑚𝑒₂)
U? Xs
A One-Sample t Test
Is X from a different population than 𝜇?
𝜇1 𝜇2
X1
S1
X2
S2
Control
G
Experi
mental
G
Is X1 different from X2? That is, is X1 from a different population than X2 after exposure to the indep. variable?
X1
S1
X2
S2
𝜇1 𝜇2
Treatme
nt
Is X1 different from X2? That is, following treatment, is X1 from a different population than X2?
T and Z Distributions: Any
relationship?
• 1. Use a Z test to detect mean differences
when 𝜎 𝑖𝑠 known; otherwise, use one of the
three t test variables.
• 2. The Z distribution provides unreliable
estimates of differences between samples
when the number of available observations is
less than 30.
The t Distribution
• The T distributions are sampling distributions of
means designed for use with small samples. Any t
distribution has a mean of 0 and a standard
deviation that decreases as the available degrees
of freedom or number of observations increase.
• T tests are used to compare one or two sample
means– but not more than two.
• Both the Z and T distributions test hypotheses
involving either one or two sample means, but no
more than two.
Assumptions Underlying the T test
(Parametric test)
• A. The populations the sample data are drawn from are
normally distributed.
• B. The data are either i. randomly sampled from a
larger population or ii. Individually sampled from a
larger population. In both cases, the sample data are
used to generalize back to a population of origin.
• C. Means can be calculated from the data, so that the
dependent measures involved must be based on either
interval or ratio scales.
• D. When two independent samples are used to test a
hypothesis, the samples are presumed to come from
populations that have equal variances.
A Robust Statistical Test
• A statistical test is described as robust when it
provides reasonably valid portrayals of data
(and relationships therein) when some of the
test‘s assumptions are not met during its
application.
Larger values of t, which point to
significant mean differences
• The difference between means is relatively large, and
this difference serves as the numerator for calculating
any t statistic
• The standard deviation, which is used to estimate the
standard error of the difference means, is relatively
small. As the denominator for the t statistic, a smaller
standard error will result in larger value of t.
• As always, the larger sample sizes are desirable
because they lead to smaller standard deviations,
which in turn leads to a smaller standard error for the
difference between the means.
Mean differences
• A t test detects a significant difference
between means when the difference is large,
the sample standard deviation is small, and/or
the sample size is large.
Hypothesis Testing with t: One-Sample
Case
• Similar formula for t test and z test
• Difference exist:
• Denominator in the t test is estimated standard
error of the mean (sX) [whereas]
• Denominator of the z test is the standard error of
the population (𝜎𝑋)
• T or z = observed sample mean – popul. mean
• estimated or known standard error
• Symbolically: t = X- 𝜇
• sX
One-Sample t test
• The single or one-sample t test is used to
compare the observed mean of one sample
with a hypothesized value assumed to
represent a population. One-sample t tests are
usually employed by researchers who want to
determine if some set of scores or
observations deviate from some established
pattern or standard.
Write Up the Result
• “ A one-sample t test found that the training
group of 20 students displayed a significantly
higher recall for digits (M = 10.0, SD = 2.5)
compared to the average recall, said to be
around 7 digits, t (19) = 5.37, p < .05.“
• t (df) = t calculated, p < 𝛼.
• No significant
• t(df) = t calculated, p = p.
Confidence Intervals(One sample t
test)
• Computational formula X ±𝑡 𝑐𝑟𝑖𝑡 (sX)
• Critical value of t at the .05, therefore 95%
• Ie., training project (1- 𝛼 = 1- .05 = 95%)
• Known sample mean 10, the two tailed critical value of t at .05 level 2.093,
and the error of the mean .559 are all entered into the formula
• 10 ±2.093 (.559)
• Lower limit of confidence interval
• 10 ±2.093 (.559)
• 10 – 1.17 = 8.83
• Upper limit of confidence interval
• 10 + 1.17 = 11.17
• Means representing mean digits appear interval ranging between 8.83
and 11.17.
• Limitations: 1. unknown parent population, 2. small sample
Hypothesis Testing with Two
independent Samples
• The independent groups t test is ideal for
hypothesis testing within experiments, as an
experimental group can be compared to a
control group.
Class Test on t test
• 1. A Robust test is one that applies to many different
types of data. TRUE or FALSE
• 2. One of the assumptions of the t test is that means
are based on interval or ratio scales of measurement.
TRUE or FALSE
• 3. The t tests are used to compare one or two sample
means– but not more than two. TRUE or FALSE.
• T test is parametric statistic. That is an inferential test
that , prior to its use, assumes that certain specific
characteristics are true of a population. TRUE or FALSE
• 5. Briefly state or describe the essential characteristics
of T distributions.

The t test mean comparison 1

  • 1.
    MEAN COMPARISON 1:THE t TEST THE t TEST Desmond Ayim-Aboagye, Ph.D.
  • 2.
    THE t TEST •How to make inferences from sample data when the samples are small and the variability of the larger population is unknown.
  • 3.
    William A Gosset(1876-1937) • Statistical test • 1. Enabling the brewery to detect differences between grains and hops • 2. Kegs of beer • Prior to this objective analysis of such problems was difficult • -- Is one strain of barley superior to another? • -- Is one batch of beer darker in color or richer in flavor than a separate batch? •
  • 4.
    The t Test •Sample statistics to make inferences about population characteristics • A. Mean ˉX • B. Standard deviation s • T test examines differences existing between two means only
  • 5.
    Three Variations ofthe t Test • 1. One variation of the t test is used for hypothesis testing about a sample mean when relevant population mean (𝜇) and standard deviation (𝜎) are unknown. • 2. It is specifically designed to detect significant differences between a control group and an experimental group in any classic two-group randomized experiment. • 3. The t test for dependent groups enables an investigator to demonstrate the presence of measurable change in the average attitudes or behavior of a group from one point in time (𝑡𝑖𝑚𝑒₁ ) to another time (𝑡𝑖𝑚𝑒₂)
  • 6.
    U? Xs A One-Samplet Test Is X from a different population than 𝜇?
  • 7.
    𝜇1 𝜇2 X1 S1 X2 S2 Control G Experi mental G Is X1different from X2? That is, is X1 from a different population than X2 after exposure to the indep. variable?
  • 8.
    X1 S1 X2 S2 𝜇1 𝜇2 Treatme nt Is X1different from X2? That is, following treatment, is X1 from a different population than X2?
  • 9.
    T and ZDistributions: Any relationship? • 1. Use a Z test to detect mean differences when 𝜎 𝑖𝑠 known; otherwise, use one of the three t test variables. • 2. The Z distribution provides unreliable estimates of differences between samples when the number of available observations is less than 30.
  • 10.
    The t Distribution •The T distributions are sampling distributions of means designed for use with small samples. Any t distribution has a mean of 0 and a standard deviation that decreases as the available degrees of freedom or number of observations increase. • T tests are used to compare one or two sample means– but not more than two. • Both the Z and T distributions test hypotheses involving either one or two sample means, but no more than two.
  • 11.
    Assumptions Underlying theT test (Parametric test) • A. The populations the sample data are drawn from are normally distributed. • B. The data are either i. randomly sampled from a larger population or ii. Individually sampled from a larger population. In both cases, the sample data are used to generalize back to a population of origin. • C. Means can be calculated from the data, so that the dependent measures involved must be based on either interval or ratio scales. • D. When two independent samples are used to test a hypothesis, the samples are presumed to come from populations that have equal variances.
  • 12.
    A Robust StatisticalTest • A statistical test is described as robust when it provides reasonably valid portrayals of data (and relationships therein) when some of the test‘s assumptions are not met during its application.
  • 13.
    Larger values oft, which point to significant mean differences • The difference between means is relatively large, and this difference serves as the numerator for calculating any t statistic • The standard deviation, which is used to estimate the standard error of the difference means, is relatively small. As the denominator for the t statistic, a smaller standard error will result in larger value of t. • As always, the larger sample sizes are desirable because they lead to smaller standard deviations, which in turn leads to a smaller standard error for the difference between the means.
  • 14.
    Mean differences • At test detects a significant difference between means when the difference is large, the sample standard deviation is small, and/or the sample size is large.
  • 15.
    Hypothesis Testing witht: One-Sample Case • Similar formula for t test and z test • Difference exist: • Denominator in the t test is estimated standard error of the mean (sX) [whereas] • Denominator of the z test is the standard error of the population (𝜎𝑋) • T or z = observed sample mean – popul. mean • estimated or known standard error • Symbolically: t = X- 𝜇 • sX
  • 16.
    One-Sample t test •The single or one-sample t test is used to compare the observed mean of one sample with a hypothesized value assumed to represent a population. One-sample t tests are usually employed by researchers who want to determine if some set of scores or observations deviate from some established pattern or standard.
  • 17.
    Write Up theResult • “ A one-sample t test found that the training group of 20 students displayed a significantly higher recall for digits (M = 10.0, SD = 2.5) compared to the average recall, said to be around 7 digits, t (19) = 5.37, p < .05.“ • t (df) = t calculated, p < 𝛼. • No significant • t(df) = t calculated, p = p.
  • 18.
    Confidence Intervals(One samplet test) • Computational formula X ±𝑡 𝑐𝑟𝑖𝑡 (sX) • Critical value of t at the .05, therefore 95% • Ie., training project (1- 𝛼 = 1- .05 = 95%) • Known sample mean 10, the two tailed critical value of t at .05 level 2.093, and the error of the mean .559 are all entered into the formula • 10 ±2.093 (.559) • Lower limit of confidence interval • 10 ±2.093 (.559) • 10 – 1.17 = 8.83 • Upper limit of confidence interval • 10 + 1.17 = 11.17 • Means representing mean digits appear interval ranging between 8.83 and 11.17. • Limitations: 1. unknown parent population, 2. small sample
  • 19.
    Hypothesis Testing withTwo independent Samples • The independent groups t test is ideal for hypothesis testing within experiments, as an experimental group can be compared to a control group.
  • 20.
    Class Test ont test • 1. A Robust test is one that applies to many different types of data. TRUE or FALSE • 2. One of the assumptions of the t test is that means are based on interval or ratio scales of measurement. TRUE or FALSE • 3. The t tests are used to compare one or two sample means– but not more than two. TRUE or FALSE. • T test is parametric statistic. That is an inferential test that , prior to its use, assumes that certain specific characteristics are true of a population. TRUE or FALSE • 5. Briefly state or describe the essential characteristics of T distributions.