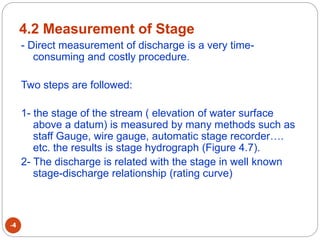
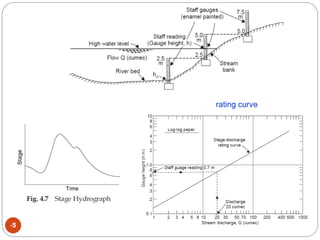
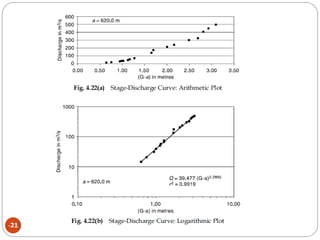
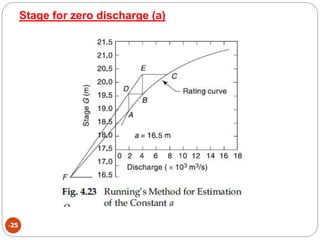
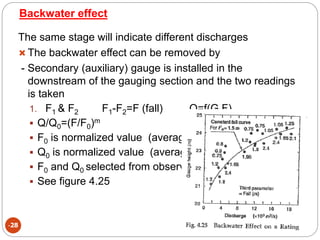
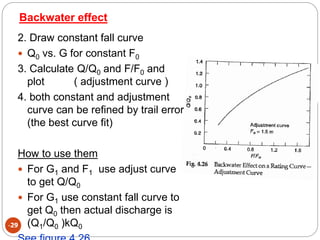
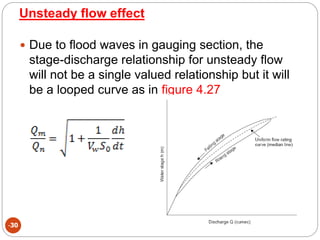
SlideShare a Scribd company logo
1 of 31
CHAPTER FOUR
Stream flow measurement
-1
Engineering Hydrology
(ECIV 4323)
Instructor:
Dr. Yunes Mogheir
2015
-2
- Surface water hydrology deals with the
movement of water a long earth’s surface as
a result of precipitation and snow melt
- Knowledge of quantity and quality of stream
flow is a request of municipal, industrial,
agricultural and other water supply projects.
- The water flowing in stream is measured as
discharge of water with a unit of volume
(m3/sec, cubic of feet per second – cfs)
4.1 Introduction
Stream Measurements
-3
1) Direct measurement of stream
- Area-velocity methods
- Dilution techniques
- Electromagnetic methods
- Ultrasonic method
2) Indirect measurement of stream
- Hydraulic structure such as weir, flumes and gated
structure
- Slope area method
4.2 Measurement of Stage
-4
- Direct measurement of discharge is a very time-
consuming and costly procedure.
Two steps are followed:
1- the stage of the stream ( elevation of water surface
above a datum) is measured by many methods such as
staff Gauge, wire gauge, automatic stage recorder….
etc. the results is stage hydrograph (Figure 4.7).
2- The discharge is related with the stage in well known
stage-discharge relationship (rating curve)
-5
rating curve
4.3 Measurement of Velocity
(Horizontal Axes Meter)
-6
4.4 Area-velocity method
(direct method)
-7
 Figure 4.14 and Example 4.1
 Velocity is measured at 0.6 of the depth
 For the first and last sections
 For the rest of segment
4.4 Area-velocity method
(direct method)
-8
 Figure 4.14 and Example 4.1
4.4 Area-velocity method
(direct method)
-9
4.4 Area-velocity method
(direct method)
-10
4.8 indirect method
-11
- Make use of the relation between the discharge and
the flow discharge and the depths at specified
locations.
1. Flow measuring structures (weirs, flume…etc)
2. Slope area methods
For flow measuring structures the discharge Q is a function
of the water-surface elevation measured at specified
location
Q=f(H)
4.8 indirect method
Slope- Area method
-12
- The Manning equation
Where
Q = discharge (m3/s)
n = Manning’s roughness coefficient (range between 0.01 and 0.75)
A = cross-section area (m2)
R = the hydraulic radius, equal to the area divided by the wetted
perimeter (m)
S = the head loss per unit length of the channel, approximated by
the channel slope
R=A/P
P = witted parameter
-13
 See Figure 4.21
 Applying energy equation to section 1 and 2
 Z1+Y1+V1
2/(2g)= Z2+Y2+V2
2/(2g)+hl
 h1 = Z1+Y1
 h2 = Z2+Y2
 hl (head losses) = he + hf
-14
he = eddy loss
hf = frictional losses
 h1+ V1
2/(2g)= h2+ V2
2/(2g)+ he + hf
he = ke|V1
2/(2g)-V2
2/(2g)|
ke = eddy loss coefficient
hf = (h1- h2)+(V1
2/(2g)- V2
2/(2g)-he
4.8 indirect method
Slope- Area method
-15
For uniform coefficient
 L= length of the section
 hf/L = Sf = energy slope = Q2/k2
 k = conveyance of the channel = 1/n A R2/3
 where n is manning roughness coefficient
 K = (K1K2)0.5 for different cross sections A1 and A2
For non-uniform flow
 an average conveyance is used for hf/L = Sf = energy slope
= Q2/k2
 where previous equation and continuity equation can be
used to estimate discharge Q (known value of h, cross-
section properties and n)
 Q=A1V1=A2V2
Procedure (tries and errors)
-16
1. Assumed v1=v2
2. Calculate Q by using Q = k S0.5
3. Compute v1 = Q1A1 v2 = Q2A2
4. Refine the value of h2 and then repeat step 2
until Q or hf were very close
(see Example 4.3)
Example 4.3
-17
-18
4.9 Stage Discharge Relationship
-19
 Measuring the discharge in direct method
requires two steps:
1. Measuring the stage (G) and discharge.
2. Prepare a stage discharge (rating curve)
 For a gauging section of the channel, the
measured values of discharge are plotted
against the corresponding stages.
 The flow can be control by G-Q curve when:
1. G-Q is constant with time (permanent)
2. G-Q is vary with time (shifting control)
Permanent control
-20
 Most of streams and rivers follow the permanent
type and the G-Q curve can be represented by:
 Q = stream discharge
 G = gauge height
 a = a constant of stage at zero discharge
 Cr & B = rating constants
 See Figure 4.22 a and b
-21
Permanent control
-22
 Straight lines is drown in logarithmic plot for (G-Q)
 Then Cr & B can be determined by the least
square error method
 For the best fit of N. observation, by regression
analysis (use excel or other programs) or eq. 4.28
(a&b)
 r correlation coefficient is 1 for perfect fit
 0.6 – 1 can be considered as good correlation
Stage for zero discharge (a)
-23
 It is hypothetical parameter and can’t be
measured
Method 1
 Plot Q vs. G on arithmetic scale
 Draw the best fit curve
 Select the value of (a) where Q = 0
 Use (a) value and verify wither the data at
log(Q) vs. log(G-a) indicate a straight line
 Trial and error find acceptable value of (a)
Stage for zero discharge (a)
-24
Method 2 (Running’s Method)
 Plot Q&G on arithmetic scale and select the
best fit curve
 Select three points (A,B and C) as
 Draw vertical lines from (A,B and C) and
horizontal lines from (B and C)
 Two straight lines ED and BA intersect at F
See figure 4.23
Stage for zero discharge (a)
-25
Stage for zero discharge (a)
-26
 Method 3 (eq. 4.30)
 See example 4.4
Shifting controls (optional)
-27
Change of stage discharge with time due to:
1. the changing characteristics of channel
2. aggradations or degradation of alluvial channel
3. variable backwater effect (the gauging section)
4. unsteady flow effects (rapidly change stage)
For 1 & 2 it is recommended to update rating
curves frequently
For 3 & 4 shifting control is recommended
Backwater effect
-28
The same stage will indicate different discharges
 The backwater effect can be removed by
- Secondary (auxiliary) gauge is installed in the
downstream of the gauging section and the two readings
is taken
1. F1 & F2 F1-F2=F (fall) Q=f(G,F)
 Q/Q0=(F/F0)m
 F0 is normalized value (average)
 Q0 is normalized value (average)
 F0 and Q0 selected from observation
 See figure 4.25
Backwater effect
-29
2. Draw constant fall curve
 Q0 vs. G for constant F0
3. Calculate Q/Q0 and F/F0 and
plot ( adjustment curve )
4. both constant and adjustment
curve can be refined by trail error
(the best curve fit)
How to use them
 For G1 and F1 use adjust curve
to get Q/Q0
 For G1 use constant fall curve to
get Q0 then actual discharge is
(Q1/Q0 )kQ0
Unsteady flow effect
-30
 Due to flood waves in gauging section, the
stage-discharge relationship for unsteady flow
will not be a single valued relationship but it will
be a looped curve as in figure 4.27
Unsteady flow effect
-31
 Qn = normal discharge at steady uniform flow
 Qm = actual measured for unsteady flow
 S0 = Chanel slope
 dh/dt = rate of change of stage (field data)
 Vw = velocity of flow wave (=1.4 V) where V is the
average velocity estimated by manning formula
 Qm/Qn is calculated based on the value of dh/dt

More Related Content

What's hot

S curve hydrograph
S curve hydrographS curve hydrograph
S curve hydrographSatish Taji
 
Unit 3 INFILTRATION
Unit 3 INFILTRATIONUnit 3 INFILTRATION
Unit 3 INFILTRATIONParimal Jha
 
Infiltration equations and index
Infiltration equations and indexInfiltration equations and index
Infiltration equations and indexTharun Reddy
 
Class lecture on Hydrology by Rabindra Ranjan saha Lecture 13
Class lecture on Hydrology by Rabindra Ranjan saha Lecture 13Class lecture on Hydrology by Rabindra Ranjan saha Lecture 13
Class lecture on Hydrology by Rabindra Ranjan saha Lecture 13World University of Bangladesh
 
Rapidly varied flow
Rapidly varied flowRapidly varied flow
Rapidly varied flowMood Naik
 
Critical flow through an Open channel
Critical flow through an Open channelCritical flow through an Open channel
Critical flow through an Open channelAjoy Kumar Saha
 
Flood estimation
Flood estimation Flood estimation
Flood estimation RAJ BAIRWA
 
Stream flow measurement
Stream flow measurementStream flow measurement
Stream flow measurementMOHIT MAYOOR
 
Introduction, hydrologic cycle, climate and water m1
Introduction, hydrologic cycle, climate and water m1Introduction, hydrologic cycle, climate and water m1
Introduction, hydrologic cycle, climate and water m1Bibhabasu Mohanty
 
Irrigation engineering
Irrigation engineeringIrrigation engineering
Irrigation engineeringNagma Modi
 
Runoff computation by infiltration indices
Runoff computation by infiltration indicesRunoff computation by infiltration indices
Runoff computation by infiltration indicesSagar Vekariya
 

What's hot (20)

Hydrology
HydrologyHydrology
Hydrology
 
Infiltration
InfiltrationInfiltration
Infiltration
 
Flood routing
Flood routingFlood routing
Flood routing
 
Precipitation and rain gauges
Precipitation and rain gaugesPrecipitation and rain gauges
Precipitation and rain gauges
 
S curve hydrograph
S curve hydrographS curve hydrograph
S curve hydrograph
 
Unit 3 INFILTRATION
Unit 3 INFILTRATIONUnit 3 INFILTRATION
Unit 3 INFILTRATION
 
Infiltration equations and index
Infiltration equations and indexInfiltration equations and index
Infiltration equations and index
 
Runoff & Flood Frequency Analysis
Runoff & Flood Frequency AnalysisRunoff & Flood Frequency Analysis
Runoff & Flood Frequency Analysis
 
Stream Gauging
Stream GaugingStream Gauging
Stream Gauging
 
Evaporation
EvaporationEvaporation
Evaporation
 
Class lecture on Hydrology by Rabindra Ranjan saha Lecture 13
Class lecture on Hydrology by Rabindra Ranjan saha Lecture 13Class lecture on Hydrology by Rabindra Ranjan saha Lecture 13
Class lecture on Hydrology by Rabindra Ranjan saha Lecture 13
 
Rapidly varied flow
Rapidly varied flowRapidly varied flow
Rapidly varied flow
 
Critical flow through an Open channel
Critical flow through an Open channelCritical flow through an Open channel
Critical flow through an Open channel
 
5 Reservoir Planning
5 Reservoir Planning5 Reservoir Planning
5 Reservoir Planning
 
Flood estimation
Flood estimation Flood estimation
Flood estimation
 
Surface runoff
Surface runoffSurface runoff
Surface runoff
 
Stream flow measurement
Stream flow measurementStream flow measurement
Stream flow measurement
 
Introduction, hydrologic cycle, climate and water m1
Introduction, hydrologic cycle, climate and water m1Introduction, hydrologic cycle, climate and water m1
Introduction, hydrologic cycle, climate and water m1
 
Irrigation engineering
Irrigation engineeringIrrigation engineering
Irrigation engineering
 
Runoff computation by infiltration indices
Runoff computation by infiltration indicesRunoff computation by infiltration indices
Runoff computation by infiltration indices
 

Similar to Streamflow-measurement.ppt

Open channel flow equation
Open channel flow equationOpen channel flow equation
Open channel flow equationMrinmoy Majumder
 
groundwater flood routing presentationhazard.pptx
groundwater flood routing presentationhazard.pptxgroundwater flood routing presentationhazard.pptx
groundwater flood routing presentationhazard.pptxMDShohag54
 
CH2 Hydraulics and hydrology of HP.pptx
CH2 Hydraulics and hydrology of HP.pptxCH2 Hydraulics and hydrology of HP.pptx
CH2 Hydraulics and hydrology of HP.pptxDawit Girma
 
hz alignment lec4.pdf
hz alignment lec4.pdfhz alignment lec4.pdf
hz alignment lec4.pdfamira525139
 
Unit 5 Fluid Mechanics
Unit 5 Fluid MechanicsUnit 5 Fluid Mechanics
Unit 5 Fluid MechanicsMalaysia
 
International Journal of Engineering Research and Development
International Journal of Engineering Research and DevelopmentInternational Journal of Engineering Research and Development
International Journal of Engineering Research and DevelopmentIJERD Editor
 
Extrapolation of Stage Discharge Rating Curve
Extrapolation of Stage Discharge Rating CurveExtrapolation of Stage Discharge Rating Curve
Extrapolation of Stage Discharge Rating CurveBiswajit Dey
 
Presentation 7 a ce 904 Hydrology by Rabindra Ranjan Saha, PEng
Presentation  7 a ce 904 Hydrology by Rabindra Ranjan Saha, PEngPresentation  7 a ce 904 Hydrology by Rabindra Ranjan Saha, PEng
Presentation 7 a ce 904 Hydrology by Rabindra Ranjan Saha, PEngWorld University of Bangladesh
 
SImulating Past Flood Event using Nays 2D Flood
SImulating Past Flood Event using Nays 2D FloodSImulating Past Flood Event using Nays 2D Flood
SImulating Past Flood Event using Nays 2D FloodPutika Ashfar Khoiri
 
Odemba ECE2304 Hydraulics1Lab
Odemba ECE2304 Hydraulics1LabOdemba ECE2304 Hydraulics1Lab
Odemba ECE2304 Hydraulics1LabWalumasi Odemba
 
Class lectures on hydrology by Rabindra Ranjan Saha, Lecture 8
Class lectures on hydrology by Rabindra Ranjan Saha, Lecture 8Class lectures on hydrology by Rabindra Ranjan Saha, Lecture 8
Class lectures on hydrology by Rabindra Ranjan Saha, Lecture 8World University of Bangladesh
 
(Part ii)- open channels
(Part ii)- open channels(Part ii)- open channels
(Part ii)- open channelsMohsin Siddique
 
Combiend curves of surveying
Combiend curves of surveyingCombiend curves of surveying
Combiend curves of surveyingShahIshani1996
 

Similar to Streamflow-measurement.ppt (20)

Chapter 4.pdf
Chapter 4.pdfChapter 4.pdf
Chapter 4.pdf
 
Presentation 4 ce 801 OCF by Rabindraa ranjan Saha
Presentation 4 ce 801 OCF by Rabindraa ranjan SahaPresentation 4 ce 801 OCF by Rabindraa ranjan Saha
Presentation 4 ce 801 OCF by Rabindraa ranjan Saha
 
Open channel flow equation
Open channel flow equationOpen channel flow equation
Open channel flow equation
 
groundwater flood routing presentationhazard.pptx
groundwater flood routing presentationhazard.pptxgroundwater flood routing presentationhazard.pptx
groundwater flood routing presentationhazard.pptx
 
CH2 Hydraulics and hydrology of HP.pptx
CH2 Hydraulics and hydrology of HP.pptxCH2 Hydraulics and hydrology of HP.pptx
CH2 Hydraulics and hydrology of HP.pptx
 
Paper_Horsley
Paper_HorsleyPaper_Horsley
Paper_Horsley
 
Chapter 3.pdf
Chapter 3.pdfChapter 3.pdf
Chapter 3.pdf
 
hz alignment lec4.pdf
hz alignment lec4.pdfhz alignment lec4.pdf
hz alignment lec4.pdf
 
Unit 5 Fluid Mechanics
Unit 5 Fluid MechanicsUnit 5 Fluid Mechanics
Unit 5 Fluid Mechanics
 
Lecture 6.pdf
Lecture 6.pdfLecture 6.pdf
Lecture 6.pdf
 
E1072850
E1072850E1072850
E1072850
 
International Journal of Engineering Research and Development
International Journal of Engineering Research and DevelopmentInternational Journal of Engineering Research and Development
International Journal of Engineering Research and Development
 
Extrapolation of Stage Discharge Rating Curve
Extrapolation of Stage Discharge Rating CurveExtrapolation of Stage Discharge Rating Curve
Extrapolation of Stage Discharge Rating Curve
 
Presentation 7 a ce 904 Hydrology by Rabindra Ranjan Saha, PEng
Presentation  7 a ce 904 Hydrology by Rabindra Ranjan Saha, PEngPresentation  7 a ce 904 Hydrology by Rabindra Ranjan Saha, PEng
Presentation 7 a ce 904 Hydrology by Rabindra Ranjan Saha, PEng
 
SImulating Past Flood Event using Nays 2D Flood
SImulating Past Flood Event using Nays 2D FloodSImulating Past Flood Event using Nays 2D Flood
SImulating Past Flood Event using Nays 2D Flood
 
Odemba ECE2304 Hydraulics1Lab
Odemba ECE2304 Hydraulics1LabOdemba ECE2304 Hydraulics1Lab
Odemba ECE2304 Hydraulics1Lab
 
Class lectures on hydrology by Rabindra Ranjan Saha, Lecture 8
Class lectures on hydrology by Rabindra Ranjan Saha, Lecture 8Class lectures on hydrology by Rabindra Ranjan Saha, Lecture 8
Class lectures on hydrology by Rabindra Ranjan Saha, Lecture 8
 
(Part ii)- open channels
(Part ii)- open channels(Part ii)- open channels
(Part ii)- open channels
 
Power2010_27048_Final
Power2010_27048_FinalPower2010_27048_Final
Power2010_27048_Final
 
Combiend curves of surveying
Combiend curves of surveyingCombiend curves of surveying
Combiend curves of surveying
 

Recently uploaded

Call Girls Narol 7397865700 Independent Call Girls
Call Girls Narol 7397865700 Independent Call GirlsCall Girls Narol 7397865700 Independent Call Girls
Call Girls Narol 7397865700 Independent Call Girlsssuser7cb4ff
 
Call Us ≽ 8377877756 ≼ Call Girls In Shastri Nagar (Delhi)
Call Us ≽ 8377877756 ≼ Call Girls In Shastri Nagar (Delhi)Call Us ≽ 8377877756 ≼ Call Girls In Shastri Nagar (Delhi)
Call Us ≽ 8377877756 ≼ Call Girls In Shastri Nagar (Delhi)dollysharma2066
 
Gfe Mayur Vihar Call Girls Service WhatsApp -> 9999965857 Available 24x7 ^ De...
Gfe Mayur Vihar Call Girls Service WhatsApp -> 9999965857 Available 24x7 ^ De...Gfe Mayur Vihar Call Girls Service WhatsApp -> 9999965857 Available 24x7 ^ De...
Gfe Mayur Vihar Call Girls Service WhatsApp -> 9999965857 Available 24x7 ^ De...srsj9000
 
Call Girls Delhi {Jodhpur} 9711199012 high profile service
Call Girls Delhi {Jodhpur} 9711199012 high profile serviceCall Girls Delhi {Jodhpur} 9711199012 high profile service
Call Girls Delhi {Jodhpur} 9711199012 high profile servicerehmti665
 
Internship report on mechanical engineering
Internship report on mechanical engineeringInternship report on mechanical engineering
Internship report on mechanical engineeringmalavadedarshan25
 
HARMONY IN THE HUMAN BEING - Unit-II UHV-2
HARMONY IN THE HUMAN BEING - Unit-II UHV-2HARMONY IN THE HUMAN BEING - Unit-II UHV-2
HARMONY IN THE HUMAN BEING - Unit-II UHV-2RajaP95
 
CCS355 Neural Network & Deep Learning Unit II Notes with Question bank .pdf
CCS355 Neural Network & Deep Learning Unit II Notes with Question bank .pdfCCS355 Neural Network & Deep Learning Unit II Notes with Question bank .pdf
CCS355 Neural Network & Deep Learning Unit II Notes with Question bank .pdfAsst.prof M.Gokilavani
 
complete construction, environmental and economics information of biomass com...
complete construction, environmental and economics information of biomass com...complete construction, environmental and economics information of biomass com...
complete construction, environmental and economics information of biomass com...asadnawaz62
 
IVE Industry Focused Event - Defence Sector 2024
IVE Industry Focused Event - Defence Sector 2024IVE Industry Focused Event - Defence Sector 2024
IVE Industry Focused Event - Defence Sector 2024Mark Billinghurst
 
Gurgaon ✡️9711147426✨Call In girls Gurgaon Sector 51 escort service
Gurgaon ✡️9711147426✨Call In girls Gurgaon Sector 51 escort serviceGurgaon ✡️9711147426✨Call In girls Gurgaon Sector 51 escort service
Gurgaon ✡️9711147426✨Call In girls Gurgaon Sector 51 escort servicejennyeacort
 
SPICE PARK APR2024 ( 6,793 SPICE Models )
SPICE PARK APR2024 ( 6,793 SPICE Models )SPICE PARK APR2024 ( 6,793 SPICE Models )
SPICE PARK APR2024 ( 6,793 SPICE Models )Tsuyoshi Horigome
 
main PPT.pptx of girls hostel security using rfid
main PPT.pptx of girls hostel security using rfidmain PPT.pptx of girls hostel security using rfid
main PPT.pptx of girls hostel security using rfidNikhilNagaraju
 
Introduction-To-Agricultural-Surveillance-Rover.pptx
Introduction-To-Agricultural-Surveillance-Rover.pptxIntroduction-To-Agricultural-Surveillance-Rover.pptx
Introduction-To-Agricultural-Surveillance-Rover.pptxk795866
 
chaitra-1.pptx fake news detection using machine learning
chaitra-1.pptx  fake news detection using machine learningchaitra-1.pptx  fake news detection using machine learning
chaitra-1.pptx fake news detection using machine learningmisbanausheenparvam
 
VIP Call Girls Service Hitech City Hyderabad Call +91-8250192130
VIP Call Girls Service Hitech City Hyderabad Call +91-8250192130VIP Call Girls Service Hitech City Hyderabad Call +91-8250192130
VIP Call Girls Service Hitech City Hyderabad Call +91-8250192130Suhani Kapoor
 
Oxy acetylene welding presentation note.
Oxy acetylene welding presentation note.Oxy acetylene welding presentation note.
Oxy acetylene welding presentation note.eptoze12
 

Recently uploaded (20)

Design and analysis of solar grass cutter.pdf
Design and analysis of solar grass cutter.pdfDesign and analysis of solar grass cutter.pdf
Design and analysis of solar grass cutter.pdf
 
Call Girls Narol 7397865700 Independent Call Girls
Call Girls Narol 7397865700 Independent Call GirlsCall Girls Narol 7397865700 Independent Call Girls
Call Girls Narol 7397865700 Independent Call Girls
 
Call Us ≽ 8377877756 ≼ Call Girls In Shastri Nagar (Delhi)
Call Us ≽ 8377877756 ≼ Call Girls In Shastri Nagar (Delhi)Call Us ≽ 8377877756 ≼ Call Girls In Shastri Nagar (Delhi)
Call Us ≽ 8377877756 ≼ Call Girls In Shastri Nagar (Delhi)
 
Gfe Mayur Vihar Call Girls Service WhatsApp -> 9999965857 Available 24x7 ^ De...
Gfe Mayur Vihar Call Girls Service WhatsApp -> 9999965857 Available 24x7 ^ De...Gfe Mayur Vihar Call Girls Service WhatsApp -> 9999965857 Available 24x7 ^ De...
Gfe Mayur Vihar Call Girls Service WhatsApp -> 9999965857 Available 24x7 ^ De...
 
Call Girls Delhi {Jodhpur} 9711199012 high profile service
Call Girls Delhi {Jodhpur} 9711199012 high profile serviceCall Girls Delhi {Jodhpur} 9711199012 high profile service
Call Girls Delhi {Jodhpur} 9711199012 high profile service
 
Internship report on mechanical engineering
Internship report on mechanical engineeringInternship report on mechanical engineering
Internship report on mechanical engineering
 
HARMONY IN THE HUMAN BEING - Unit-II UHV-2
HARMONY IN THE HUMAN BEING - Unit-II UHV-2HARMONY IN THE HUMAN BEING - Unit-II UHV-2
HARMONY IN THE HUMAN BEING - Unit-II UHV-2
 
CCS355 Neural Network & Deep Learning Unit II Notes with Question bank .pdf
CCS355 Neural Network & Deep Learning Unit II Notes with Question bank .pdfCCS355 Neural Network & Deep Learning Unit II Notes with Question bank .pdf
CCS355 Neural Network & Deep Learning Unit II Notes with Question bank .pdf
 
9953056974 Call Girls In South Ex, Escorts (Delhi) NCR.pdf
9953056974 Call Girls In South Ex, Escorts (Delhi) NCR.pdf9953056974 Call Girls In South Ex, Escorts (Delhi) NCR.pdf
9953056974 Call Girls In South Ex, Escorts (Delhi) NCR.pdf
 
complete construction, environmental and economics information of biomass com...
complete construction, environmental and economics information of biomass com...complete construction, environmental and economics information of biomass com...
complete construction, environmental and economics information of biomass com...
 
IVE Industry Focused Event - Defence Sector 2024
IVE Industry Focused Event - Defence Sector 2024IVE Industry Focused Event - Defence Sector 2024
IVE Industry Focused Event - Defence Sector 2024
 
Gurgaon ✡️9711147426✨Call In girls Gurgaon Sector 51 escort service
Gurgaon ✡️9711147426✨Call In girls Gurgaon Sector 51 escort serviceGurgaon ✡️9711147426✨Call In girls Gurgaon Sector 51 escort service
Gurgaon ✡️9711147426✨Call In girls Gurgaon Sector 51 escort service
 
SPICE PARK APR2024 ( 6,793 SPICE Models )
SPICE PARK APR2024 ( 6,793 SPICE Models )SPICE PARK APR2024 ( 6,793 SPICE Models )
SPICE PARK APR2024 ( 6,793 SPICE Models )
 
Call Us -/9953056974- Call Girls In Vikaspuri-/- Delhi NCR
Call Us -/9953056974- Call Girls In Vikaspuri-/- Delhi NCRCall Us -/9953056974- Call Girls In Vikaspuri-/- Delhi NCR
Call Us -/9953056974- Call Girls In Vikaspuri-/- Delhi NCR
 
main PPT.pptx of girls hostel security using rfid
main PPT.pptx of girls hostel security using rfidmain PPT.pptx of girls hostel security using rfid
main PPT.pptx of girls hostel security using rfid
 
Introduction-To-Agricultural-Surveillance-Rover.pptx
Introduction-To-Agricultural-Surveillance-Rover.pptxIntroduction-To-Agricultural-Surveillance-Rover.pptx
Introduction-To-Agricultural-Surveillance-Rover.pptx
 
young call girls in Green Park🔝 9953056974 🔝 escort Service
young call girls in Green Park🔝 9953056974 🔝 escort Serviceyoung call girls in Green Park🔝 9953056974 🔝 escort Service
young call girls in Green Park🔝 9953056974 🔝 escort Service
 
chaitra-1.pptx fake news detection using machine learning
chaitra-1.pptx  fake news detection using machine learningchaitra-1.pptx  fake news detection using machine learning
chaitra-1.pptx fake news detection using machine learning
 
VIP Call Girls Service Hitech City Hyderabad Call +91-8250192130
VIP Call Girls Service Hitech City Hyderabad Call +91-8250192130VIP Call Girls Service Hitech City Hyderabad Call +91-8250192130
VIP Call Girls Service Hitech City Hyderabad Call +91-8250192130
 
Oxy acetylene welding presentation note.
Oxy acetylene welding presentation note.Oxy acetylene welding presentation note.
Oxy acetylene welding presentation note.
 

Streamflow-measurement.ppt

  • 1. CHAPTER FOUR Stream flow measurement -1 Engineering Hydrology (ECIV 4323) Instructor: Dr. Yunes Mogheir 2015
  • 2. -2 - Surface water hydrology deals with the movement of water a long earth’s surface as a result of precipitation and snow melt - Knowledge of quantity and quality of stream flow is a request of municipal, industrial, agricultural and other water supply projects. - The water flowing in stream is measured as discharge of water with a unit of volume (m3/sec, cubic of feet per second – cfs) 4.1 Introduction
  • 3. Stream Measurements -3 1) Direct measurement of stream - Area-velocity methods - Dilution techniques - Electromagnetic methods - Ultrasonic method 2) Indirect measurement of stream - Hydraulic structure such as weir, flumes and gated structure - Slope area method
  • 4. 4.2 Measurement of Stage -4 - Direct measurement of discharge is a very time- consuming and costly procedure. Two steps are followed: 1- the stage of the stream ( elevation of water surface above a datum) is measured by many methods such as staff Gauge, wire gauge, automatic stage recorder…. etc. the results is stage hydrograph (Figure 4.7). 2- The discharge is related with the stage in well known stage-discharge relationship (rating curve)
  • 6. 4.3 Measurement of Velocity (Horizontal Axes Meter) -6
  • 7. 4.4 Area-velocity method (direct method) -7  Figure 4.14 and Example 4.1  Velocity is measured at 0.6 of the depth  For the first and last sections  For the rest of segment
  • 8. 4.4 Area-velocity method (direct method) -8  Figure 4.14 and Example 4.1
  • 11. 4.8 indirect method -11 - Make use of the relation between the discharge and the flow discharge and the depths at specified locations. 1. Flow measuring structures (weirs, flume…etc) 2. Slope area methods For flow measuring structures the discharge Q is a function of the water-surface elevation measured at specified location Q=f(H)
  • 12. 4.8 indirect method Slope- Area method -12 - The Manning equation Where Q = discharge (m3/s) n = Manning’s roughness coefficient (range between 0.01 and 0.75) A = cross-section area (m2) R = the hydraulic radius, equal to the area divided by the wetted perimeter (m) S = the head loss per unit length of the channel, approximated by the channel slope R=A/P P = witted parameter
  • 13. -13  See Figure 4.21  Applying energy equation to section 1 and 2  Z1+Y1+V1 2/(2g)= Z2+Y2+V2 2/(2g)+hl  h1 = Z1+Y1  h2 = Z2+Y2  hl (head losses) = he + hf
  • 14. -14 he = eddy loss hf = frictional losses  h1+ V1 2/(2g)= h2+ V2 2/(2g)+ he + hf he = ke|V1 2/(2g)-V2 2/(2g)| ke = eddy loss coefficient hf = (h1- h2)+(V1 2/(2g)- V2 2/(2g)-he
  • 15. 4.8 indirect method Slope- Area method -15 For uniform coefficient  L= length of the section  hf/L = Sf = energy slope = Q2/k2  k = conveyance of the channel = 1/n A R2/3  where n is manning roughness coefficient  K = (K1K2)0.5 for different cross sections A1 and A2 For non-uniform flow  an average conveyance is used for hf/L = Sf = energy slope = Q2/k2  where previous equation and continuity equation can be used to estimate discharge Q (known value of h, cross- section properties and n)  Q=A1V1=A2V2
  • 16. Procedure (tries and errors) -16 1. Assumed v1=v2 2. Calculate Q by using Q = k S0.5 3. Compute v1 = Q1A1 v2 = Q2A2 4. Refine the value of h2 and then repeat step 2 until Q or hf were very close (see Example 4.3)
  • 18. -18
  • 19. 4.9 Stage Discharge Relationship -19  Measuring the discharge in direct method requires two steps: 1. Measuring the stage (G) and discharge. 2. Prepare a stage discharge (rating curve)  For a gauging section of the channel, the measured values of discharge are plotted against the corresponding stages.  The flow can be control by G-Q curve when: 1. G-Q is constant with time (permanent) 2. G-Q is vary with time (shifting control)
  • 20. Permanent control -20  Most of streams and rivers follow the permanent type and the G-Q curve can be represented by:  Q = stream discharge  G = gauge height  a = a constant of stage at zero discharge  Cr & B = rating constants  See Figure 4.22 a and b
  • 21. -21
  • 22. Permanent control -22  Straight lines is drown in logarithmic plot for (G-Q)  Then Cr & B can be determined by the least square error method  For the best fit of N. observation, by regression analysis (use excel or other programs) or eq. 4.28 (a&b)  r correlation coefficient is 1 for perfect fit  0.6 – 1 can be considered as good correlation
  • 23. Stage for zero discharge (a) -23  It is hypothetical parameter and can’t be measured Method 1  Plot Q vs. G on arithmetic scale  Draw the best fit curve  Select the value of (a) where Q = 0  Use (a) value and verify wither the data at log(Q) vs. log(G-a) indicate a straight line  Trial and error find acceptable value of (a)
  • 24. Stage for zero discharge (a) -24 Method 2 (Running’s Method)  Plot Q&G on arithmetic scale and select the best fit curve  Select three points (A,B and C) as  Draw vertical lines from (A,B and C) and horizontal lines from (B and C)  Two straight lines ED and BA intersect at F See figure 4.23
  • 25. Stage for zero discharge (a) -25
  • 26. Stage for zero discharge (a) -26  Method 3 (eq. 4.30)  See example 4.4
  • 27. Shifting controls (optional) -27 Change of stage discharge with time due to: 1. the changing characteristics of channel 2. aggradations or degradation of alluvial channel 3. variable backwater effect (the gauging section) 4. unsteady flow effects (rapidly change stage) For 1 & 2 it is recommended to update rating curves frequently For 3 & 4 shifting control is recommended
  • 28. Backwater effect -28 The same stage will indicate different discharges  The backwater effect can be removed by - Secondary (auxiliary) gauge is installed in the downstream of the gauging section and the two readings is taken 1. F1 & F2 F1-F2=F (fall) Q=f(G,F)  Q/Q0=(F/F0)m  F0 is normalized value (average)  Q0 is normalized value (average)  F0 and Q0 selected from observation  See figure 4.25
  • 29. Backwater effect -29 2. Draw constant fall curve  Q0 vs. G for constant F0 3. Calculate Q/Q0 and F/F0 and plot ( adjustment curve ) 4. both constant and adjustment curve can be refined by trail error (the best curve fit) How to use them  For G1 and F1 use adjust curve to get Q/Q0  For G1 use constant fall curve to get Q0 then actual discharge is (Q1/Q0 )kQ0
  • 30. Unsteady flow effect -30  Due to flood waves in gauging section, the stage-discharge relationship for unsteady flow will not be a single valued relationship but it will be a looped curve as in figure 4.27
  • 31. Unsteady flow effect -31  Qn = normal discharge at steady uniform flow  Qm = actual measured for unsteady flow  S0 = Chanel slope  dh/dt = rate of change of stage (field data)  Vw = velocity of flow wave (=1.4 V) where V is the average velocity estimated by manning formula  Qm/Qn is calculated based on the value of dh/dt