Canal & canal types with design of channels by dj sir covered kennedy lacey t...Denish Jangid
Canal its types with design of channels by Denish Jangid sir.
covered kennedy lacey theory IS code method with comparison drawbacks.
design steps by kennedy
design steps by lacey
design of canal types of canal trapezoidal shape. Canal Irrigation. Subject-
Water Resources Engineering By Dr.* Denish Jangid Assistant Professor Civil Engineering Department
Canal Classification based on Financial returns
Canal Classification based on Use
Canal Classification based on Size
Cana Masonry work
alluvial soil
Cross regulator
Head regulator
Silt Control device
Silt ejector
Silt excluder
Factor affecting the Canal Alignment
A contour canal is an artificially-dug navigable canal which closely follows the contour line of the land it traverses in order to avoid costly engineering works such as boring a tunnel through higher ground, building an embankment over lower ground, or constructing a canal lock (or series of locks) to change the level of the canal. Because of this, these canals are characterized by their meandering course.
Step Determine the depth D and bed width B from values of A & P
Cost of construction including cross drainage works should be minimized. .A shorter length of canal ensures less loss of head due to friction and smaller loss of discharge due to seepage and evaporation, so that additional area may be brought under cultivation. A canal may be aligned as a contour canal, a side slope canal or a ridge canal according to the type of terrain and culturable area. A contour canal irrigate areas only on one side of the canal. Where canal crosses valleys, different types of cross drainage works are required. A side slope canal is aligned at 90 degree to the contours of the region. A watershed or ridge canal irrigate areas on both sides. Cross drainage works are eliminated in case of ridge and side slope. Main canal is generally carried on a contour alignment. Branch and distributaries take off from a canal from or near the points where the canal crosses the watershed. All possible alignments should be studied and the best suited alignment should be selected. Number of rinks and acute curves should be minimized. They should be aligned as far as possible in partial cutting partial filling. Deep cutting should be avoided by comparing the overall cost of alternative alignments.
Intensity-Duration-Frequency Curves and RegionalisationAM Publications
Storm sewers make up a large percentage of drainage system in an urban setup. The design of these
components are based on rainfall intensities of a specific design period for that location. These can be derived from
intensity-duration-frequency (IDF) relationship. These IDF relationships are derived from historical rainfall, using
an extreme value distribution for maximum rainfall intensity. In the present study the IDF curves and parameter
regionalisation were studied for various kinds of basins. These equation parameters can be then used to understand
the spatial variation of rainfall intensity in the study area. The parameter contour maps subsequently generated using
various interpolation method are then used for plotting IDF curves for any ungauged station in the basin.
The time required for the rain falling at the most distant point in the drainage area (i.e., on the fringe of the catchment ) to reach the concentration point is called the concentration time.
This is a very significant variable since only such storms of duration greater than the time of concentration will be able to produce runoff from the entire catchment area and cause high intensity floods.
The characteristics of the drainage net may be physically described by:
The number of streams
The length of streams
Stream density
Drainage density
The country’s annual renewable fresh water resources amount to some 122 BCM/yr in the twelve river basins.
However, only 3% remains in the country.
The rest, 97% is lost in runoff to the lowlands of neighboring countries.
Flow Equations for sluice gate.Introduces different flow equations to students which are widely utilized for the design of sluice gates connected to open channel.This tutorial will help to understand and articulate the basic flow equation utilized by designers all over the world.
A study on evacuation performance of sit type water closet by computational f...combi07
This study was undertaken to study the performance of the type of toilet seat by using CFD numerical methods to obtain the optimum flow rate to reduce water usage. Toilet seat has two main types which is siphon and washdown. The case is the model type of siphon and washdown, using a mixture of water and air as a medium to flush the toilet. The area is considered critical to all cases in the stagnant water inlet and outlet. The analysis result, shows that the type of siphon is better than the washdown for the both case. The comparison also show that (Siphon Type Water closet) second case has better performance than (Washdown Water Closet) the first case.
1
KNE351 Fluid Mechanics 1
Laboratory Notes
Broad-Crested Weir
This booklet contains instructions and notes for the experiment listed above.
Additional material relating to laboratory work will be delivered during the
course. The expectations regarding lab work and reporting are described in a
separate document,‘KNE351. FLUIDMECHANICS: Laboratory Method and
Reporting’, which will also be circulated at the beginning of the course. It is
expected that all students study these notes and complete the pre-lab component
prior to the laboratory session. An overview of the laboratory equipment will
be provided at the beginning of each session.
A D Henderson
2
1. Learning Objectives
1. Observe and understand the behaviour of a real fluid flowing over a broad-crested weir,
2. Model this behaviour employing the Continuity and Bernoulli (Energy) Principles to
predict the flow rate from depth measurements.
3. Evaluate these predictions by comparing with measured values and use Specific Energy
to explain the changing nature of the flow over the weir.
2. Introduction
The theory of non-uniform flow in channels is covered by the course text, by many other fluid
mechanics texts, and by several web sites.
The specific energy, E, is the energy at a channel cross-section referred to the base of the
channel (in contrast to the Bernoulli equation, which is referred to a fixed horizontal datum).
The expression given for E is actually an approximation valid for small bed slopes. You've
measured the flume slope, and should examine this approximation in your report. A hydrostatic
pressure distribution is assumed, and you should also examine the validity of this assumption. If
the streamlines are not parallel, then the accelerative forces will modify the pressure - depth
relationship.
In general, two conjugate flows depths satisfy the specific energy equation for a given value of
the specific energy. The greater depth is associated with subcritical flow, and the shallower
depth with supercritical flow. At the critical depth the conjugate depths are equal, and the
discharge for the given specific energy is a maximum.
Broad crested weirs are used as a method of flow measurement in open channel flows. If the
weir is sufficiently high and long, the free surface will drop to critical depth. If the height of
the upstream flow is measured, then the flow rate can be determined.
3
3. Apparatus
• Water flume comprising of pump, control valve, venturi and v-notch flow meters,
downstream control gate.
• depth gauges
• 2 vertical water manometers
• 2 total head tubes
4. Preparation
Examine and sketch the layout of the channel and associated flow measuring equipment.
Measure the channel width and note significant geometrical parameters of the nozzle venturi
meter and V-notch weir. Note the directions of readings of all measuring scales.
a. Measure the channel, weir dimensions, a.
In this study the kinematic wave equation has been solved numerically using the modified Lax
explicit finite difference scheme (MLEFDS) and used for flood routing in a wide prismatic channel and a nonprismatic
channel. Two flood waves, one sinusoidal wave and one exponential wave, have been imposed at the
upstream boundary of the channel in which the flow is initially uniform. Six different schemes have been
introduced and used to compute the routing parameter, the wave celerity c. Two of these schemes are based on
constant depth and use constant celerity throughout the computation process. The rest of the schemes are based
on local depths and give celerity dependent on time and space. The effects of the routing parameter c on the
travel time of flood wave, the subsidence of the flood peak and the conservation flood flow volume have been
studied. The results seem to indicate that there is a minimal loss/gain of flow volume whatever the scheme is.
While it is confirmed that neither of the schemes is 100% volume conservative, it is found that the scheme
Kinematic Wave Model-2 (KWM-II) gives the most accurate result giving only 0.1% error in perspective of
volume conservation. The results obtained in this study are in good qualitative agreement with those obtained in
other similar studies.
Cosmetic shop management system project report.pdfKamal Acharya
Buying new cosmetic products is difficult. It can even be scary for those who have sensitive skin and are prone to skin trouble. The information needed to alleviate this problem is on the back of each product, but it's thought to interpret those ingredient lists unless you have a background in chemistry.
Instead of buying and hoping for the best, we can use data science to help us predict which products may be good fits for us. It includes various function programs to do the above mentioned tasks.
Data file handling has been effectively used in the program.
The automated cosmetic shop management system should deal with the automation of general workflow and administration process of the shop. The main processes of the system focus on customer's request where the system is able to search the most appropriate products and deliver it to the customers. It should help the employees to quickly identify the list of cosmetic product that have reached the minimum quantity and also keep a track of expired date for each cosmetic product. It should help the employees to find the rack number in which the product is placed.It is also Faster and more efficient way.
Hybrid optimization of pumped hydro system and solar- Engr. Abdul-Azeez.pdffxintegritypublishin
Advancements in technology unveil a myriad of electrical and electronic breakthroughs geared towards efficiently harnessing limited resources to meet human energy demands. The optimization of hybrid solar PV panels and pumped hydro energy supply systems plays a pivotal role in utilizing natural resources effectively. This initiative not only benefits humanity but also fosters environmental sustainability. The study investigated the design optimization of these hybrid systems, focusing on understanding solar radiation patterns, identifying geographical influences on solar radiation, formulating a mathematical model for system optimization, and determining the optimal configuration of PV panels and pumped hydro storage. Through a comparative analysis approach and eight weeks of data collection, the study addressed key research questions related to solar radiation patterns and optimal system design. The findings highlighted regions with heightened solar radiation levels, showcasing substantial potential for power generation and emphasizing the system's efficiency. Optimizing system design significantly boosted power generation, promoted renewable energy utilization, and enhanced energy storage capacity. The study underscored the benefits of optimizing hybrid solar PV panels and pumped hydro energy supply systems for sustainable energy usage. Optimizing the design of solar PV panels and pumped hydro energy supply systems as examined across diverse climatic conditions in a developing country, not only enhances power generation but also improves the integration of renewable energy sources and boosts energy storage capacities, particularly beneficial for less economically prosperous regions. Additionally, the study provides valuable insights for advancing energy research in economically viable areas. Recommendations included conducting site-specific assessments, utilizing advanced modeling tools, implementing regular maintenance protocols, and enhancing communication among system components.
About
Indigenized remote control interface card suitable for MAFI system CCR equipment. Compatible for IDM8000 CCR. Backplane mounted serial and TCP/Ethernet communication module for CCR remote access. IDM 8000 CCR remote control on serial and TCP protocol.
• Remote control: Parallel or serial interface.
• Compatible with MAFI CCR system.
• Compatible with IDM8000 CCR.
• Compatible with Backplane mount serial communication.
• Compatible with commercial and Defence aviation CCR system.
• Remote control system for accessing CCR and allied system over serial or TCP.
• Indigenized local Support/presence in India.
• Easy in configuration using DIP switches.
Technical Specifications
Indigenized remote control interface card suitable for MAFI system CCR equipment. Compatible for IDM8000 CCR. Backplane mounted serial and TCP/Ethernet communication module for CCR remote access. IDM 8000 CCR remote control on serial and TCP protocol.
Key Features
Indigenized remote control interface card suitable for MAFI system CCR equipment. Compatible for IDM8000 CCR. Backplane mounted serial and TCP/Ethernet communication module for CCR remote access. IDM 8000 CCR remote control on serial and TCP protocol.
• Remote control: Parallel or serial interface
• Compatible with MAFI CCR system
• Copatiable with IDM8000 CCR
• Compatible with Backplane mount serial communication.
• Compatible with commercial and Defence aviation CCR system.
• Remote control system for accessing CCR and allied system over serial or TCP.
• Indigenized local Support/presence in India.
Application
• Remote control: Parallel or serial interface.
• Compatible with MAFI CCR system.
• Compatible with IDM8000 CCR.
• Compatible with Backplane mount serial communication.
• Compatible with commercial and Defence aviation CCR system.
• Remote control system for accessing CCR and allied system over serial or TCP.
• Indigenized local Support/presence in India.
• Easy in configuration using DIP switches.
CFD Simulation of By-pass Flow in a HRSG module by R&R Consult.pptxR&R Consult
CFD analysis is incredibly effective at solving mysteries and improving the performance of complex systems!
Here's a great example: At a large natural gas-fired power plant, where they use waste heat to generate steam and energy, they were puzzled that their boiler wasn't producing as much steam as expected.
R&R and Tetra Engineering Group Inc. were asked to solve the issue with reduced steam production.
An inspection had shown that a significant amount of hot flue gas was bypassing the boiler tubes, where the heat was supposed to be transferred.
R&R Consult conducted a CFD analysis, which revealed that 6.3% of the flue gas was bypassing the boiler tubes without transferring heat. The analysis also showed that the flue gas was instead being directed along the sides of the boiler and between the modules that were supposed to capture the heat. This was the cause of the reduced performance.
Based on our results, Tetra Engineering installed covering plates to reduce the bypass flow. This improved the boiler's performance and increased electricity production.
It is always satisfying when we can help solve complex challenges like this. Do your systems also need a check-up or optimization? Give us a call!
Work done in cooperation with James Malloy and David Moelling from Tetra Engineering.
More examples of our work https://www.r-r-consult.dk/en/cases-en/
Welcome to WIPAC Monthly the magazine brought to you by the LinkedIn Group Water Industry Process Automation & Control.
In this month's edition, along with this month's industry news to celebrate the 13 years since the group was created we have articles including
A case study of the used of Advanced Process Control at the Wastewater Treatment works at Lleida in Spain
A look back on an article on smart wastewater networks in order to see how the industry has measured up in the interim around the adoption of Digital Transformation in the Water Industry.
Water scarcity is the lack of fresh water resources to meet the standard water demand. There are two type of water scarcity. One is physical. The other is economic water scarcity.
Final project report on grocery store management system..pdfKamal Acharya
In today’s fast-changing business environment, it’s extremely important to be able to respond to client needs in the most effective and timely manner. If your customers wish to see your business online and have instant access to your products or services.
Online Grocery Store is an e-commerce website, which retails various grocery products. This project allows viewing various products available enables registered users to purchase desired products instantly using Paytm, UPI payment processor (Instant Pay) and also can place order by using Cash on Delivery (Pay Later) option. This project provides an easy access to Administrators and Managers to view orders placed using Pay Later and Instant Pay options.
In order to develop an e-commerce website, a number of Technologies must be studied and understood. These include multi-tiered architecture, server and client-side scripting techniques, implementation technologies, programming language (such as PHP, HTML, CSS, JavaScript) and MySQL relational databases. This is a project with the objective to develop a basic website where a consumer is provided with a shopping cart website and also to know about the technologies used to develop such a website.
This document will discuss each of the underlying technologies to create and implement an e- commerce website.
1. Discharge measurement using current meter by SOK Ty, Layheang Song, CHHIN Rattana
1
Table of Contents
1. Introduction.........................................................................................................................................................2
1.1- Stream discharge........................................................................................................................................2
1.2- Current meter...............................................................................................................................................2
2. Literature review..............................................................................................................................................3
3. Method.....................................................................................................................................................................3
3.1- Dividing section........................................................................................................................................4
3.1.1- Mid-section method.........................................................................................................................4
3.1.2- Mean section method ......................................................................................................................5
3.2- Velocity measurement..........................................................................................................................5
3.2.1- one point method (six-tenth depth method).......................................................................5
3.2.2- two point method..............................................................................................................................6
3.2.3- three point method...........................................................................................................................7
3.2.4- surface method...................................................................................................................................8
4. Data and calculation .......................................................................................................................................8
4.1- Data ...................................................................................................................................................................8
4.2- Calculation..................................................................................................................................................10
5. Discussion...........................................................................................................................................................13
6. Conclusion..........................................................................................................................................................13
2. Discharge measurement using current meter by SOK Ty, Layheang Song, CHHIN Rattana
2
1. Introduction
1.1- Stream discharge
Discharge is a volume of water passing across one section per unit. Generally, it’s
represented as “Q”. It’s determined by the multiplication of the cross section “S” and the
velocity “v”. The rate of the discharge is varies by location of the stream because of the
catchment area and water lost. And also it’s varies because of the time, it means that in the
dry season, the discharge is absolutely difference from the rainy season because of the
amount of the precipitation. About its unit in the international system, SI, it’s express as
cubic meter per second “m3/s” but in a large total amount of water such as in a river or in
the big stream in a year the unit as million cubic meter per year “mcm/year”. In the
country in Europe and America, the cubic feet per second (cfs) is used for the unit of the
discharge.
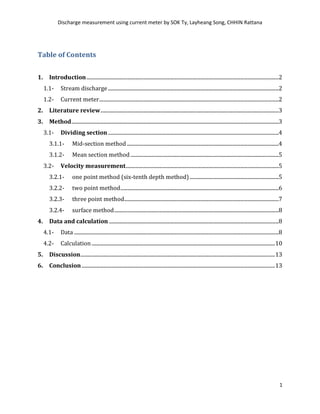
1.2- Current meter
Current meter is the most common used equipment for measuring the velocity in
the stream which contains the depth of water less than 1.5m. This equipment can measure
the velocity and the water depth to determine the cross section in the large length but
shallow because of the difficulties of the procedure.
Figure1.2: current meter model 01
Current meter model 01 (figure 1.2) can measure the velocity in the range of 0.03 m/s
to 10m/s and with the size of 125mm diameter by 270mm pitch (user guide current meter,
Velapot).
3. Discharge measurement using current meter by SOK Ty, Layheang Song, CHHIN Rattana
3
2. Literature review
The stream discharge must be calculated by the average velocity and the cross
sectional area of the stream, in generally:
Where:
- “Q” is the stream discharge, usually in “m3/s”
- “v” is the average cross sectional velocity, usually in “m/s”
- “S” is the total cross section , usually in “m”
In the real condition, the situation of the cross section in the stream is not as the
theory. As usual when the length of the cross section is so long, we have to divide it as many
sub-section according to the real situation of the stream. For the average velocity is also
according to the sub-section. So the total stream discharge is:
Where:
-“Q” is the total stream discharge
-“Si” is the each sub-cross section
-“vi” is the each average velocity
-“n” is the number of the section that we have divided
There are difference method for determine sub-section and the average velocity that are
going to describe in the next section.
3. Method
Because of the variation of the bottom of the stream, the large cross section and slope the
stream bank, we have to divide the total cross section into sub-area. For determining the
discharge, we need velocity of each sub-area. There are two methods for determination the
sub area and few methods for determination the average velocity.
Q v S
1
n
i i
i
Q S v
4. Discharge measurement using current meter by SOK Ty, Layheang Song, CHHIN Rattana
4
3.1- Dividing section
“Mean section method” and “Mid-section method” are the most efficiency method
for the dividing cross section (M.A KKAN, et al, 1997). Both mean section method and mid-
section method will give nearly the identical result for a flow cross section. In the figure 3.1
will show about the difference between the mean section method and mid-section method.
Figure 3.1: mean section and mid-section method
In this figure
b1, b3: the length of sub-section
d1, d2; d3: the observation water depth
3.1.1- Mid-section method
In the mid-section method of computing a current meter measurement, it is
assumed that the velocity sample at each vertical presents the mean velocity in the
rectangular sub-section (figure 3.1). We have to calculate the area of the sub-cross section
in assumption as rectangular:
“V average”is the velocity average in the mid-section of the assumption rectangular.
3 3average averageq s v d b v
5. Discharge measurement using current meter by SOK Ty, Layheang Song, CHHIN Rattana
5
3.1.2- Mean section method
For the cross section having the irregular, that is advantage in using the mean
section method. There are some difficulties in the calculation the discharge in the first and
the last section. Figure 3.1 is the determination of the mean section method.
3.2- Velocity measurement
The vertical mean velocity in the river or in the steam can be measured in the
variety methods. The velocity profile of the section is usually measured at a particular
fraction of the depth (h) of the measurement area (figure 3.2). Including, one point method,
two point method, tree point method, surface method are the varieties methods for
computing the average vertical velocity (M.A KKAN et al. Sep 1997).
Figure 3.2: vertical velocity
3.2.1- one point method (six-tenth depth method)
For the shallow depth, we can consider that the depth is less than 75cm for a large
current meter or 45cm for a small one, one point method, sometimes is called six-tenth
depth method, is the mostly used. A current meter measurement is taken singly at 60% of
the water depth from the water surface (figure 3.2.1).
1 21 2
3
2 2
average average
average
v vd d
q s v b
6. Discharge measurement using current meter by SOK Ty, Layheang Song, CHHIN Rattana
6
Figure 3.2.1: velocity is taken at 60% of “h” for one point method
3.2.2- two point method
The most common methodology for establishing the vertical mean velocity is two
point methods. The mean velocity is taken from the 20% and 80% of the water depth from
the water surface (figure 3.2.2). It’s always used in the measurement in the downstream
from the structure because of the velocities at this location is varies according to the depth.
The average of the two measurements is determined as the mean velocity:
80% 20%
2
at at
average
v v
v
7. Discharge measurement using current meter by SOK Ty, Layheang Song, CHHIN Rattana
7
Where:
- “V average” is the average velocity for establishing the discharge
- “V at 80%” is the velocity which we have to measure at 80% of the depth
- “V at 20%” is the velocity which we have to measure at 20% of the depth
3.2.3- three point method
Three point method combine two point method and one point method (six-tenth
depth method. Therefore, current meter measurements are taken at 20%, 60% and 80% of
the flow depth from the top (figure 3.2.3). The mean velocity in vertical obtain by the first
average of 80% and 20% of total “h” then averaging this result with the velocity at 60% of
the vertical flow depth.
Figure 3.2.3: measured depth of 3 point method
Thus, the mean velocity of the vertical depth would be:
The flow depth should exceed 0.76m when considering the use of this method
(USGS, 1980).
0.2 0.8
0.6
2
2
v v
v
v
8. Discharge measurement using current meter by SOK Ty, Layheang Song, CHHIN Rattana
8
3.2.4- surface method
The surface velocity can be measured easily with a stopwatch and small floats
(small enough that their movement is unaffected by wind, e.g. ping pong balls). A surveying
tape is needed to measure the river/stream width and the distance traveled.
Figure 3.2.4: surface method
Surface method is used in the stream where the current meter is incapable to use
because of the water depth and the velocities are too slow (USGS, 1980).
4. Data and calculation
In this section, we have two data for the Chrey Bak stream, downstream data and the
upstream data, which are measured on 09-August-2012 by ITC team which works on the
project of Suspended sediment dynamic in the tributary of Tonle Sap Lake basin: the case
of Chey bak river catchment in Kampong Chhnang led by Dr. OEURNG Chantha. This section
also shows how to apply the each method that has been shown in the section above.
4.1- Data
All these two data are the data of the Chrey Bak stream on the day of 9-August-2012.
Table 4.1a is the upstream data of the current meter measurement. It’s has been provided
into 13sections and measured at 20% and 80% of the vertical depth. Table 4.1b is the
downstream data of current meter measurement. It has been provided it into 20 sections
and measured at 20% and 80% of the vertical depth due to the water depth is not so large.
And the figure 4.1a and 4.1b is represented the profile of these two sections.
9. Discharge measurement using current meter by SOK Ty, Layheang Song, CHHIN Rattana
9
Table 4.1a: data of current meter mearement at Chrey Bak stream’s upstream on 9-Aug-12
Table 4.1b: data of current meter mearement at Chrey Bak stream’s outlet on 9-Aug-2012
10. Discharge measurement using current meter by SOK Ty, Layheang Song, CHHIN Rattana
10
Figure 4.1a: cross section profile of the upstream
Figure 4.1b: cross section of the outlet
4.2- Calculation
In this section of calculation, the discharge of the stream in each section must be
calculated by difference methodology. The discharge at the outlet will be determined by
mid-section method and the average velocities are established by 2 point method.
There are 5 steps:
Diving the cross section into sub-section
Assuming all the sub-section into rectangular but some section should be
triangular
Calculate the area of the sub-section
Determine the average velocities of each section
Calculate the discharge of each section and then sum these discharge
11. Discharge measurement using current meter by SOK Ty, Layheang Song, CHHIN Rattana
11
Step1: diving the cross section into sub-section
Step2: Assuming the sub-section to rectangular and to triangular
Step 3, 4 and 5: Calculate the area of the sub-section, determine the average velocities of
each section and calculate the discharge of each section and then sum these discharge
12. Discharge measurement using current meter by SOK Ty, Layheang Song, CHHIN Rattana
12
The discharge at the outlet will be determined by mean-section method and the
average velocities are established by 2 point method.
There are 4 steps:
Diving the cross section into sub-section
Calculate the area of the sub-section
Determine the average velocities of each section
Calculate the discharge of each section and then sum these discharge
Step1: diving the cross section into sub-section
Step 2, 3 and 4: Calculate the area of the sub-section, determine the average velocities of
each section and calculate the discharge of each section and then sum these discharge
13. Discharge measurement using current meter by SOK Ty, Layheang Song, CHHIN Rattana
13
5. Discussion
According the calculation, we see the discharge of the outlet of the Chrey Bak stream is
6.914m3/s and the upstream is 5.522m3/s at the same time, 9-August-2012. The discharge
of the downstream is must be greater than the upstream as in the introduction have been
explained. Even thought, there are the relations between positions in the streams due to
most of the discharge (except the water lost in some cases) in the upstream always
cumulates to the downstream. We can find the relation between the discharge by location
(outlet and upstream) by finding the rating curve. A rating curve is constructed by graphing
several manually derived discharge measurements. The discharge in the outlet, also in the
upstream, are also can calculate by using the rating curve too. But for determination the
rating curve, we must measure the discharge frequently and regularly, especially the
discharge which reaches the peak and the minimum to make the rating curve more precise.
6. Conclusion
Water in a channel flows are difference rate depending on its location and time. The
discharge (flow) cannot be measured directly in a river or stream like it can from a pipe or
hose because the rate is too high and its profile. So the area of the cross section is divided
into sub-sections, with one or more measurements taken for each. To reach to the real
value of the discharge, we should divide into more and more small sections and measure
carefully to get the precise values. All the application of methodologies must be done by its
advantages, advantages and the suitable condition.
Reference:
- ENG5300 Engineering Applications in the Earth Sciences: Measuring River
Discharge, John S. Gierke, Ph.D., P.E.
- Current meter discharge measurement for steady and unsteady flow in irrigation
channel, MUSHTAQ A.KHAN, K.MAHMOD, G.V SKOGROBE, Sept 1997.
- www.valeport.co.uk