Download as PDF, PPTX
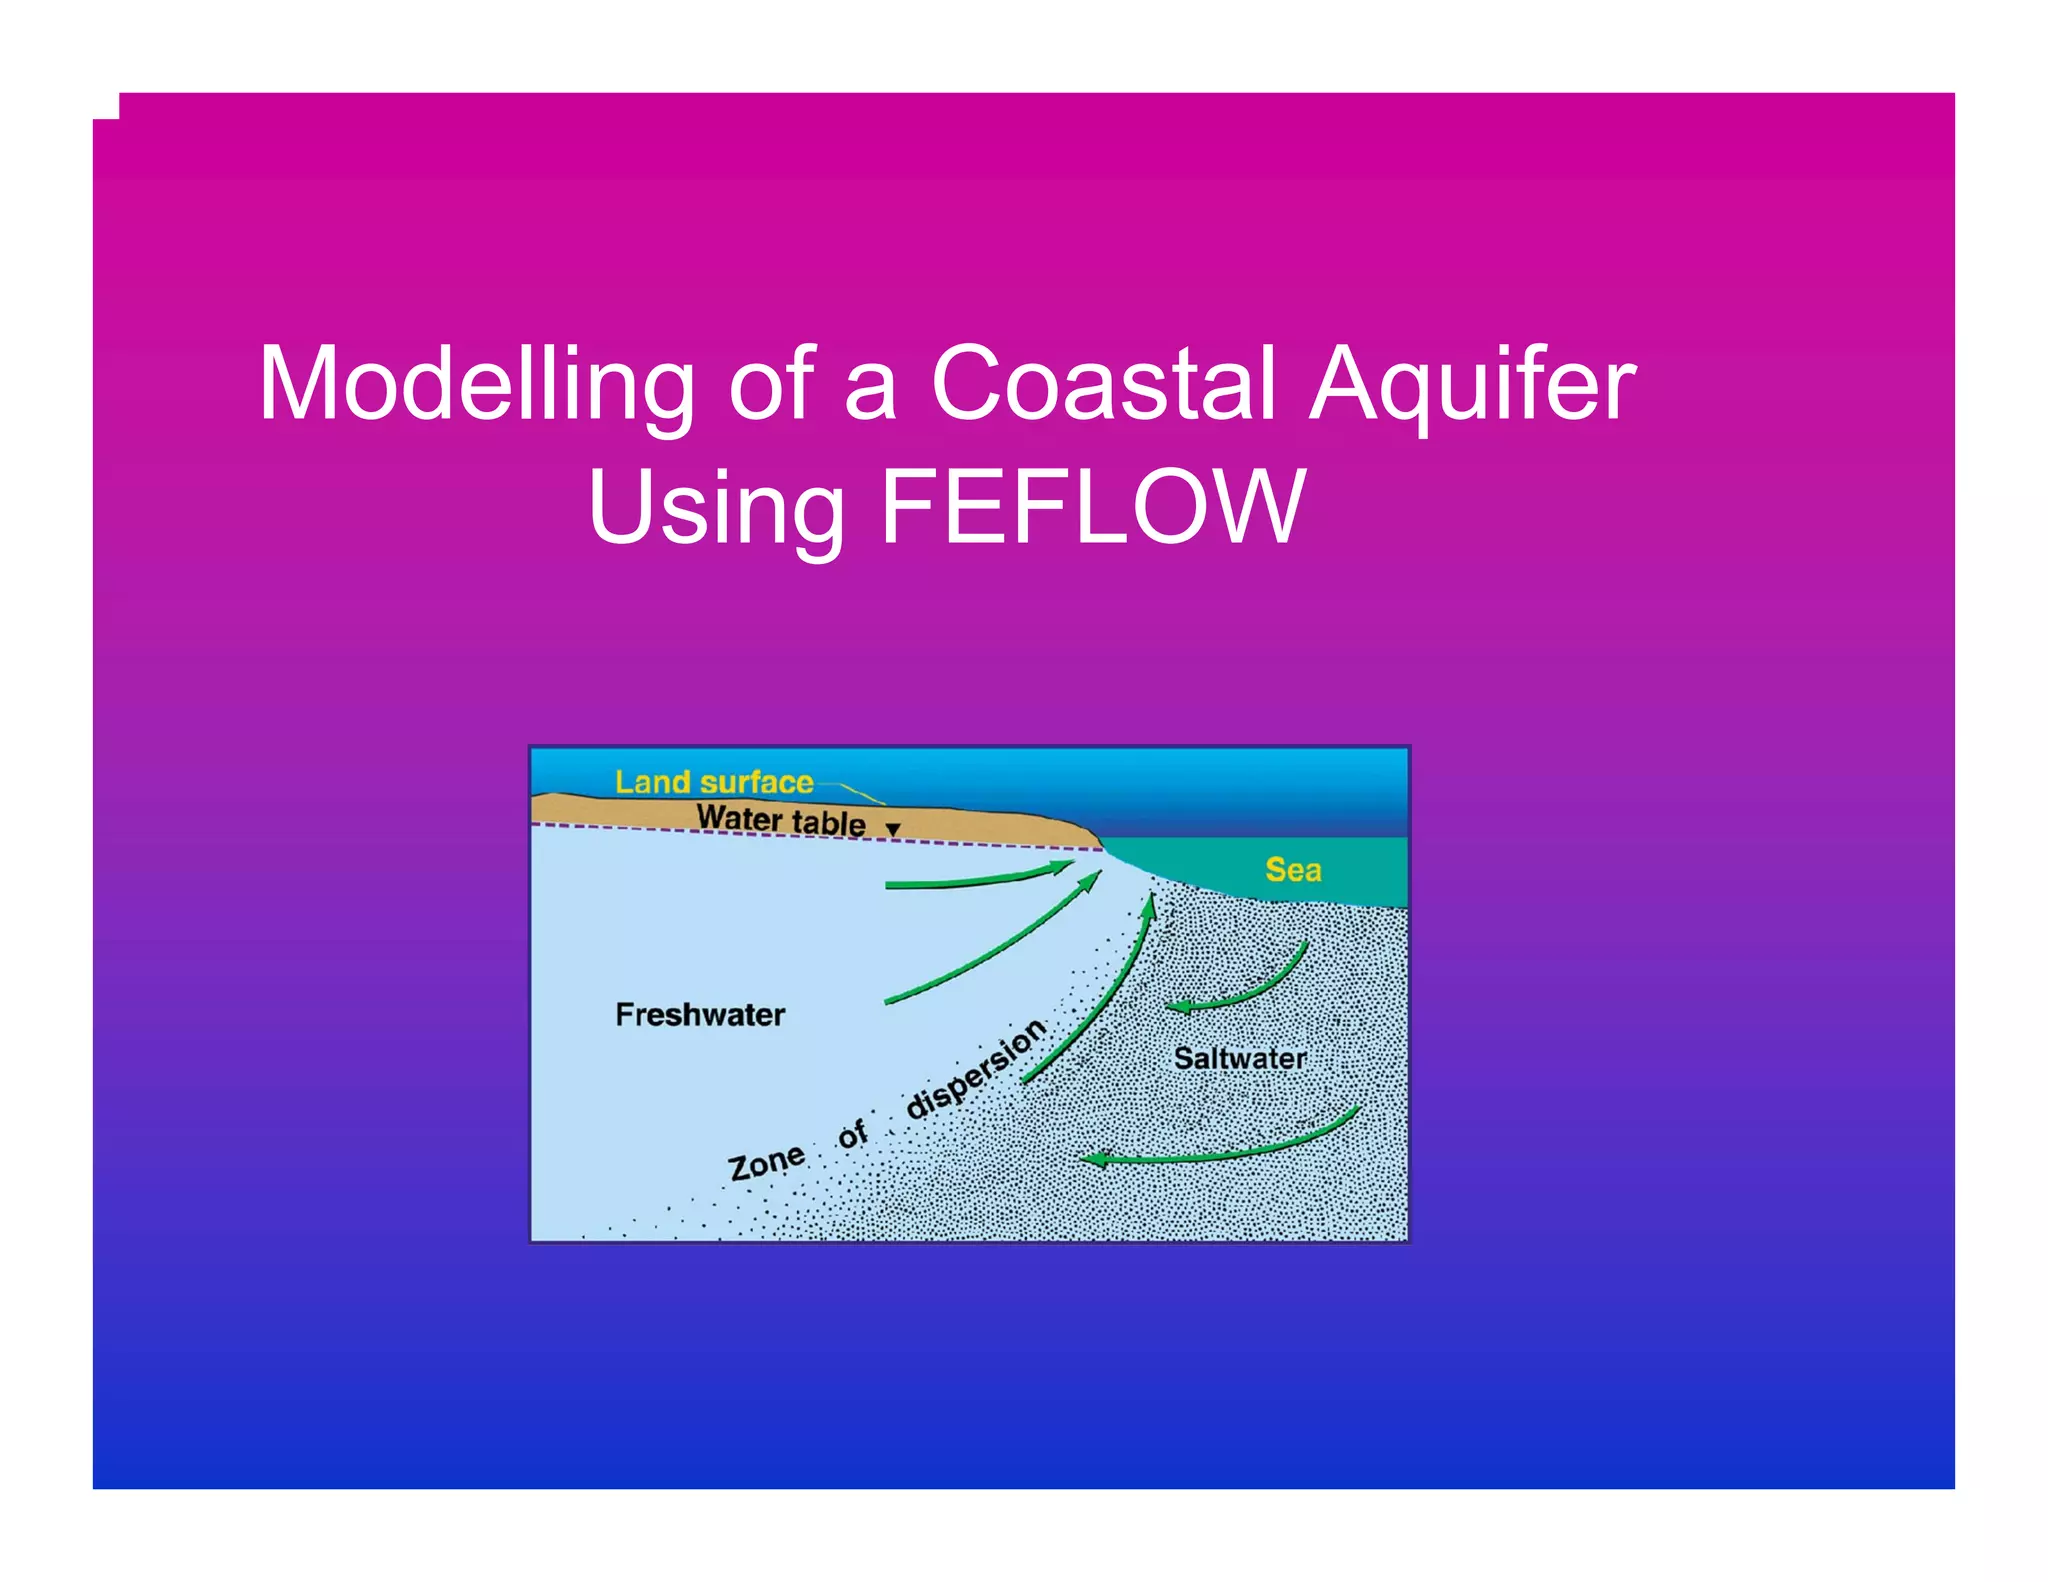
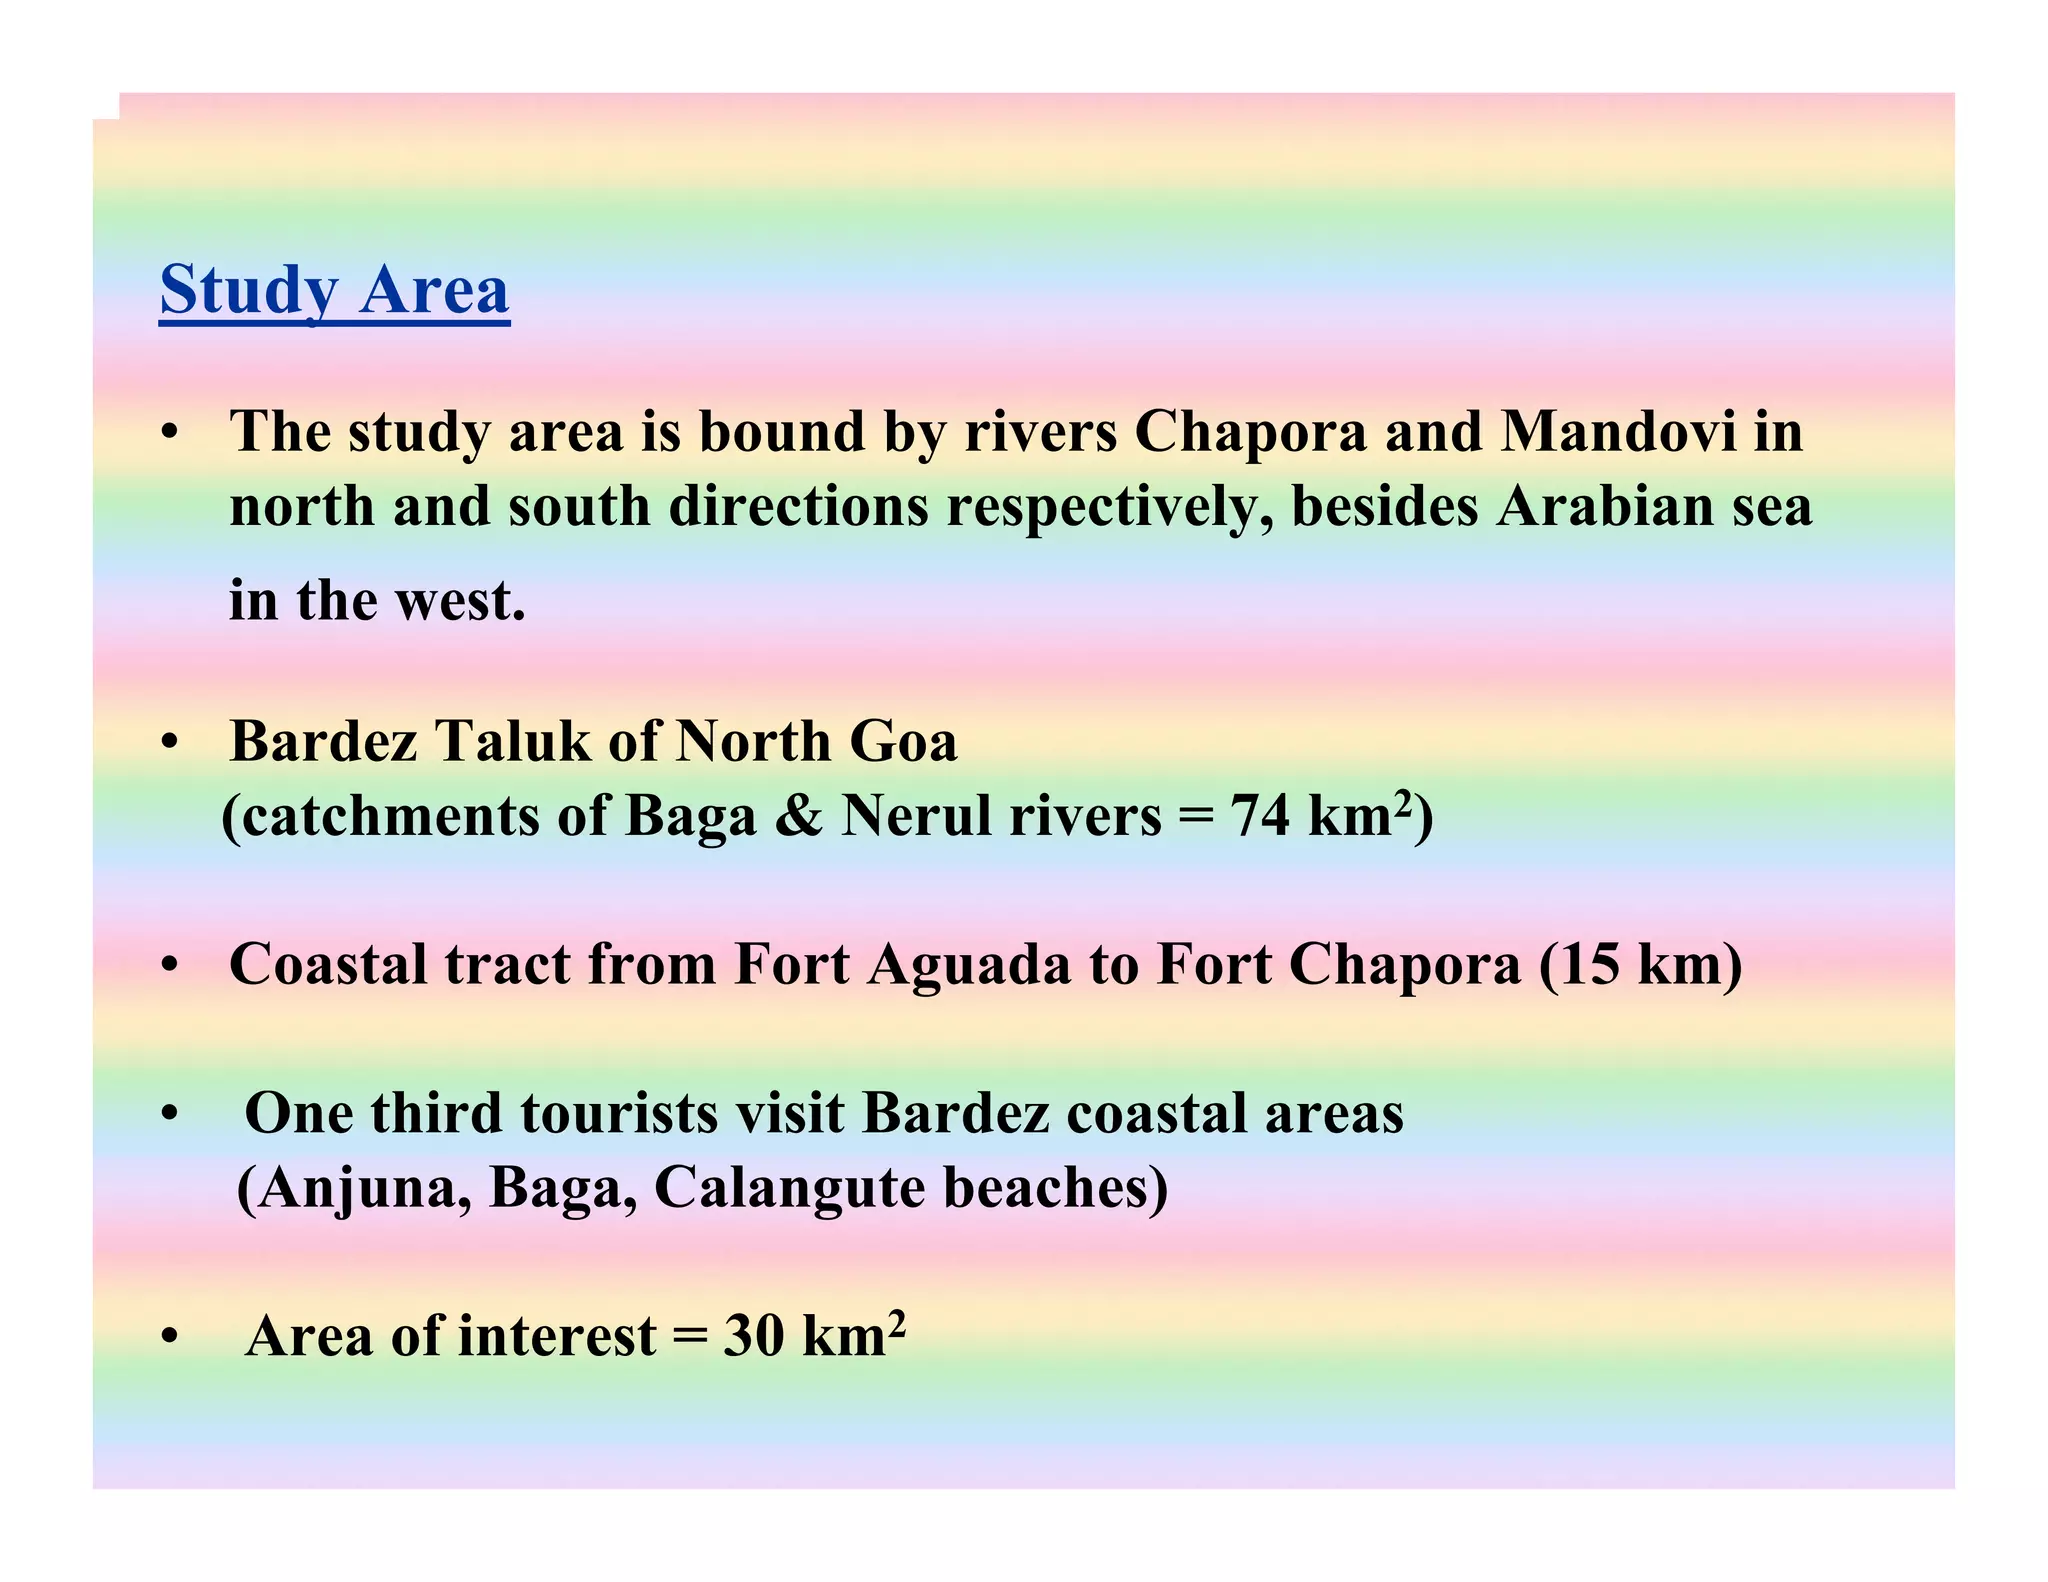
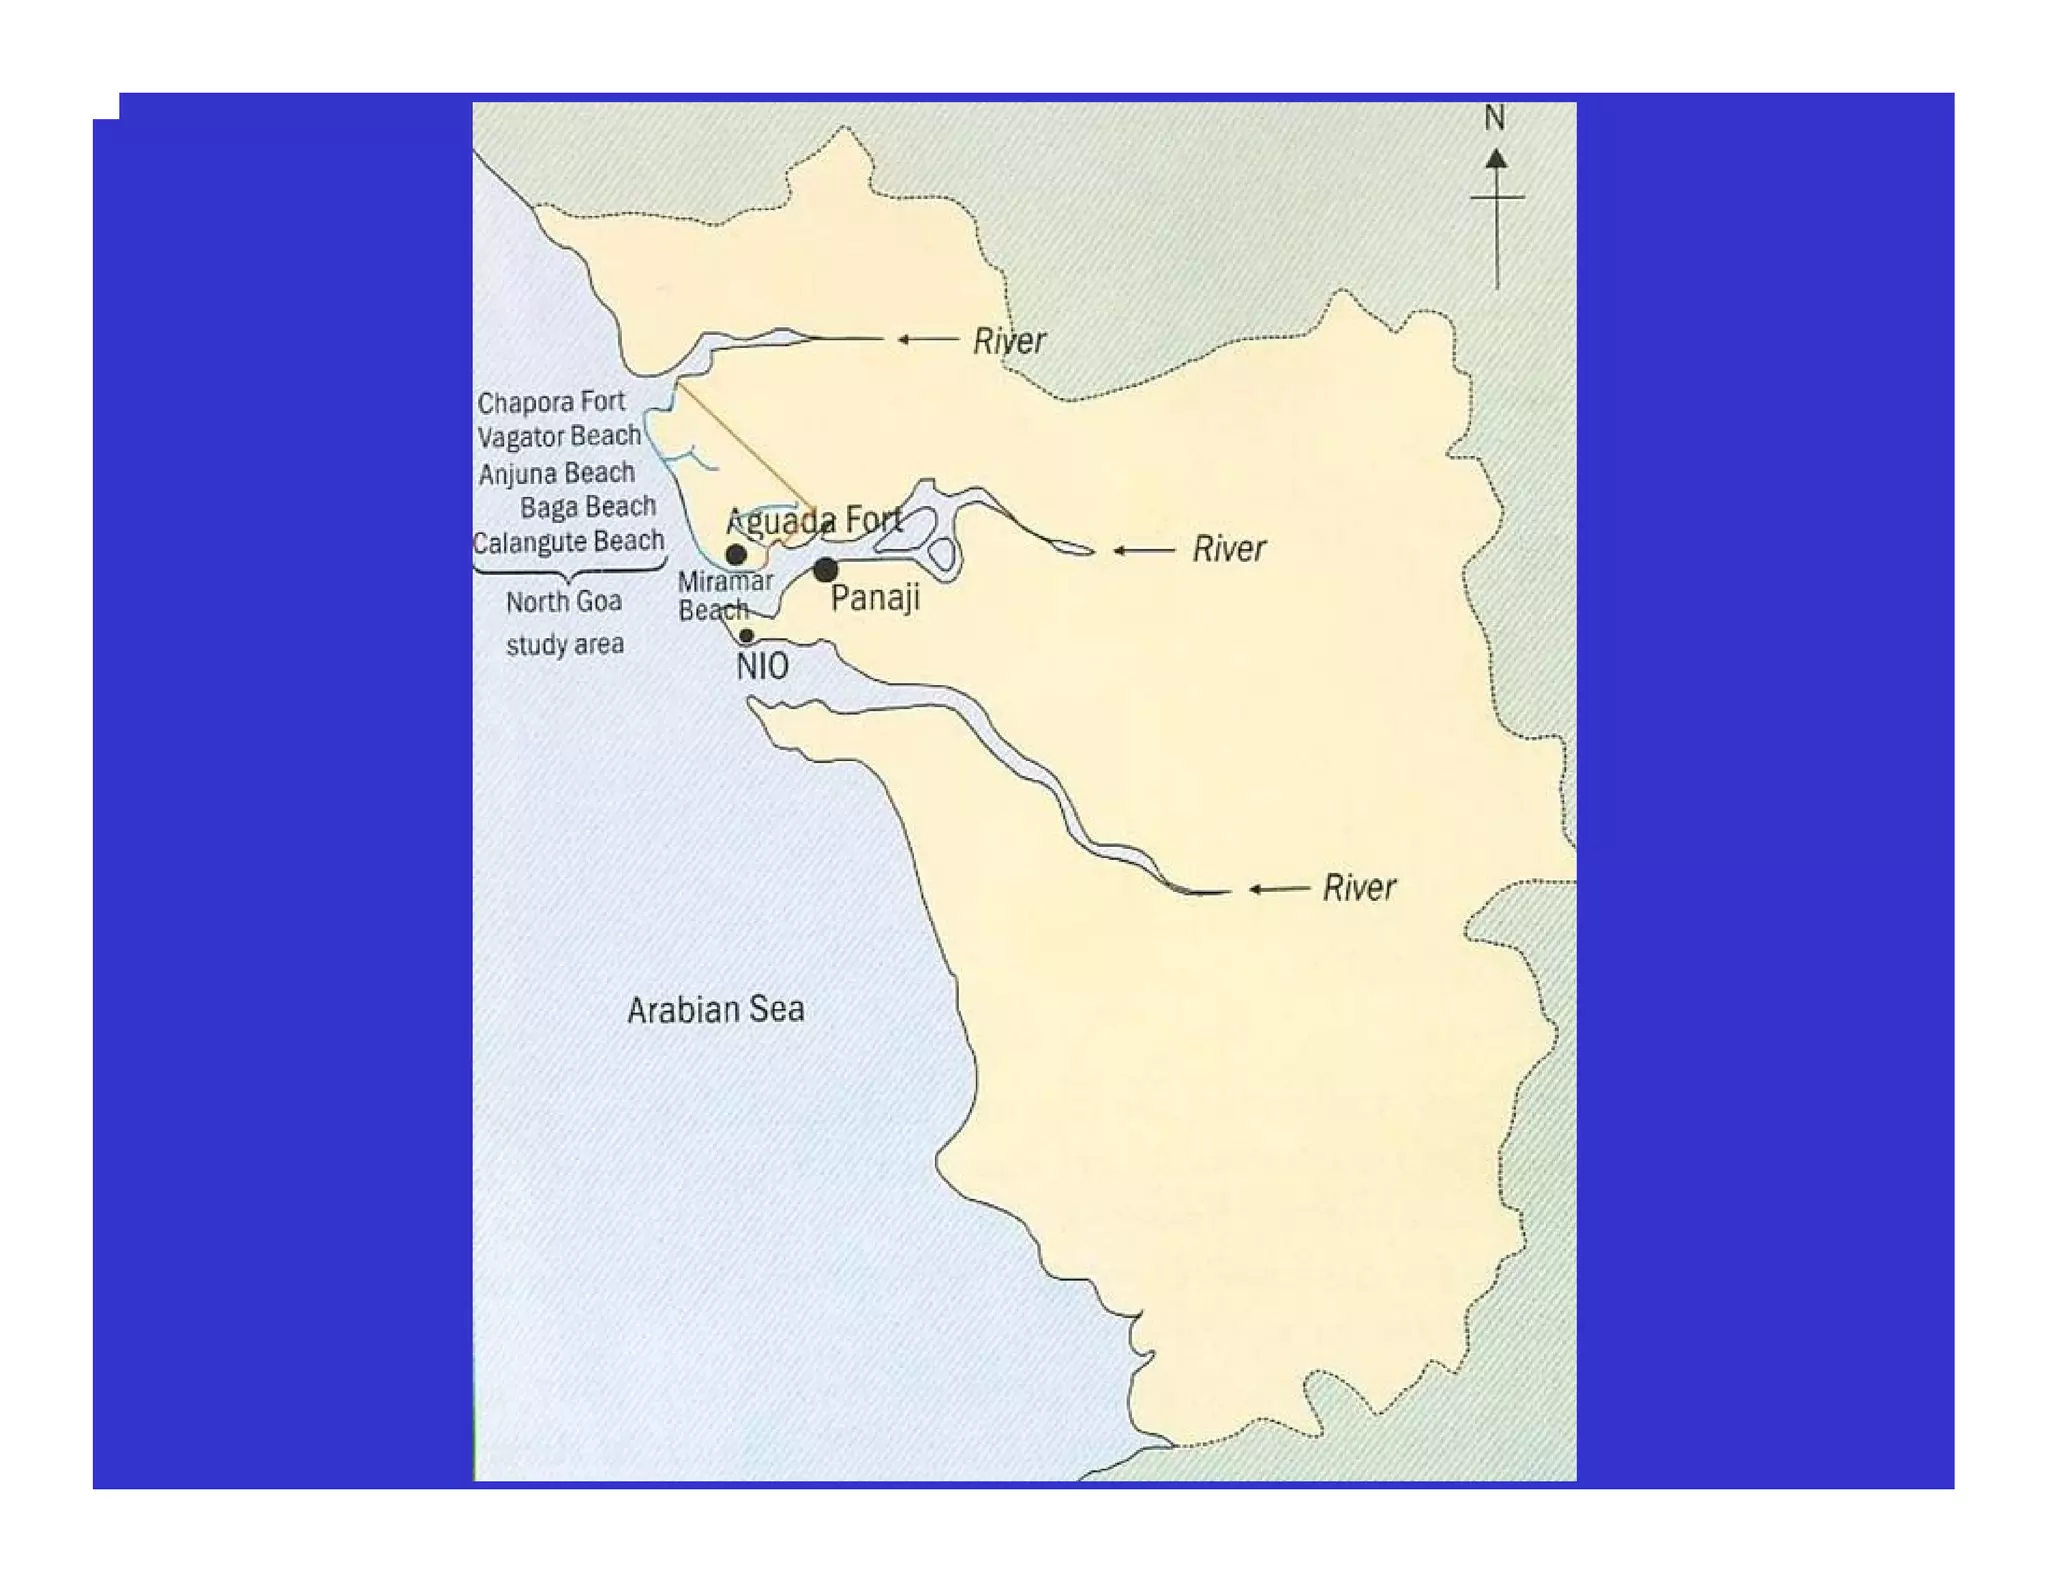
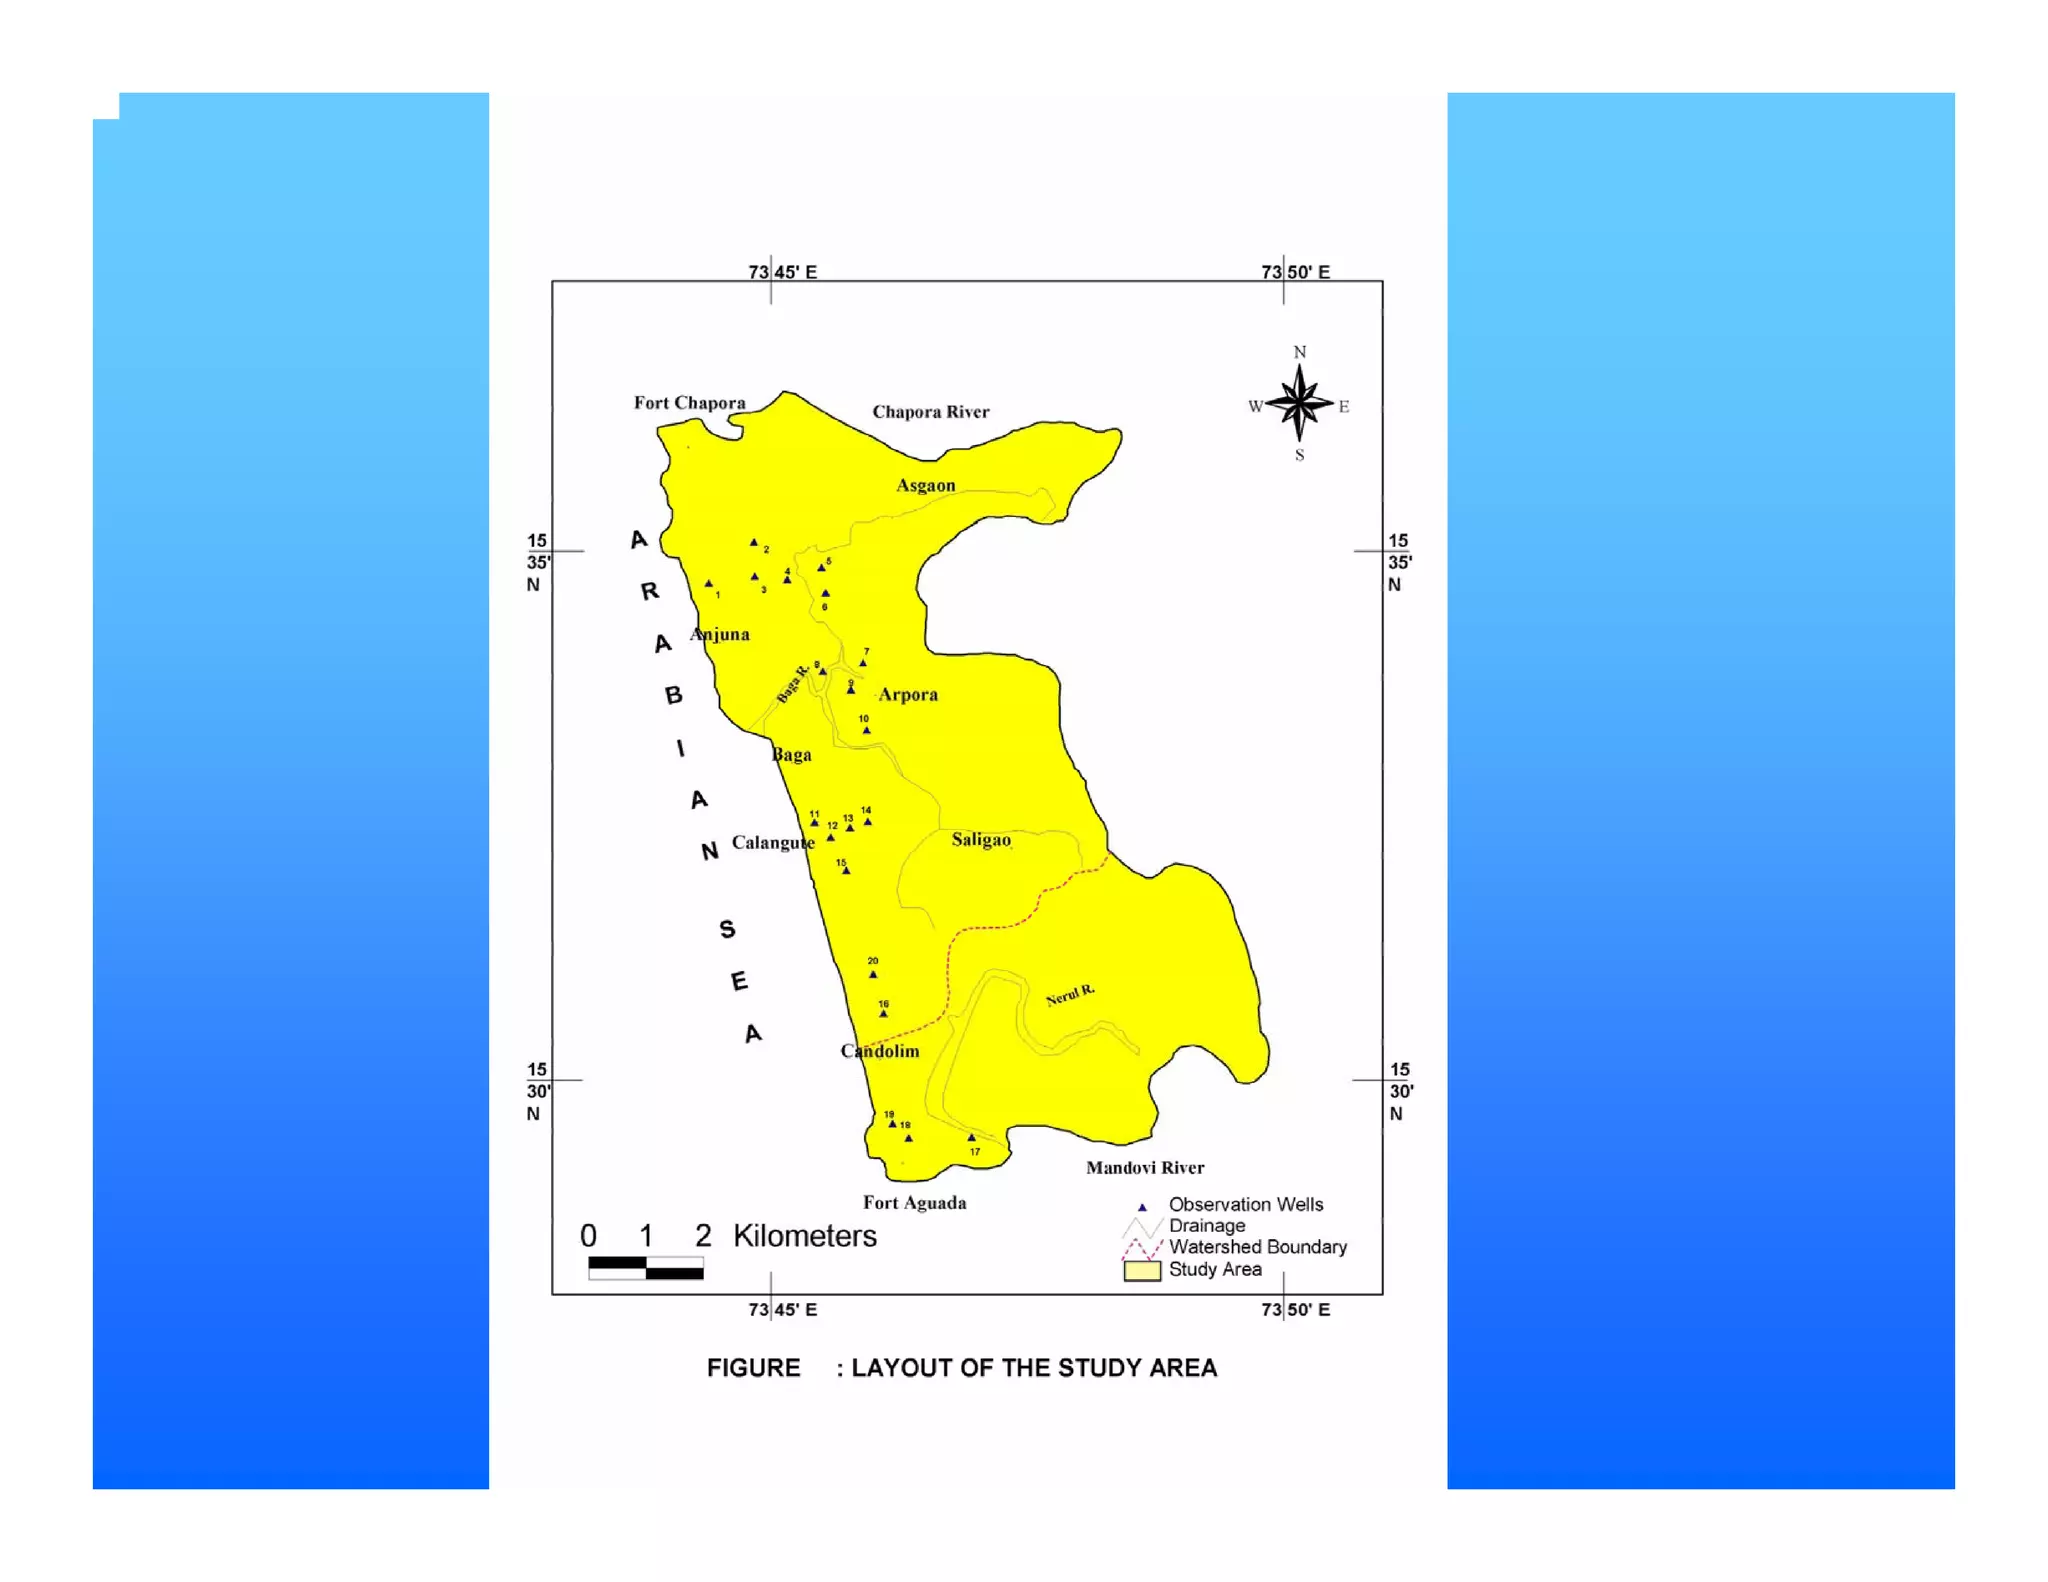
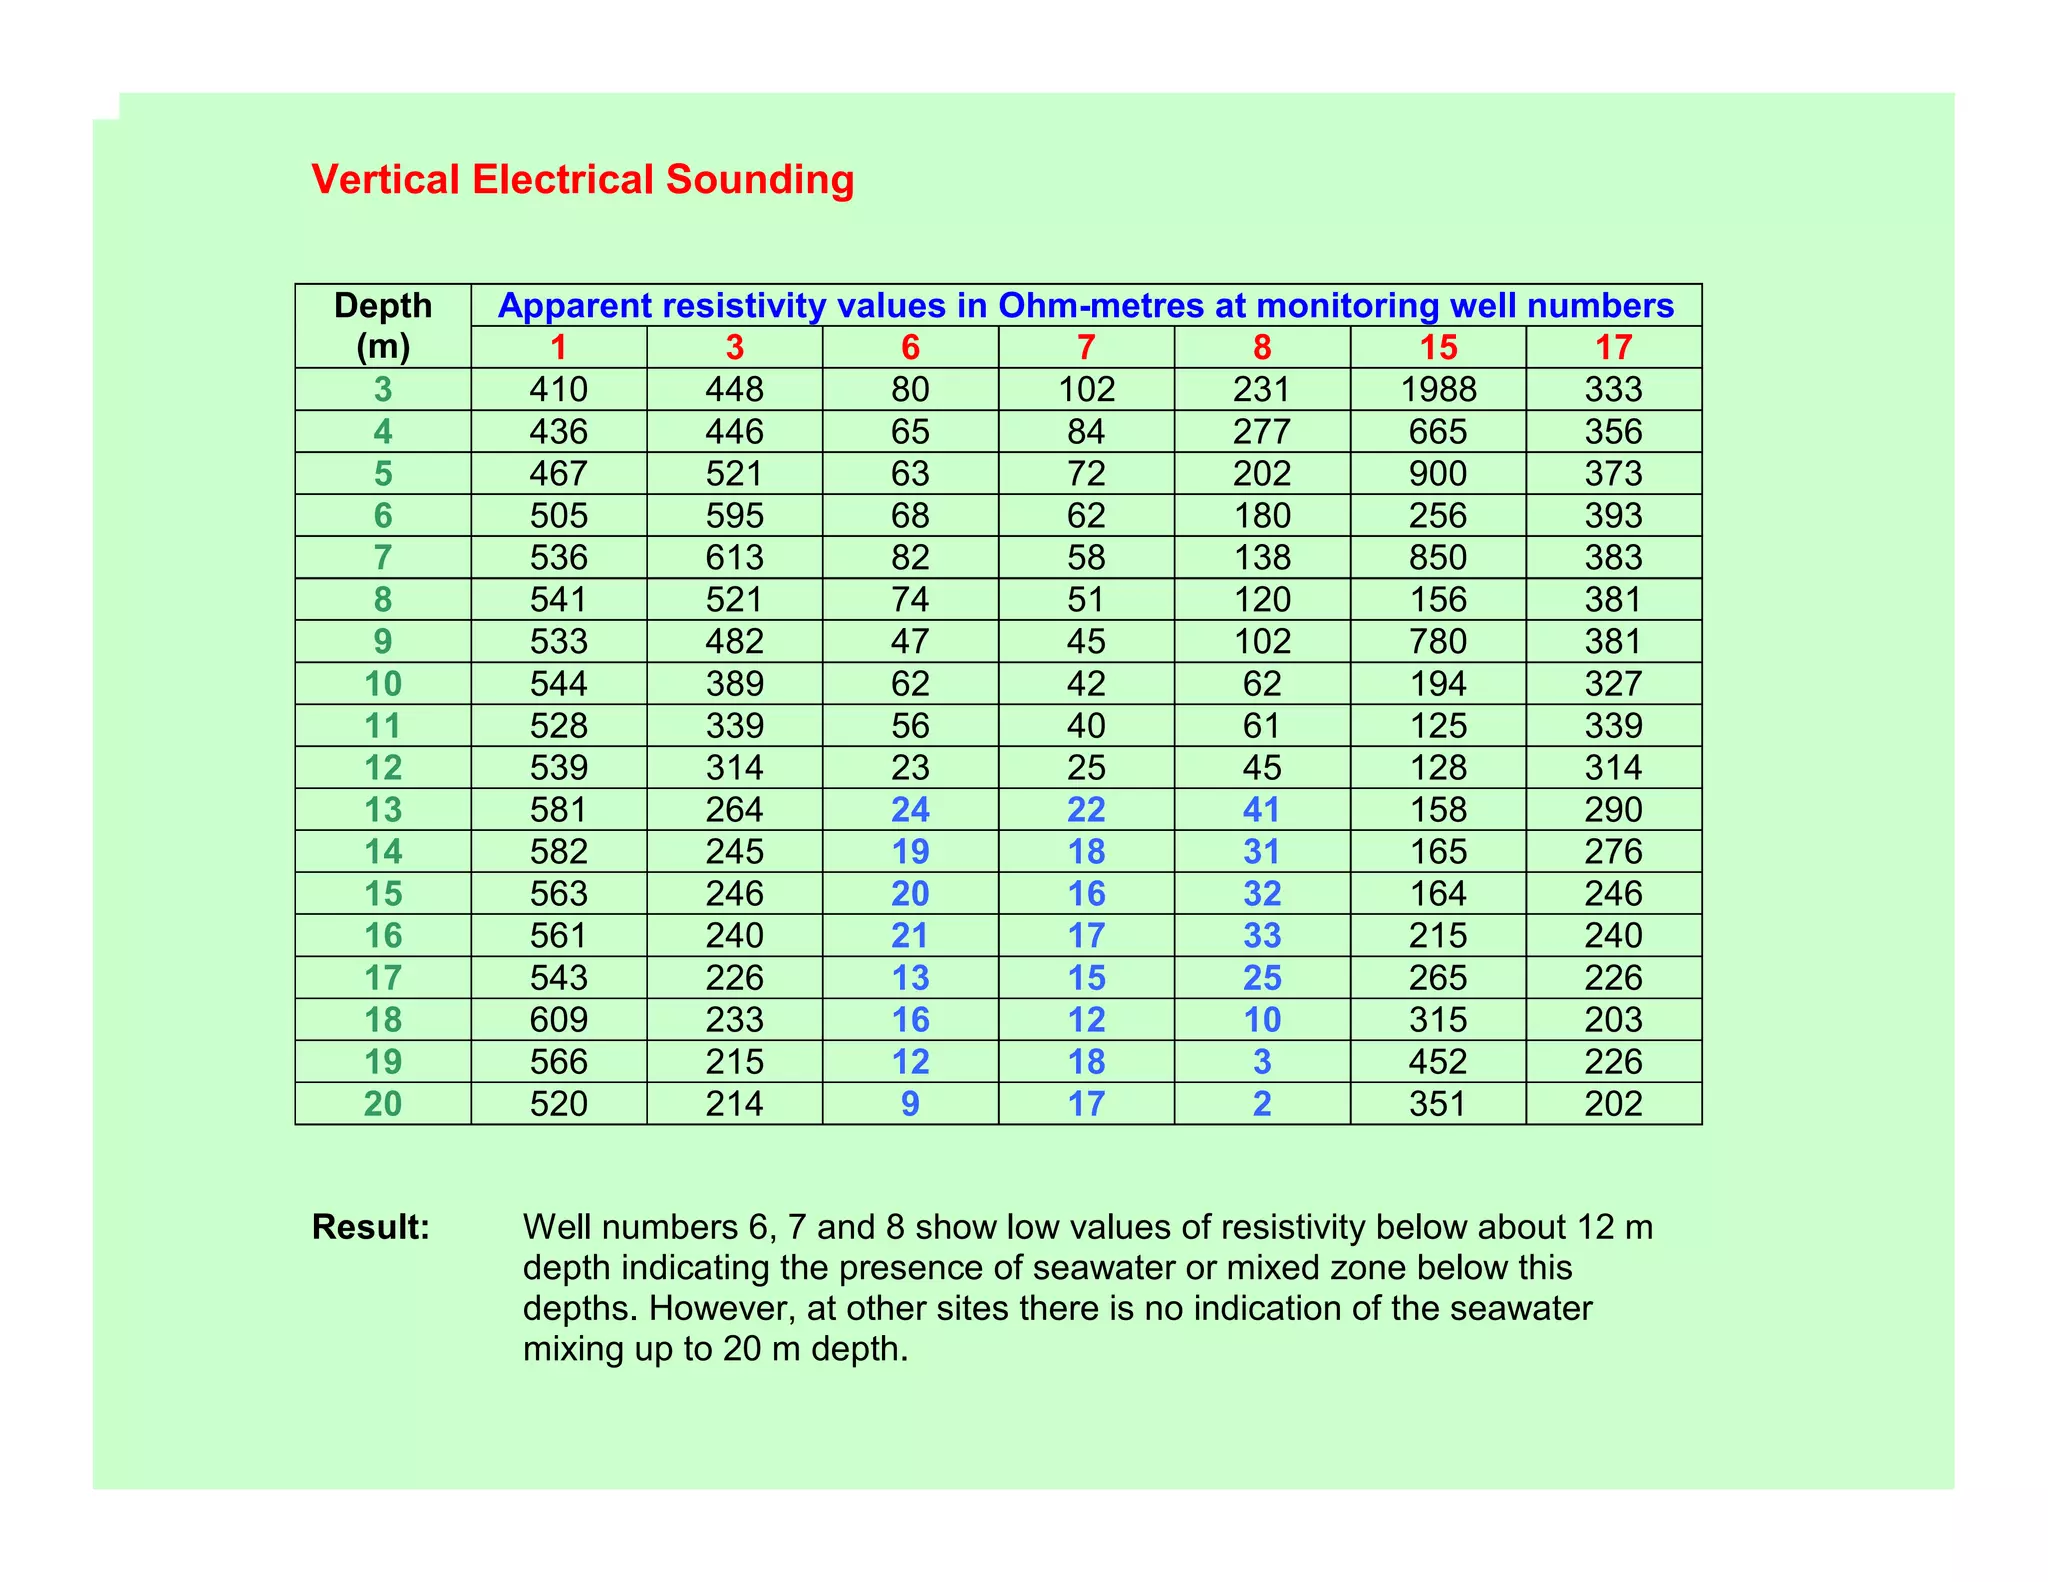
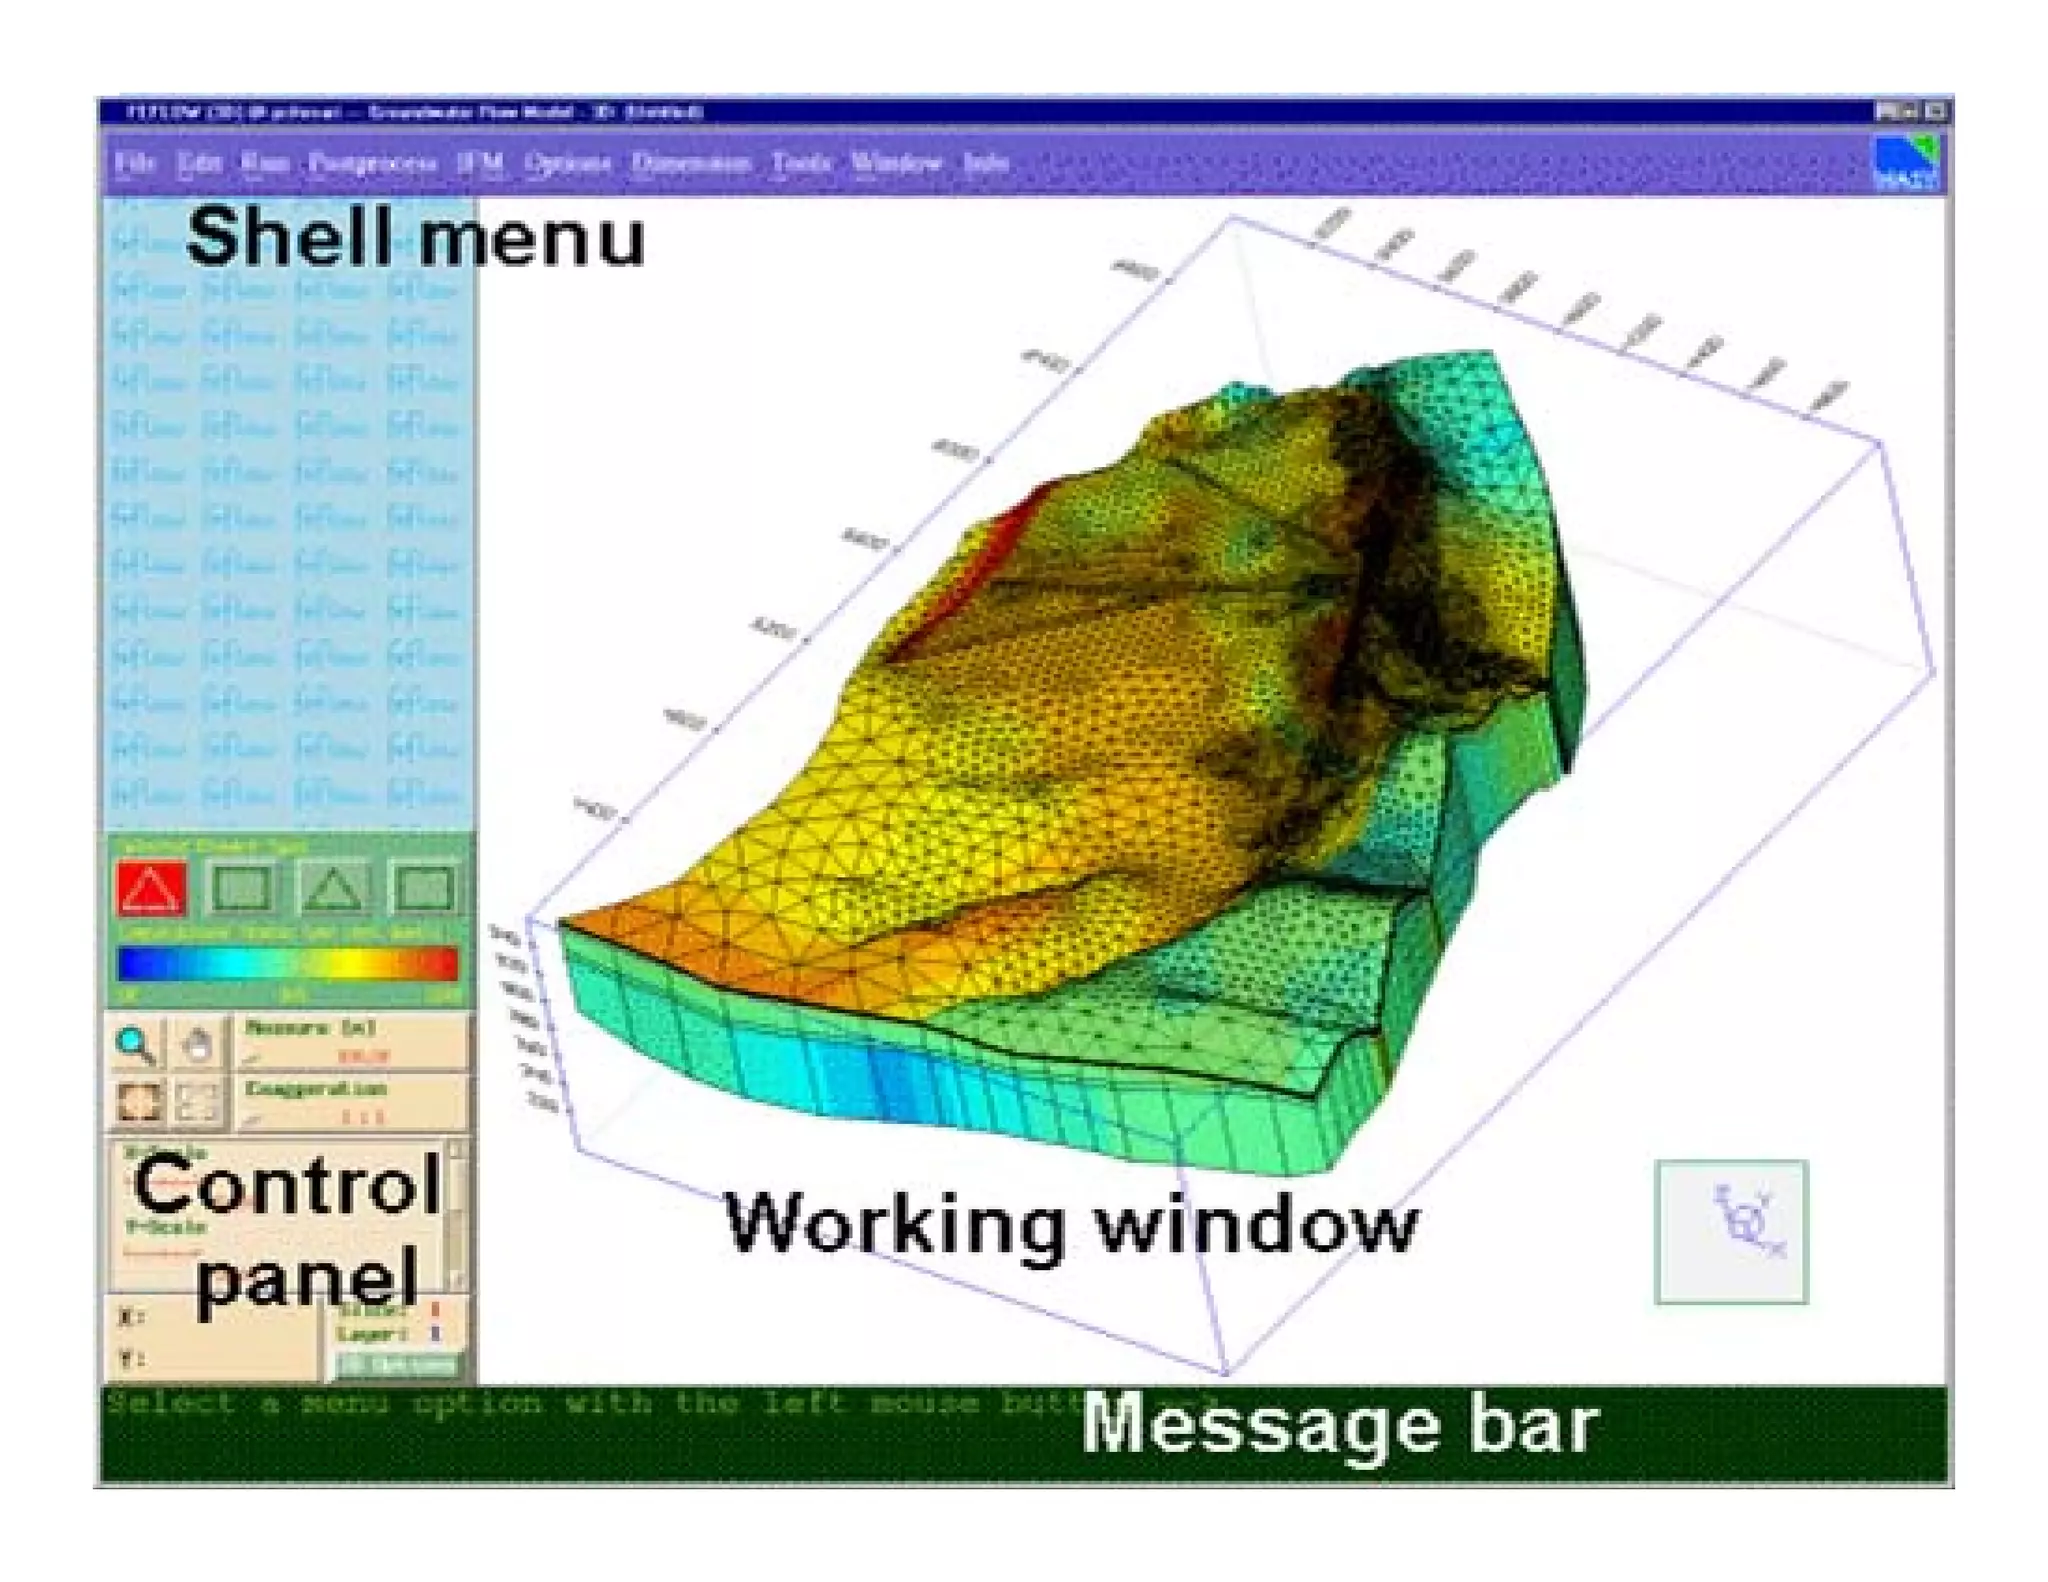
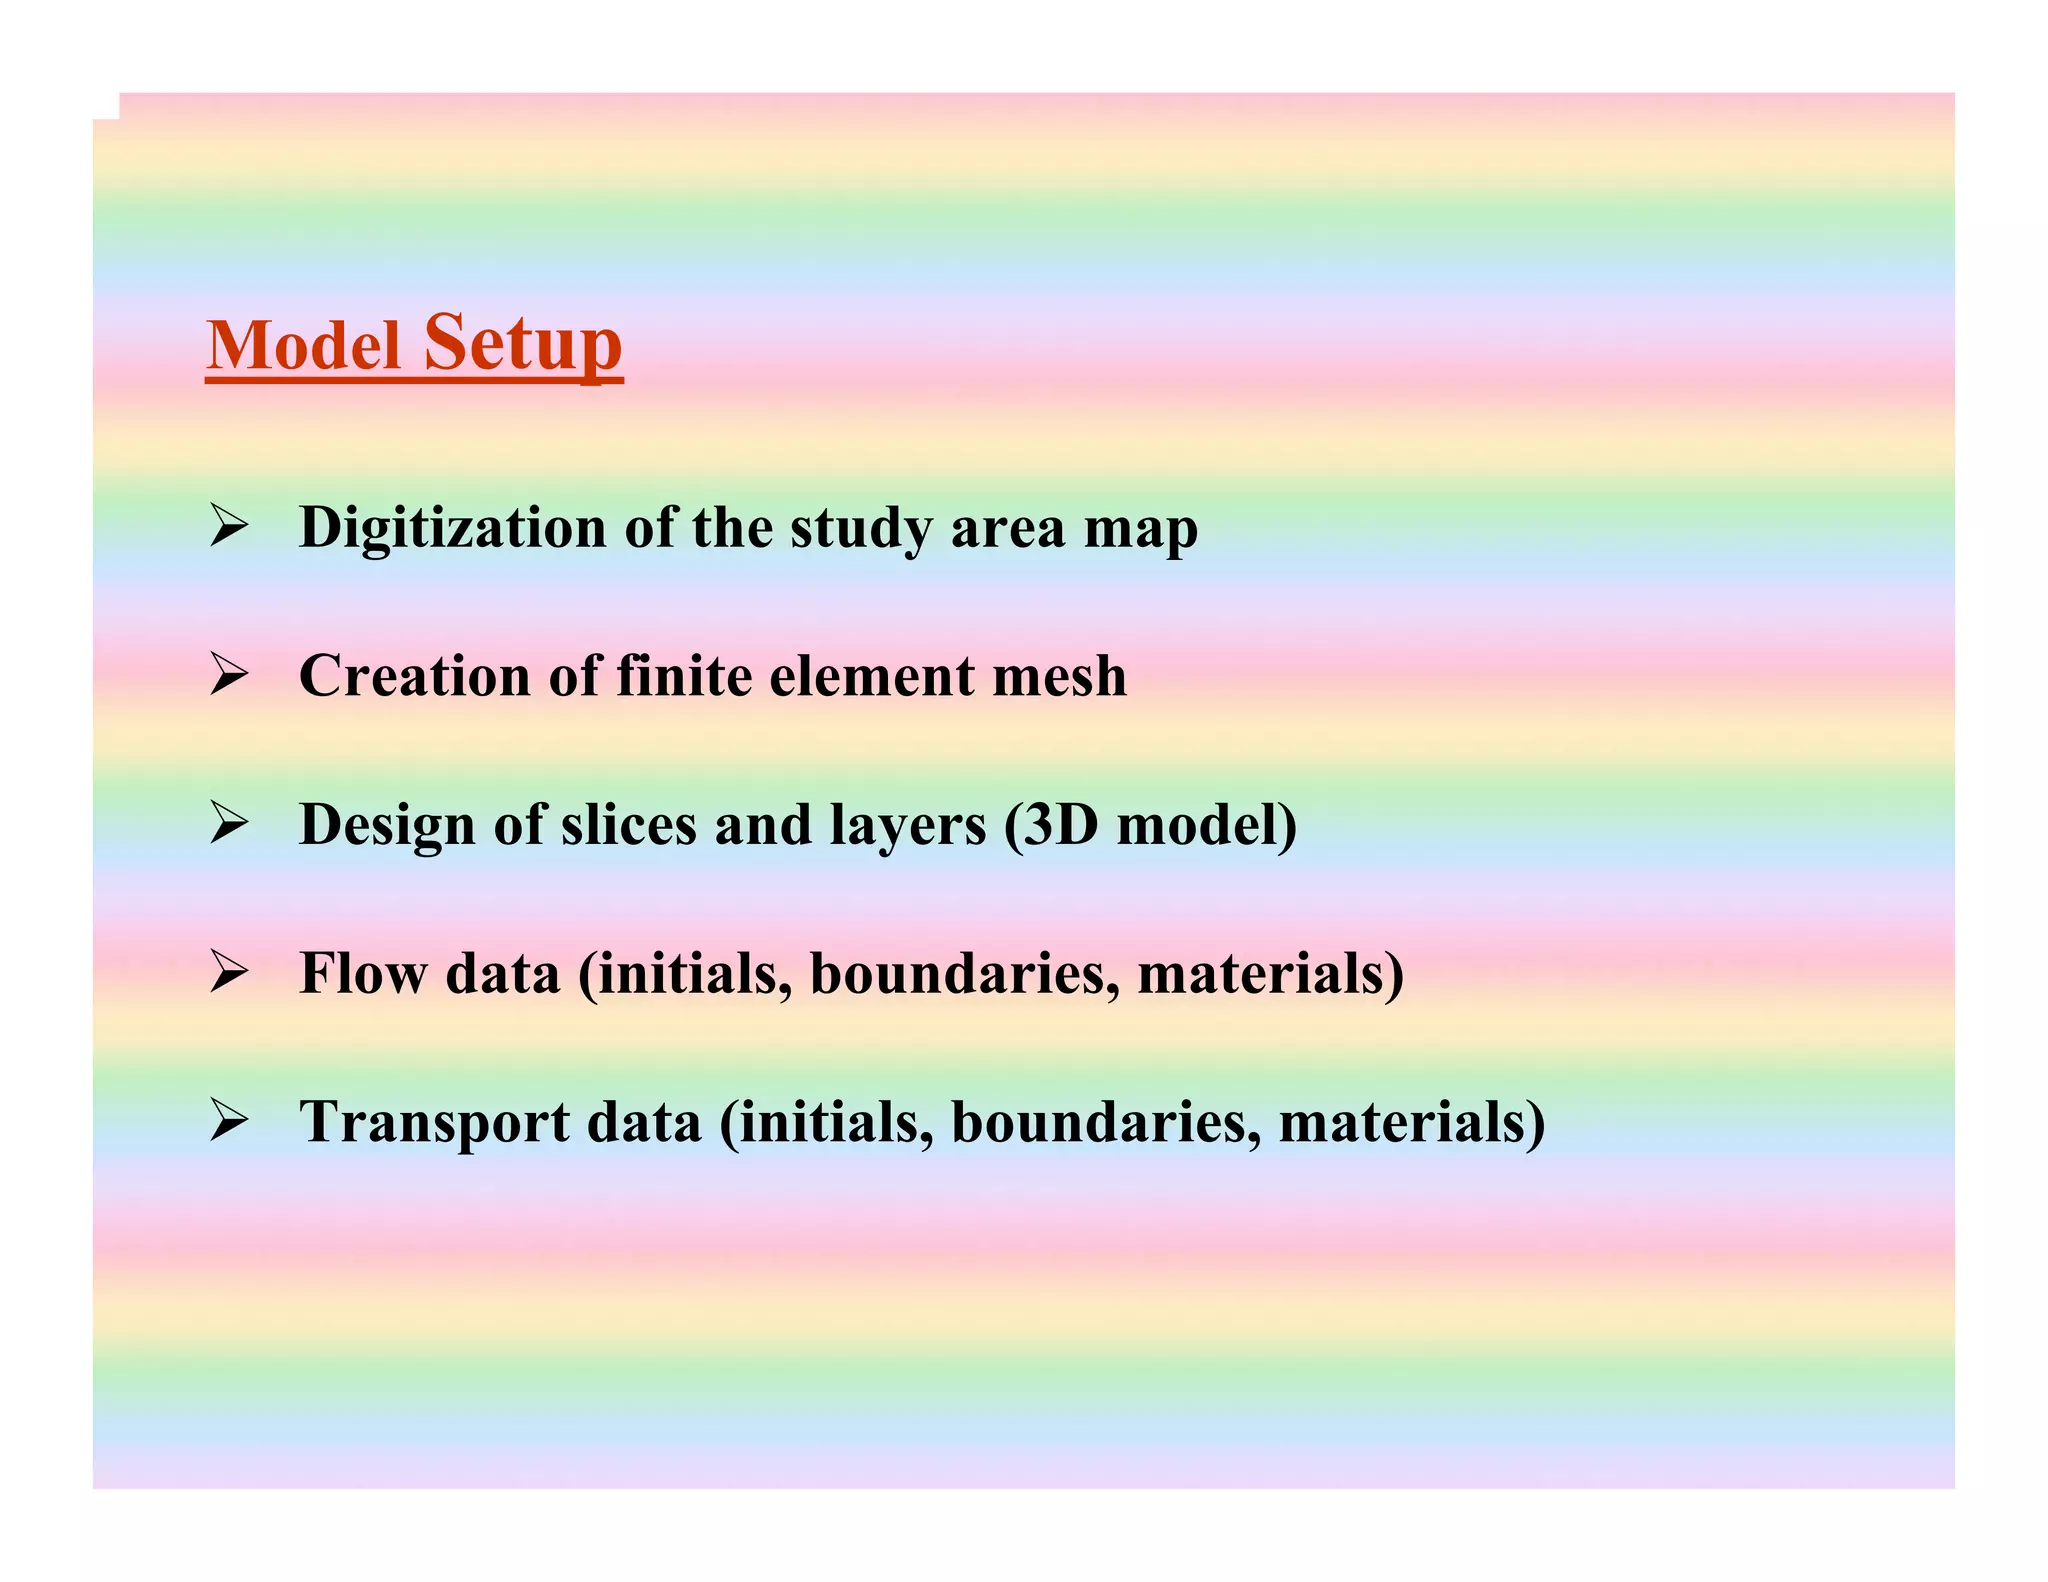
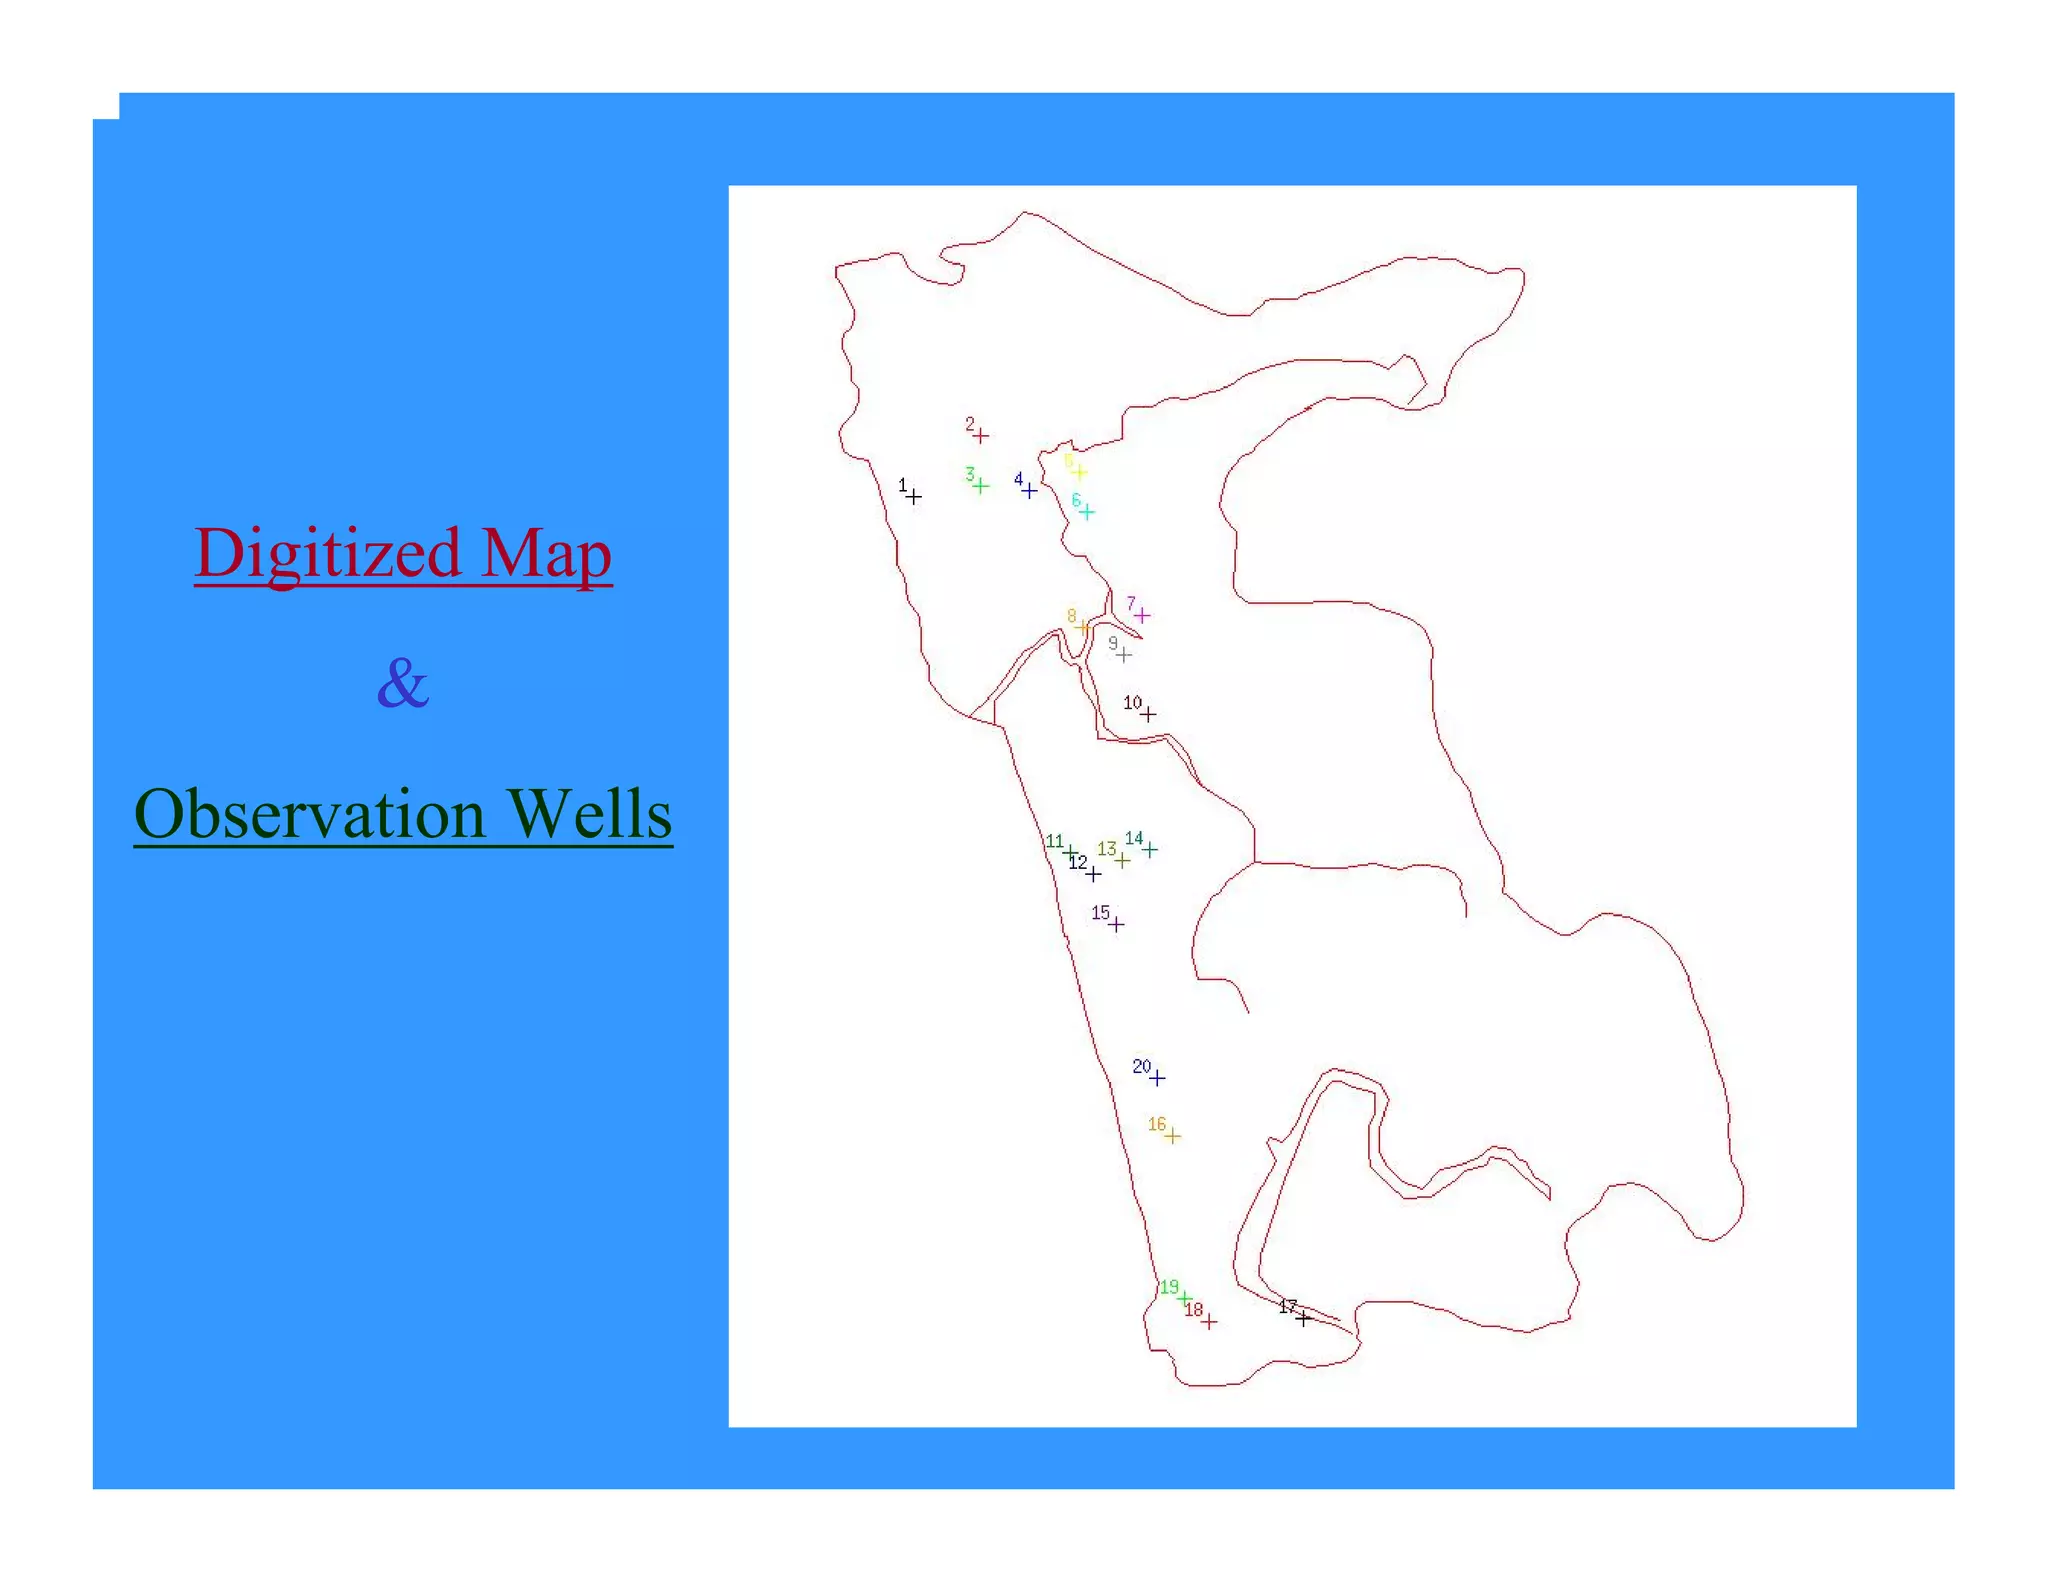
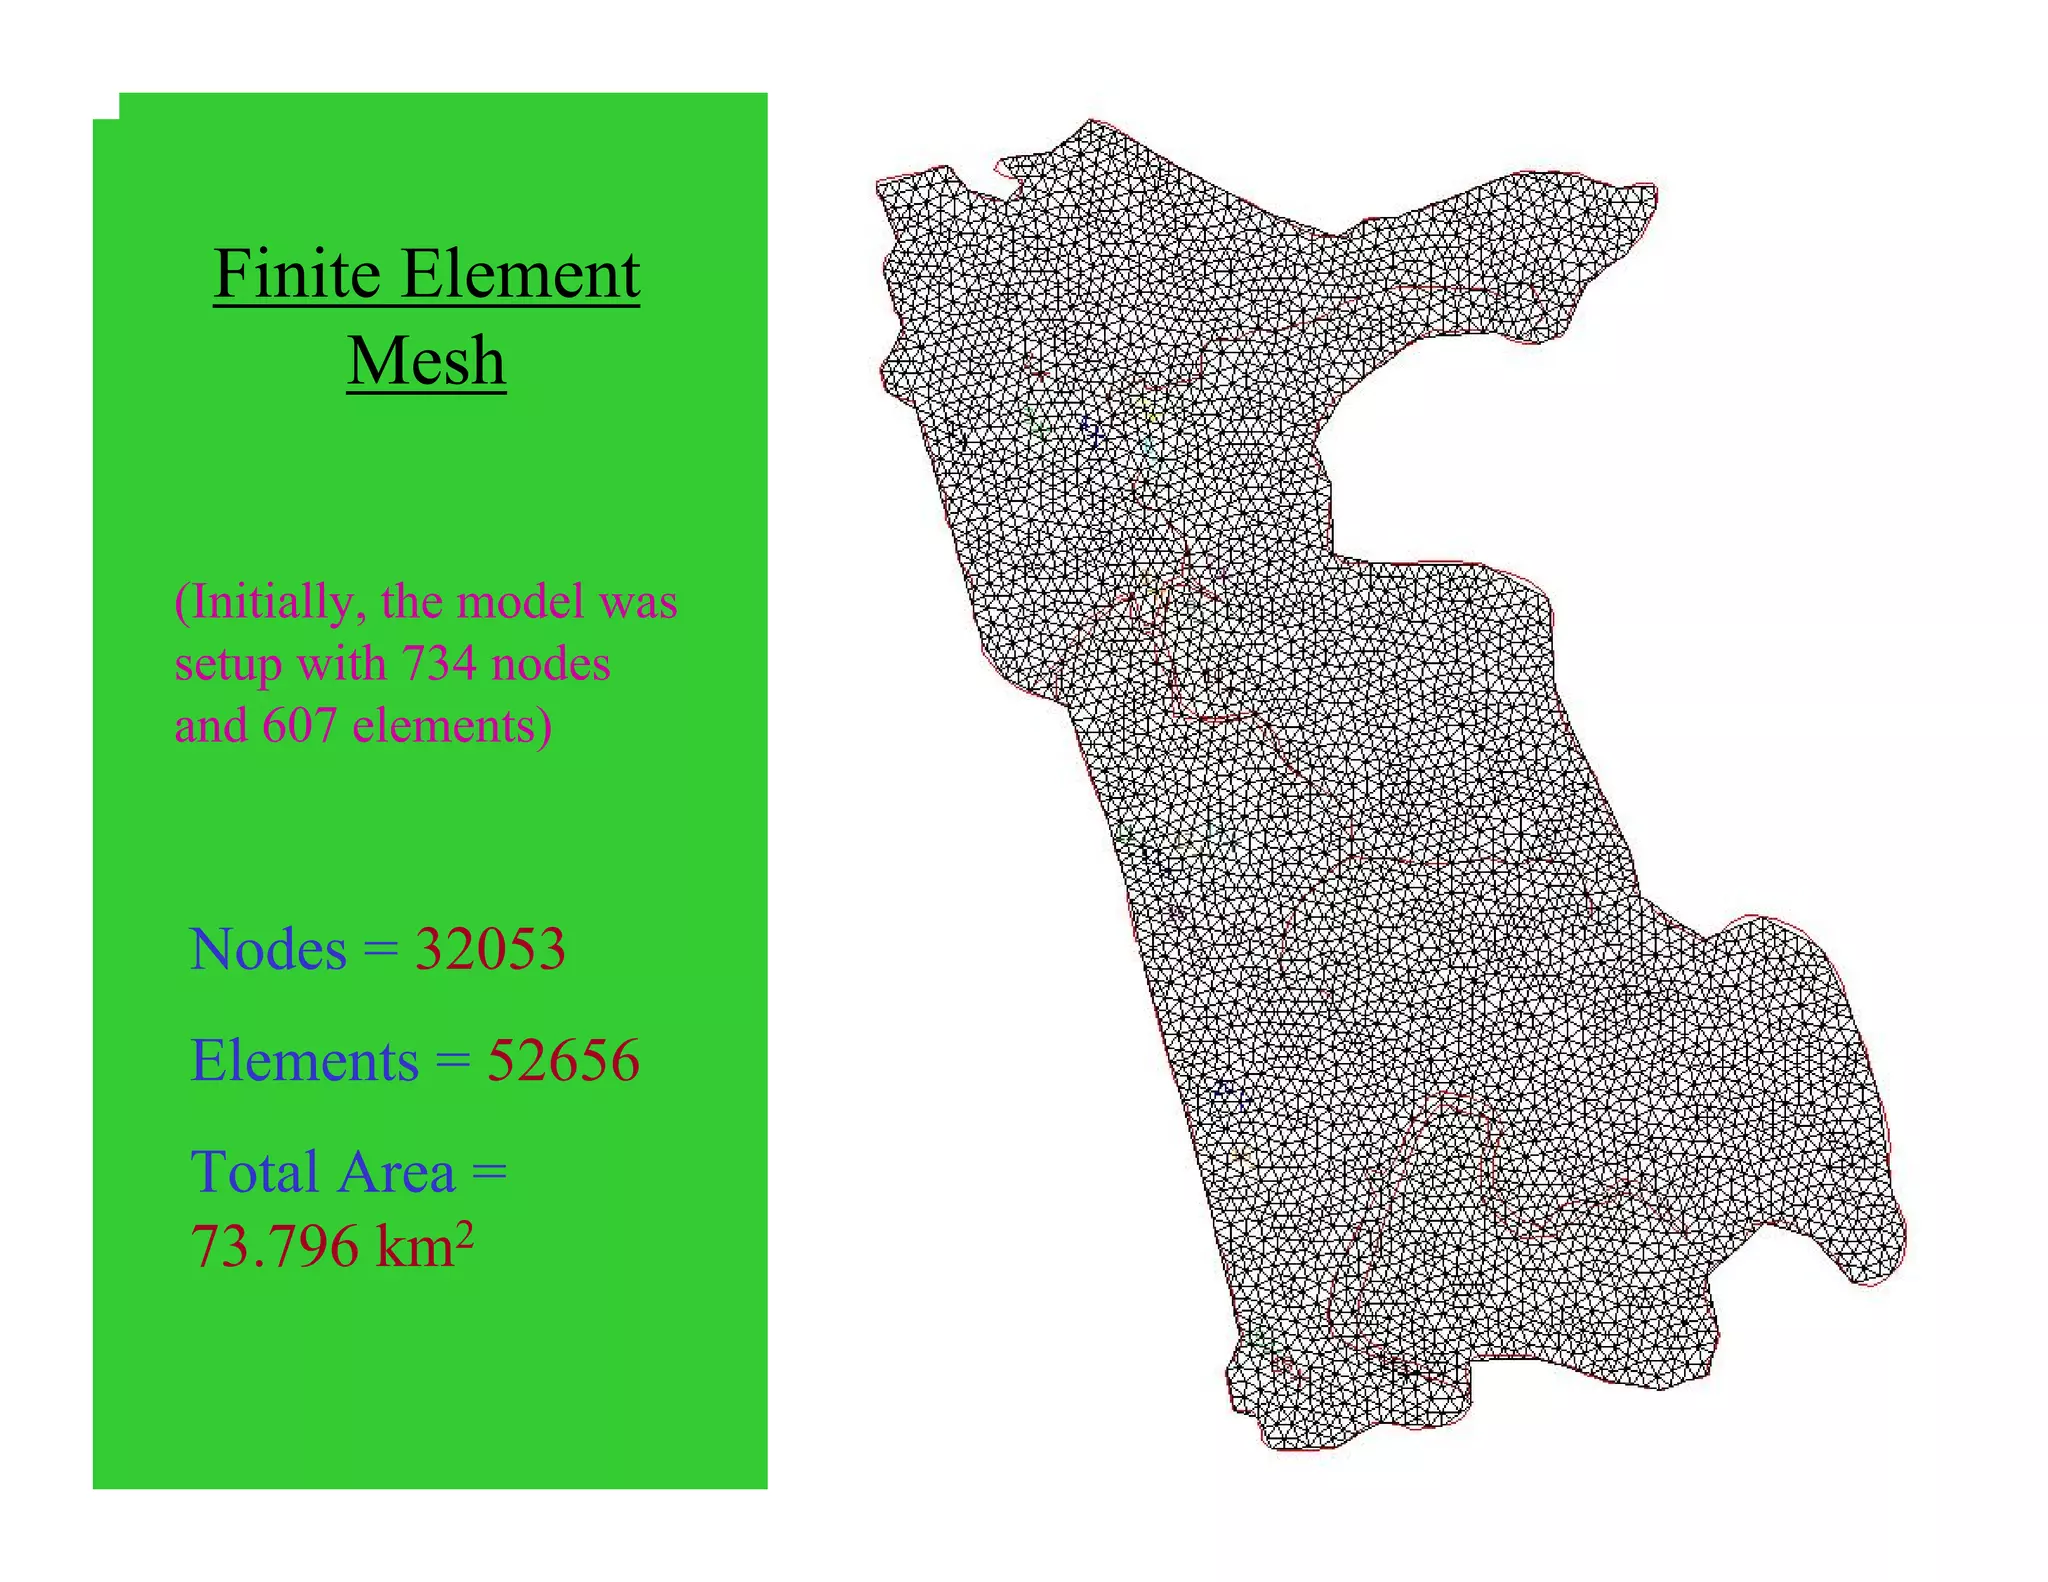
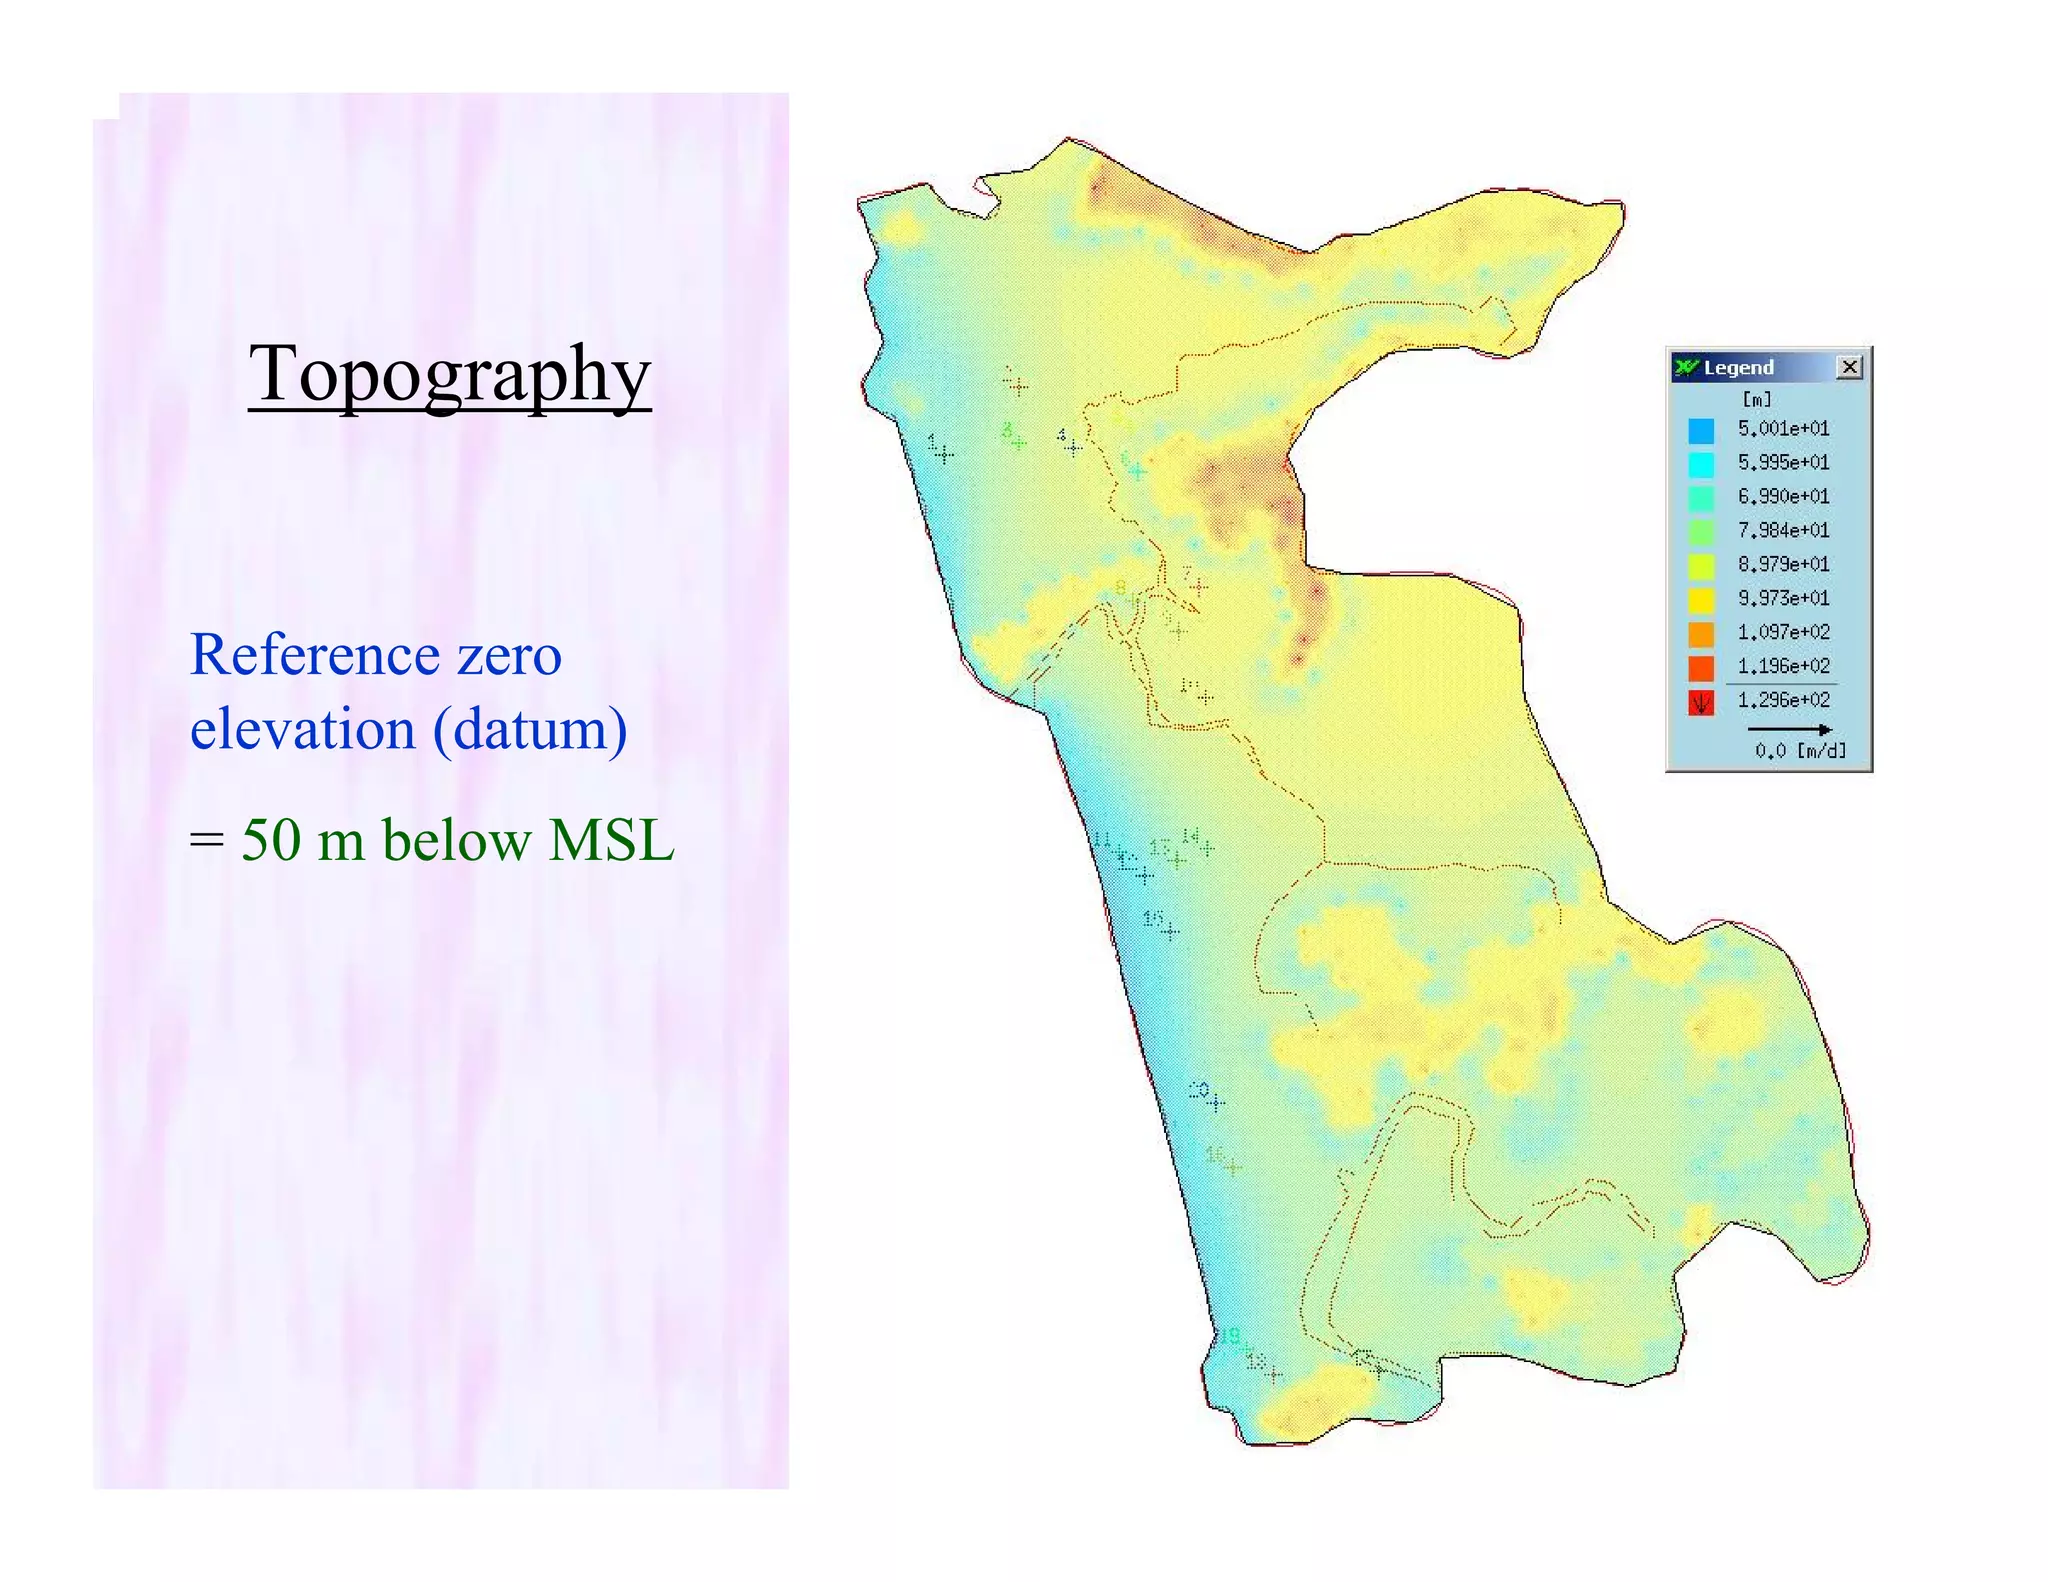
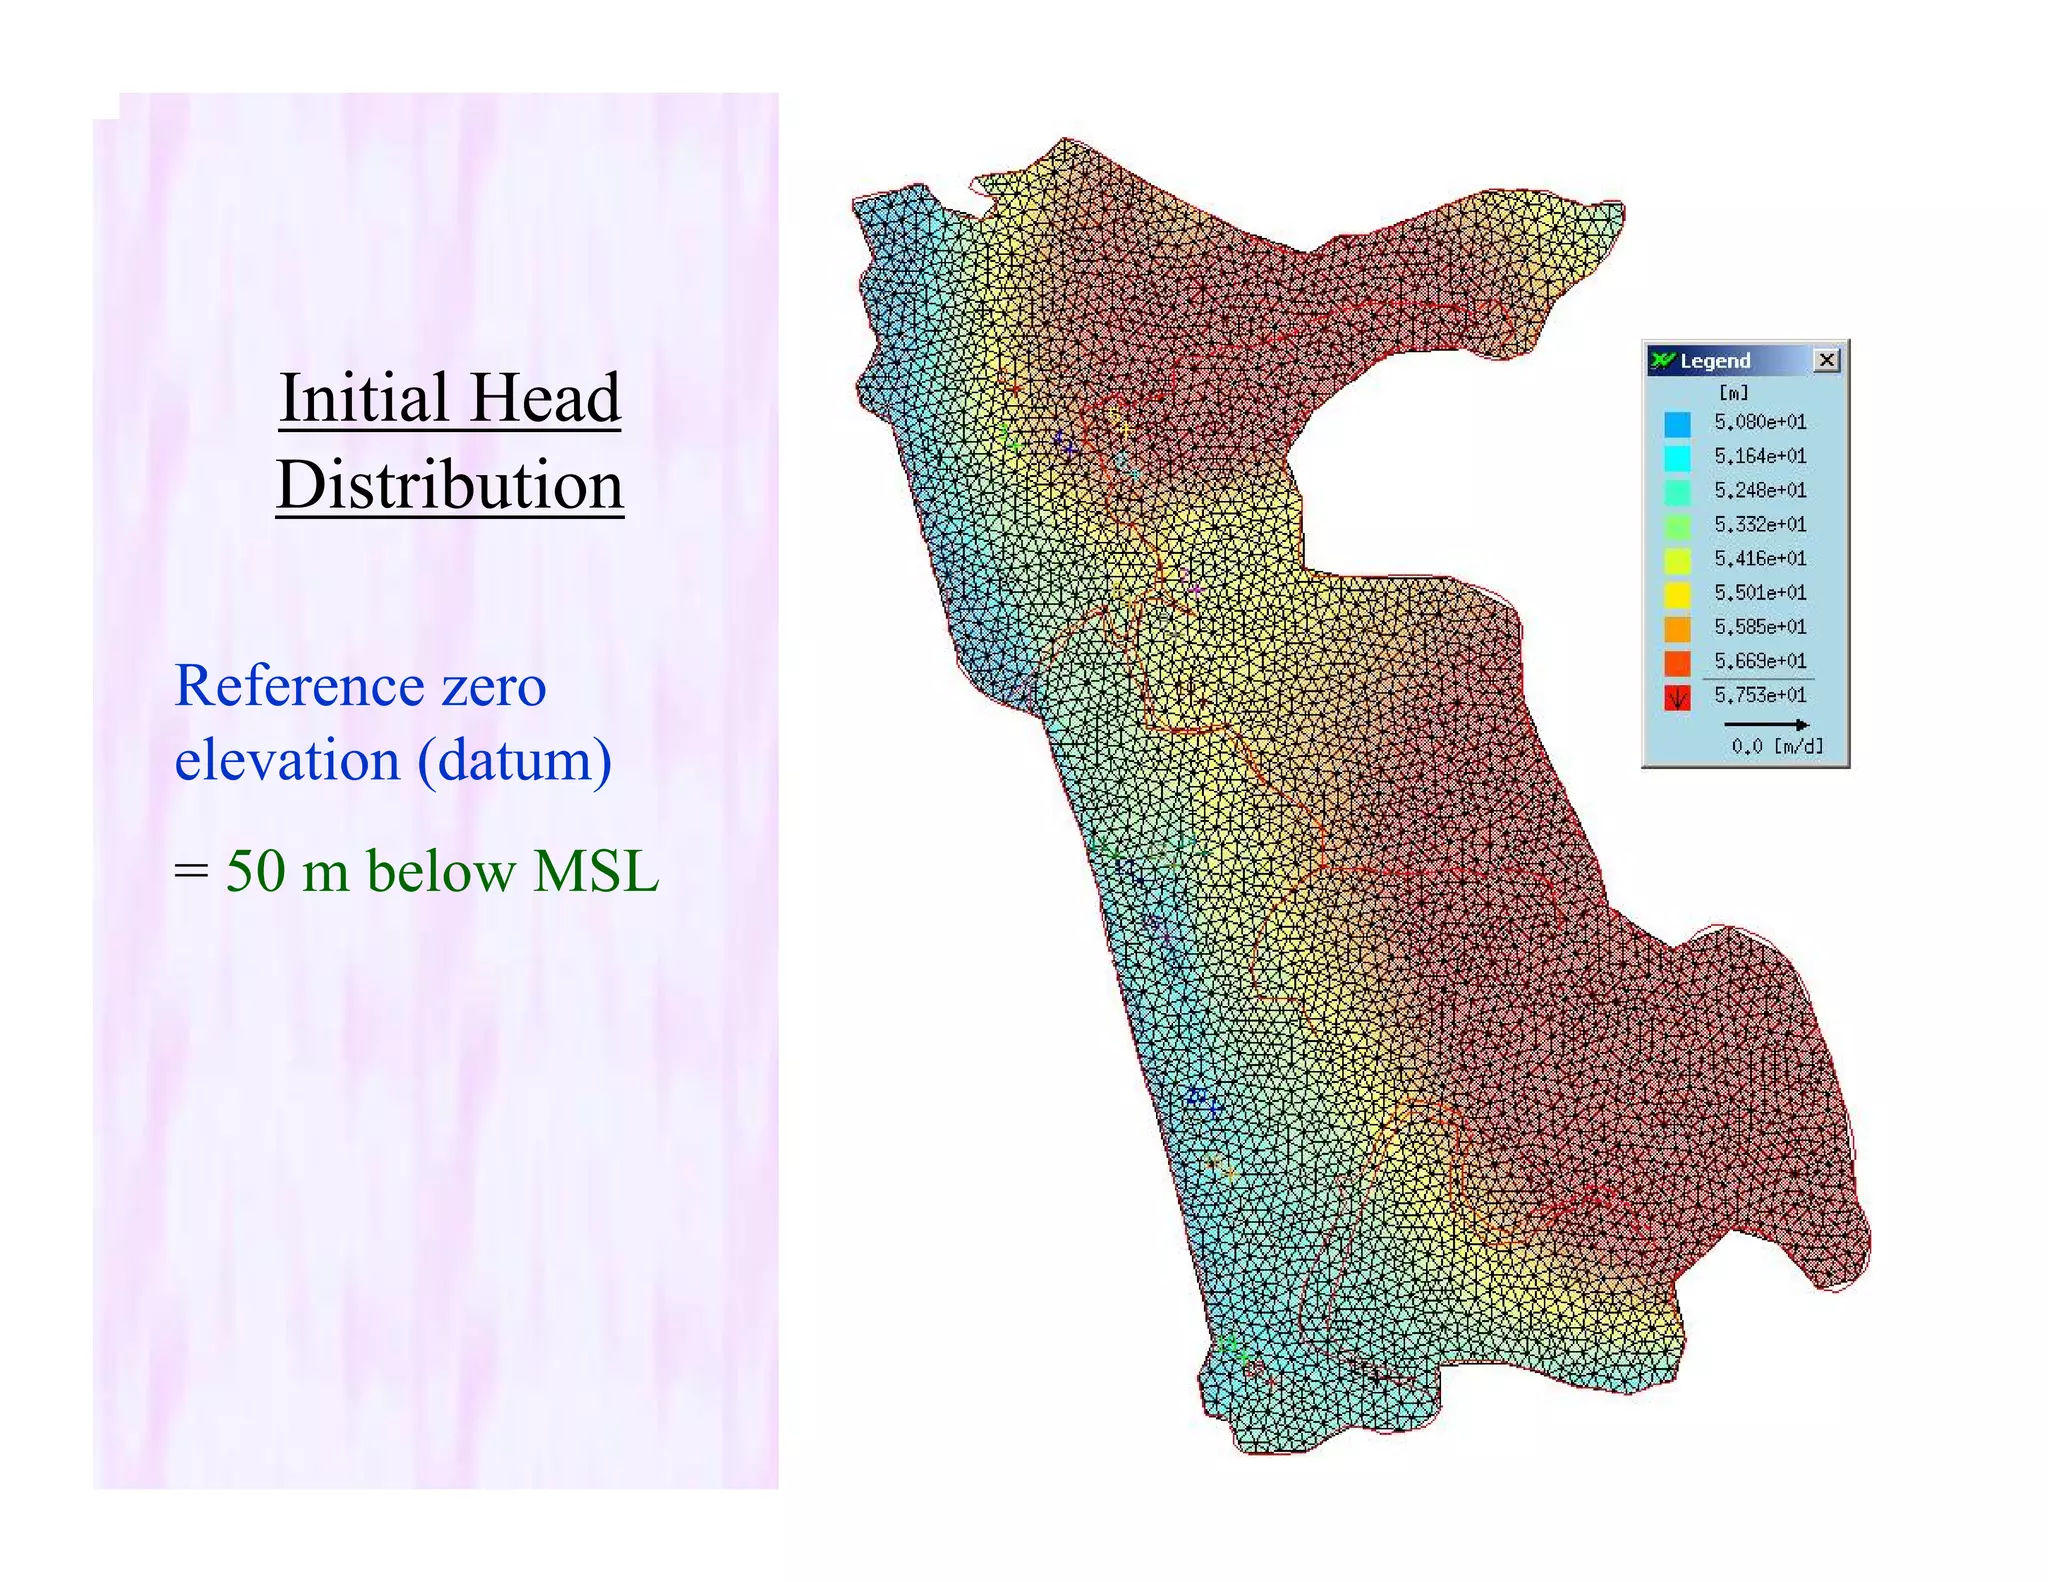
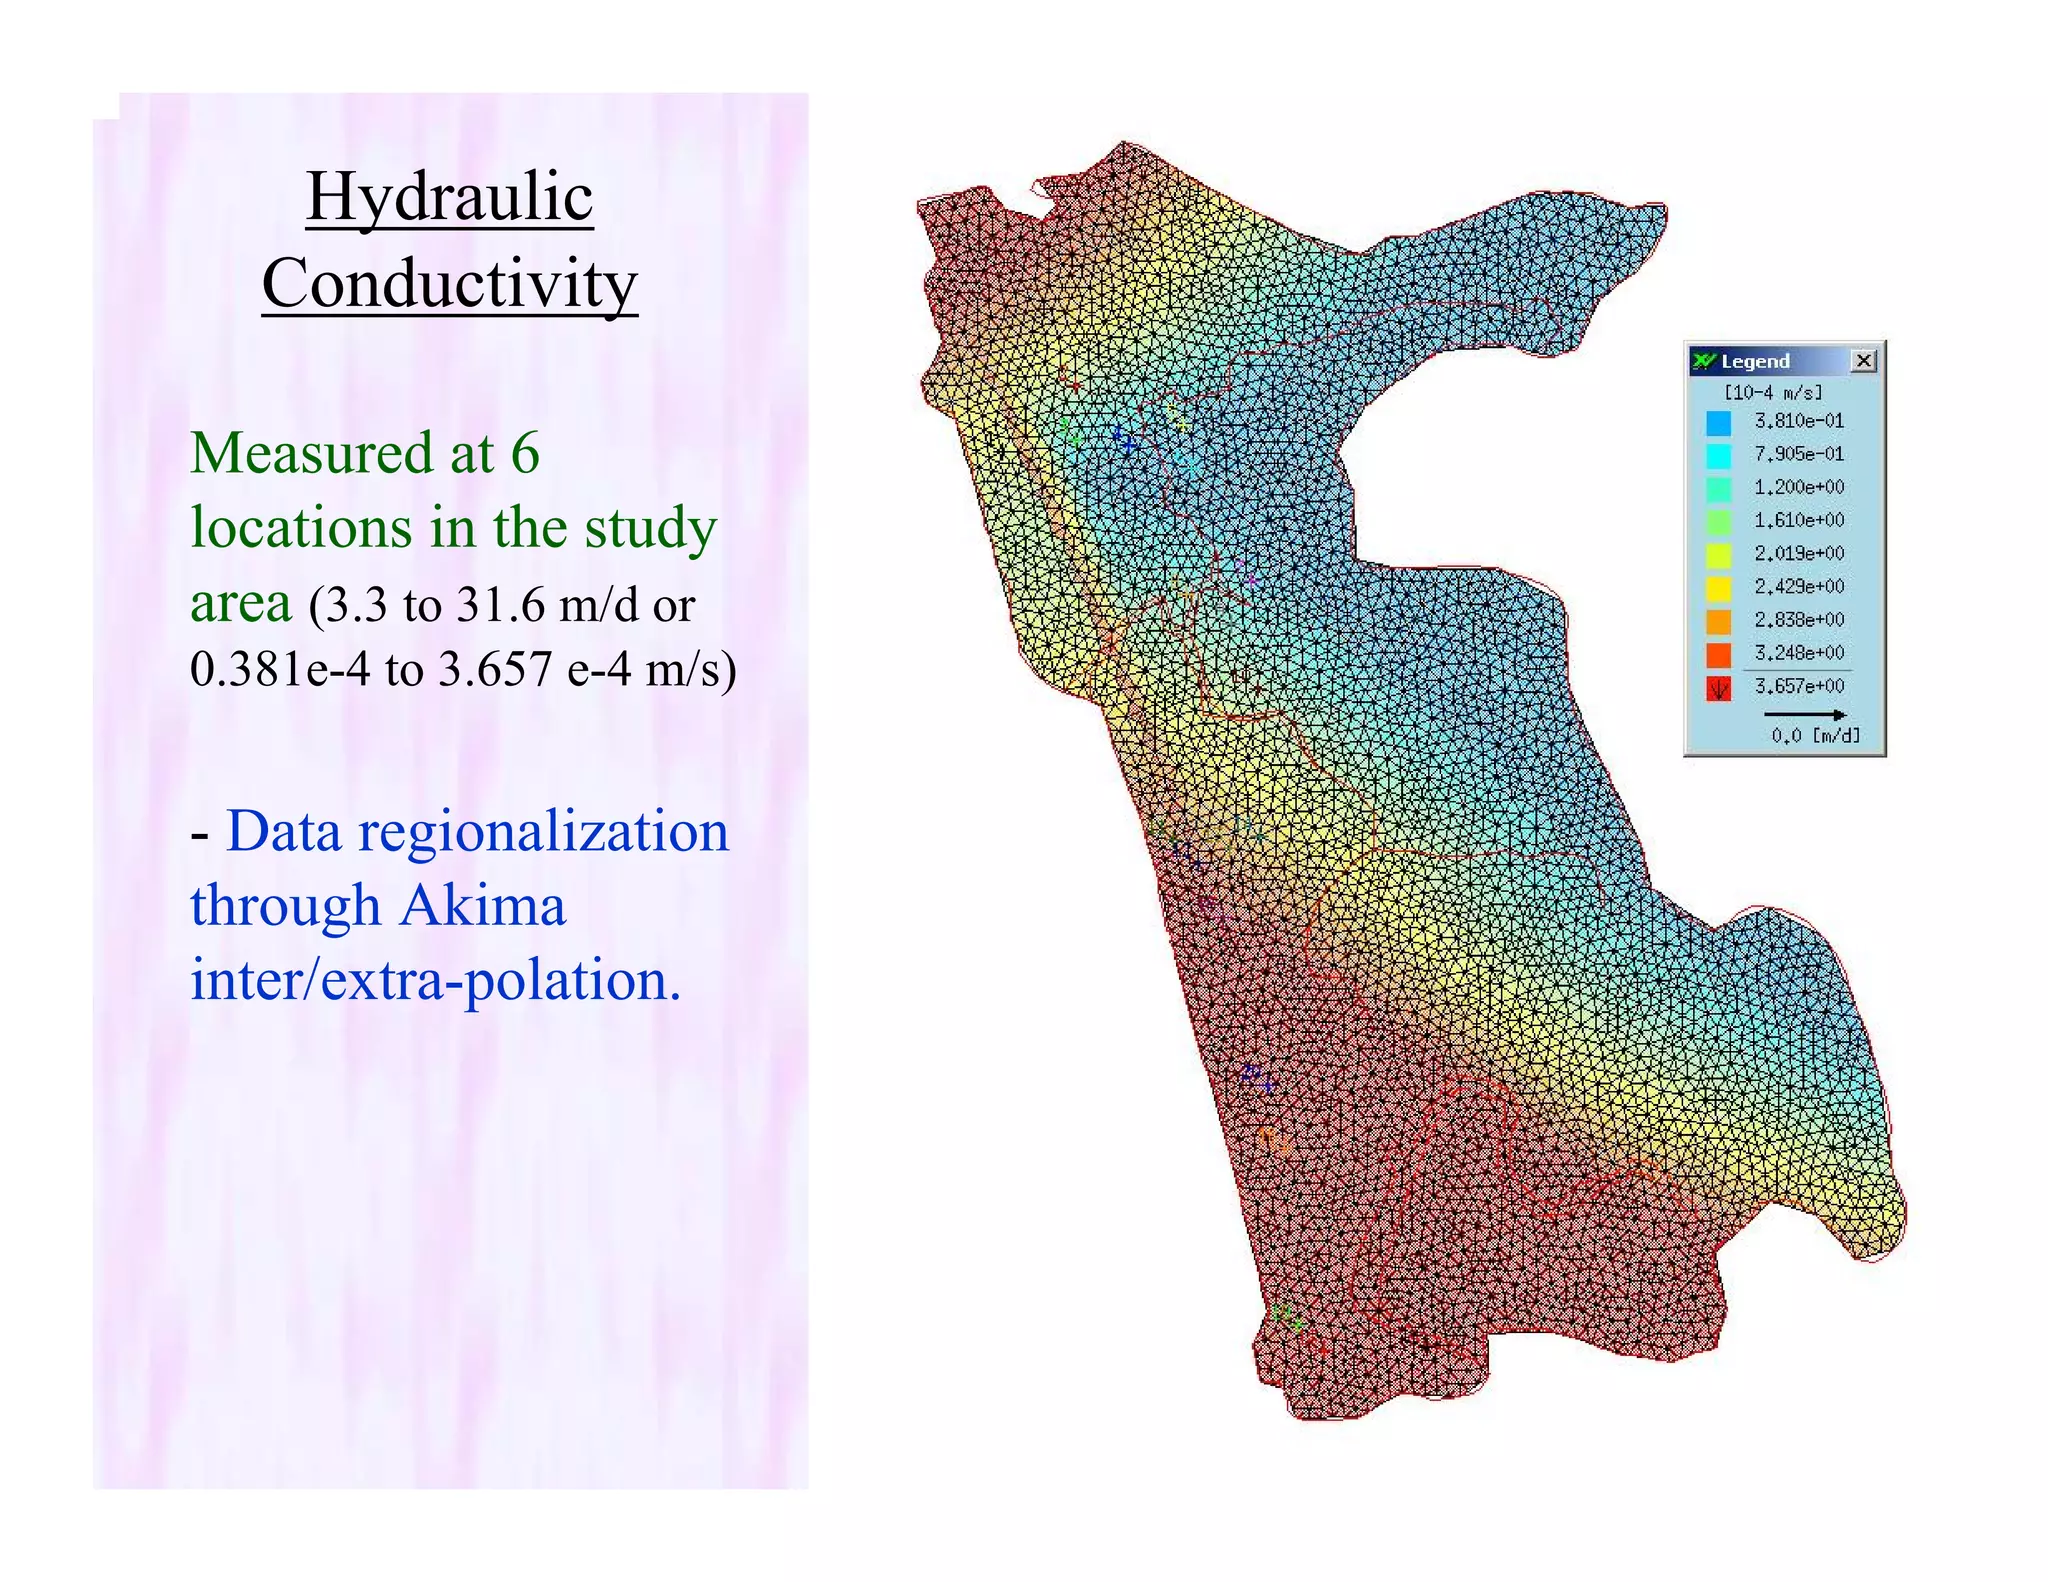
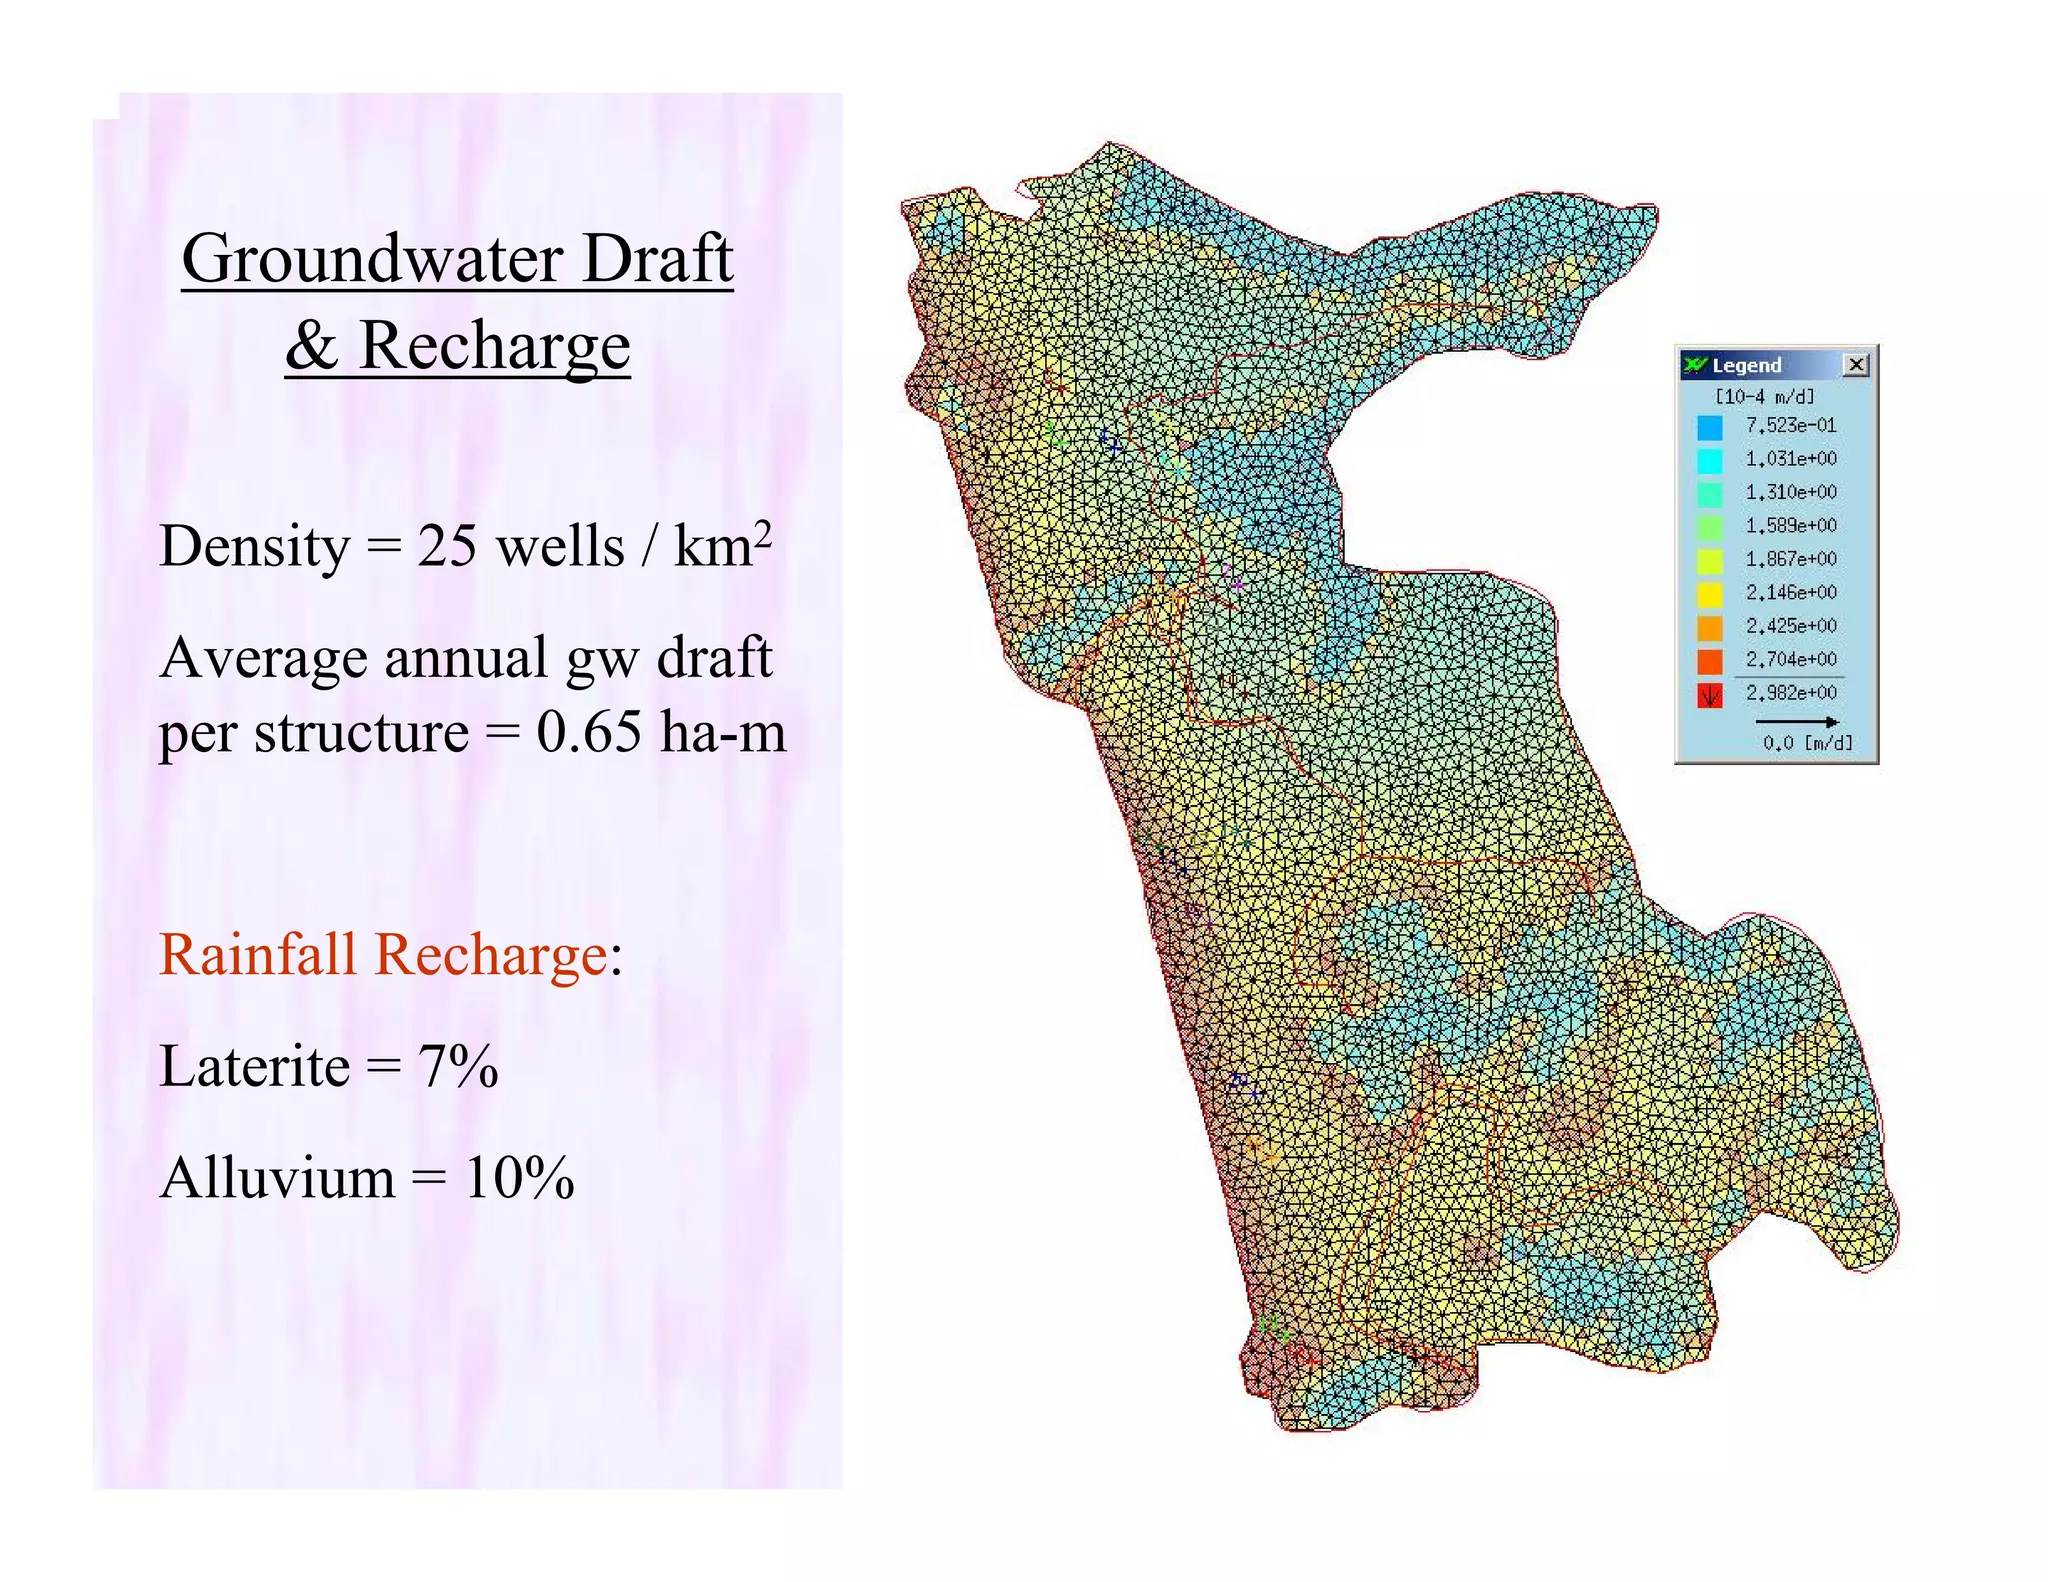
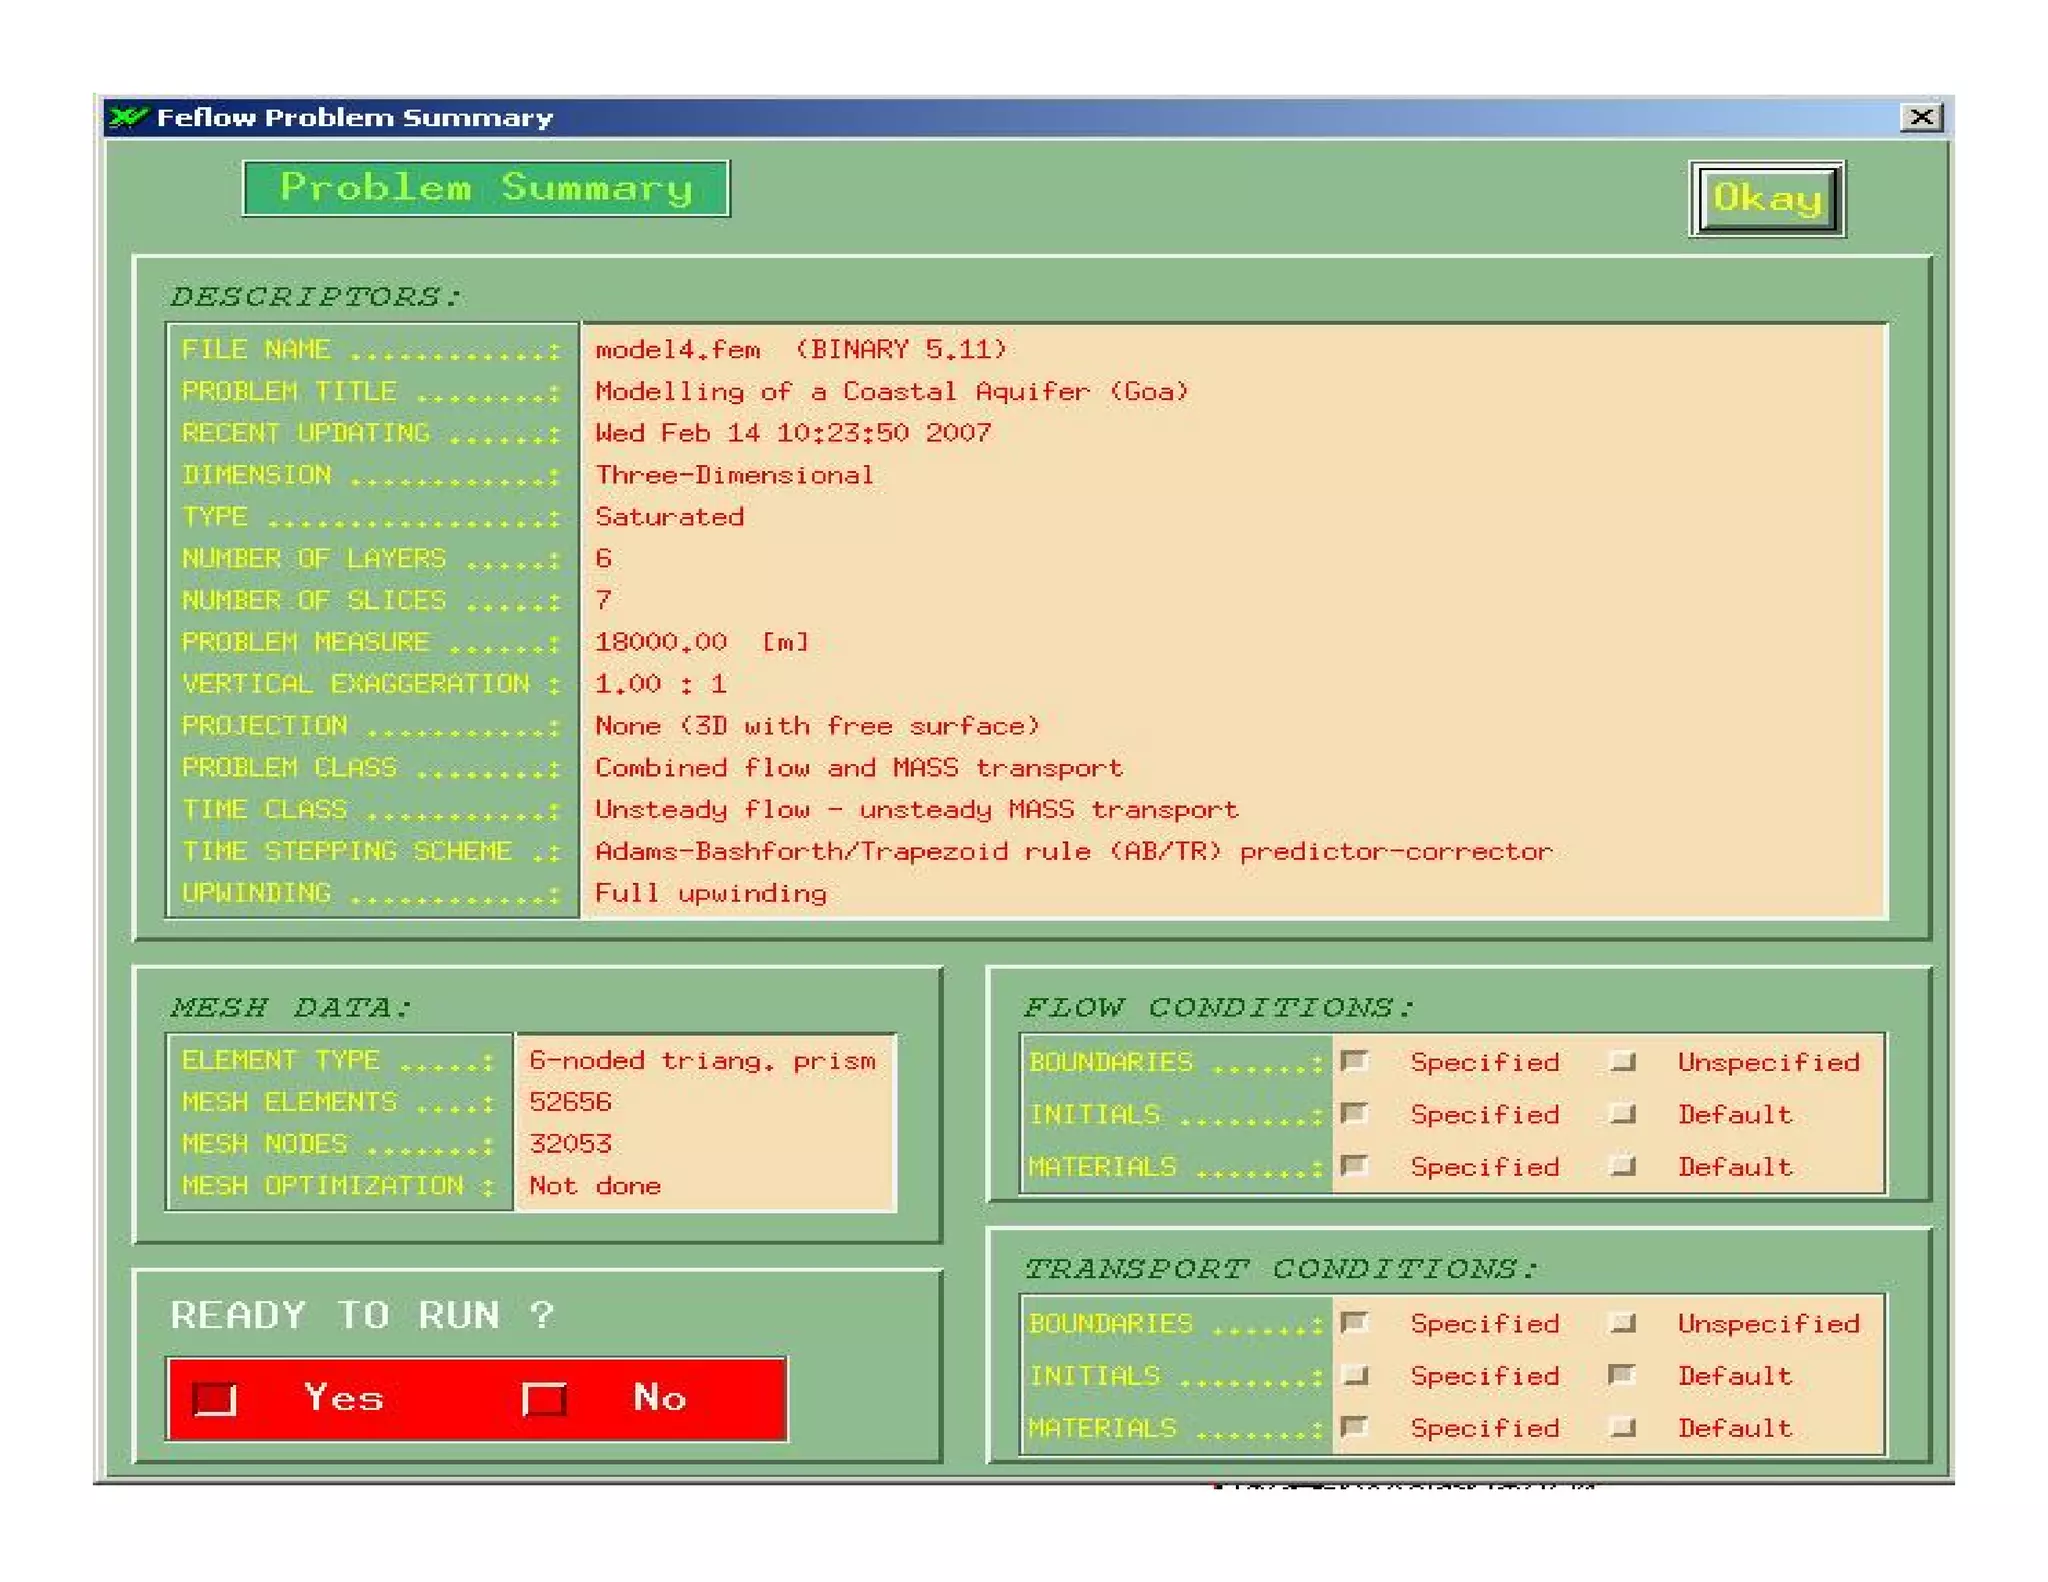
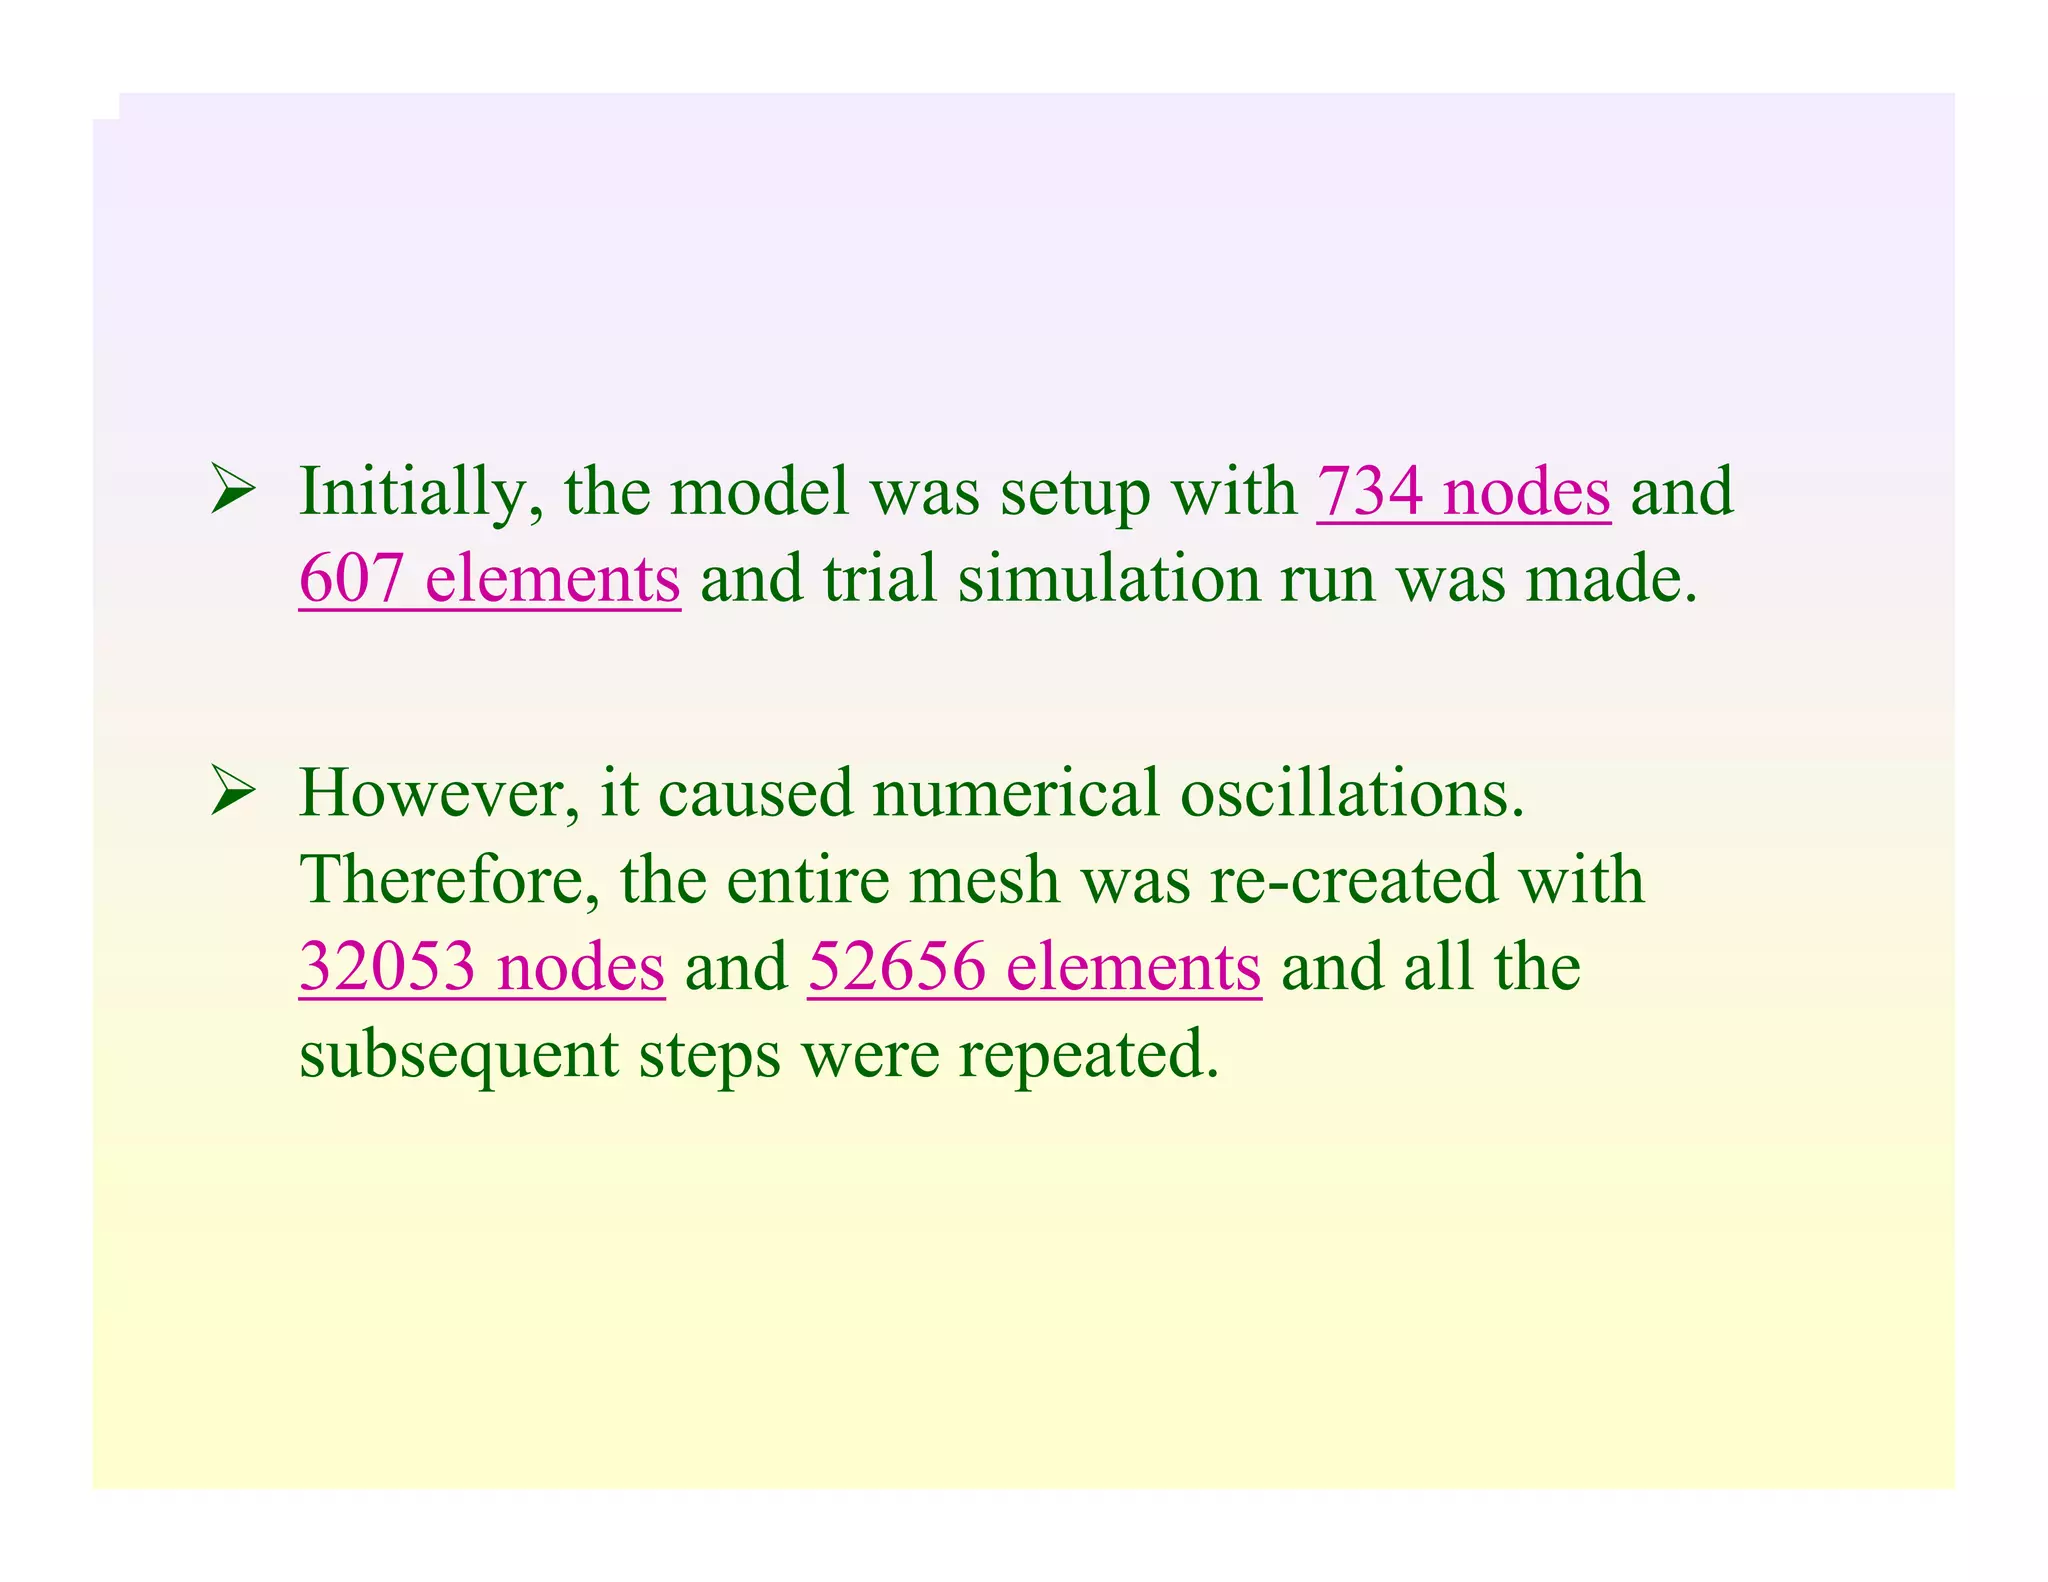
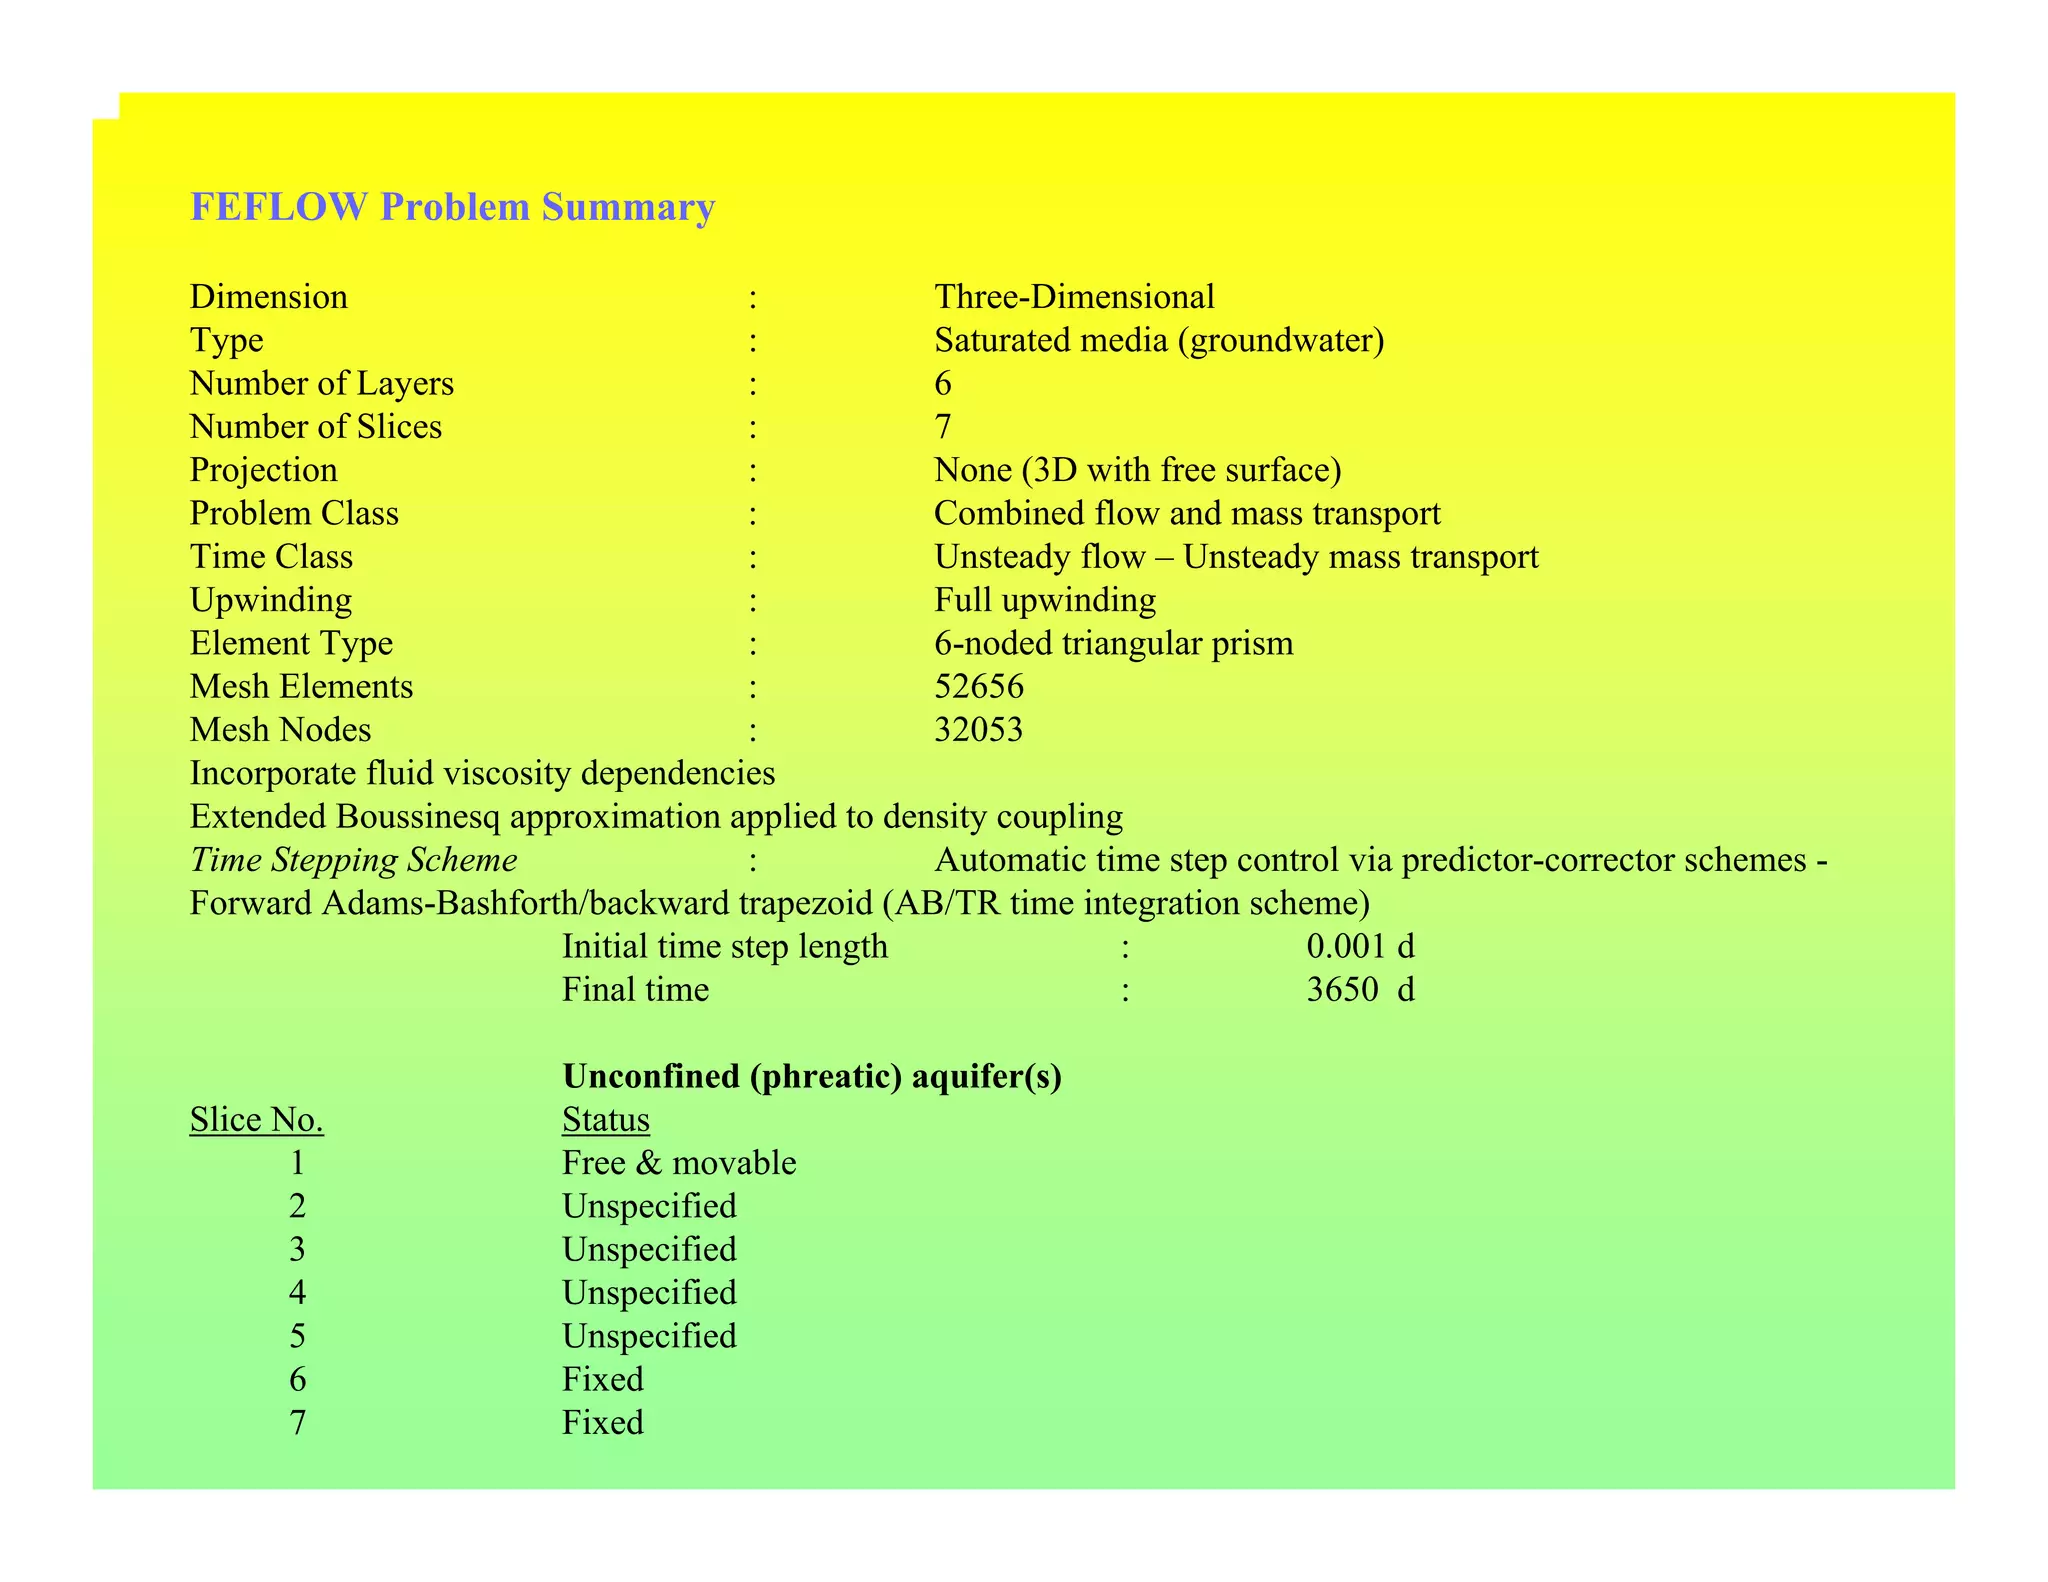
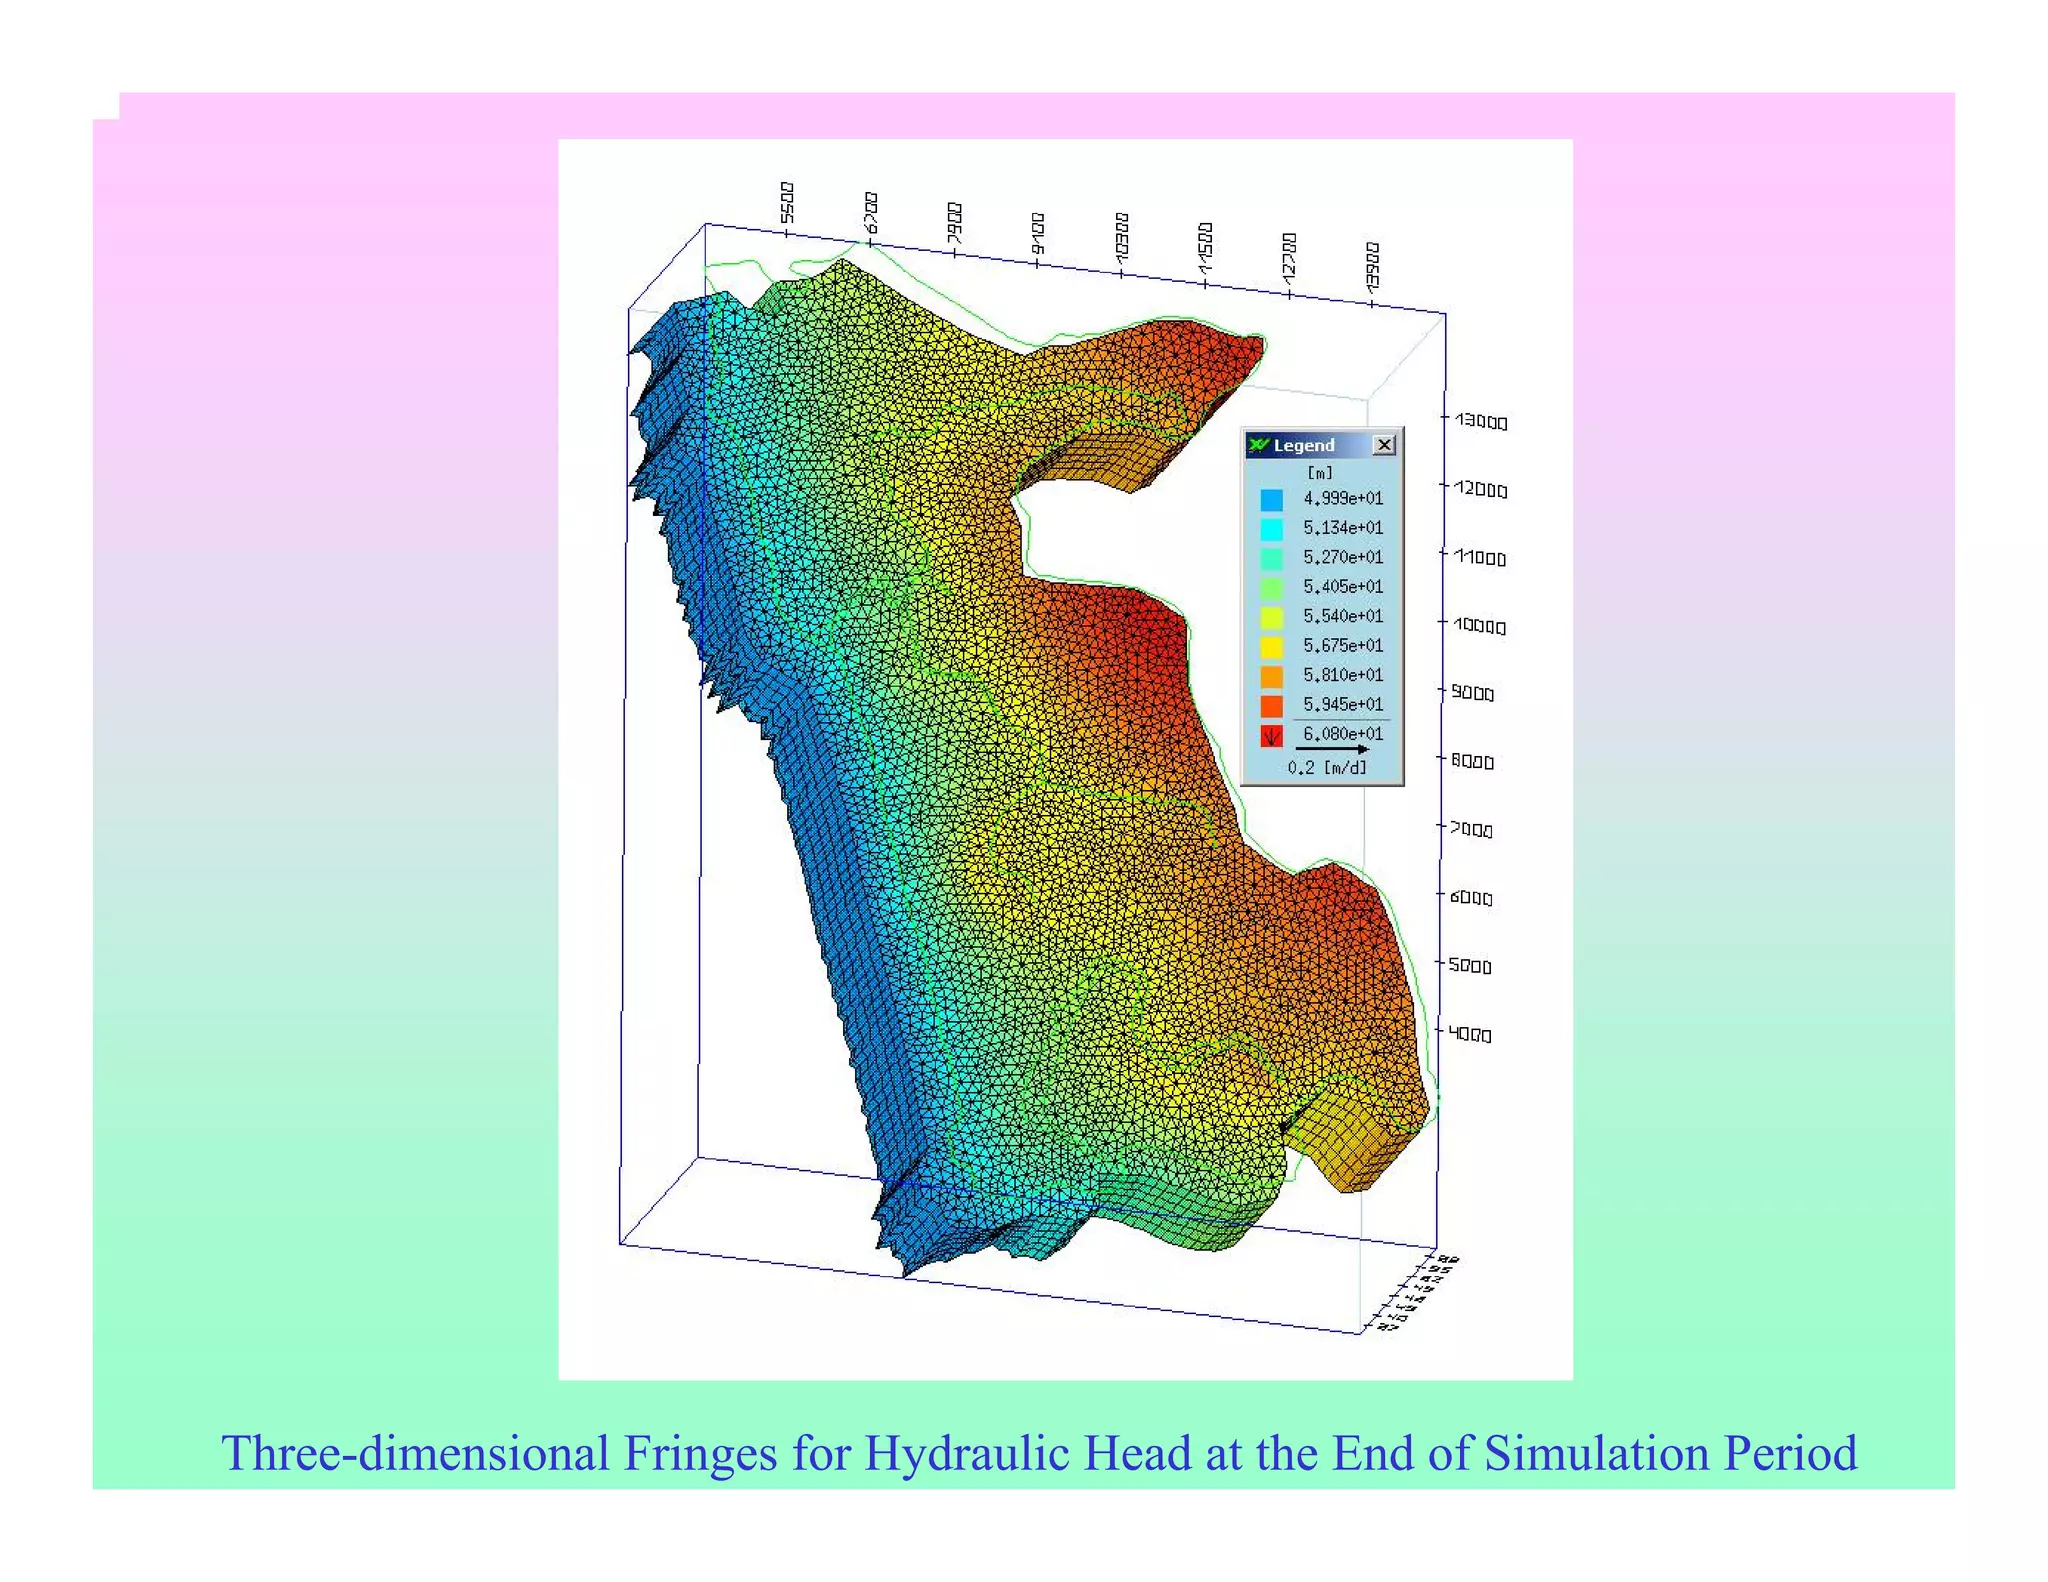
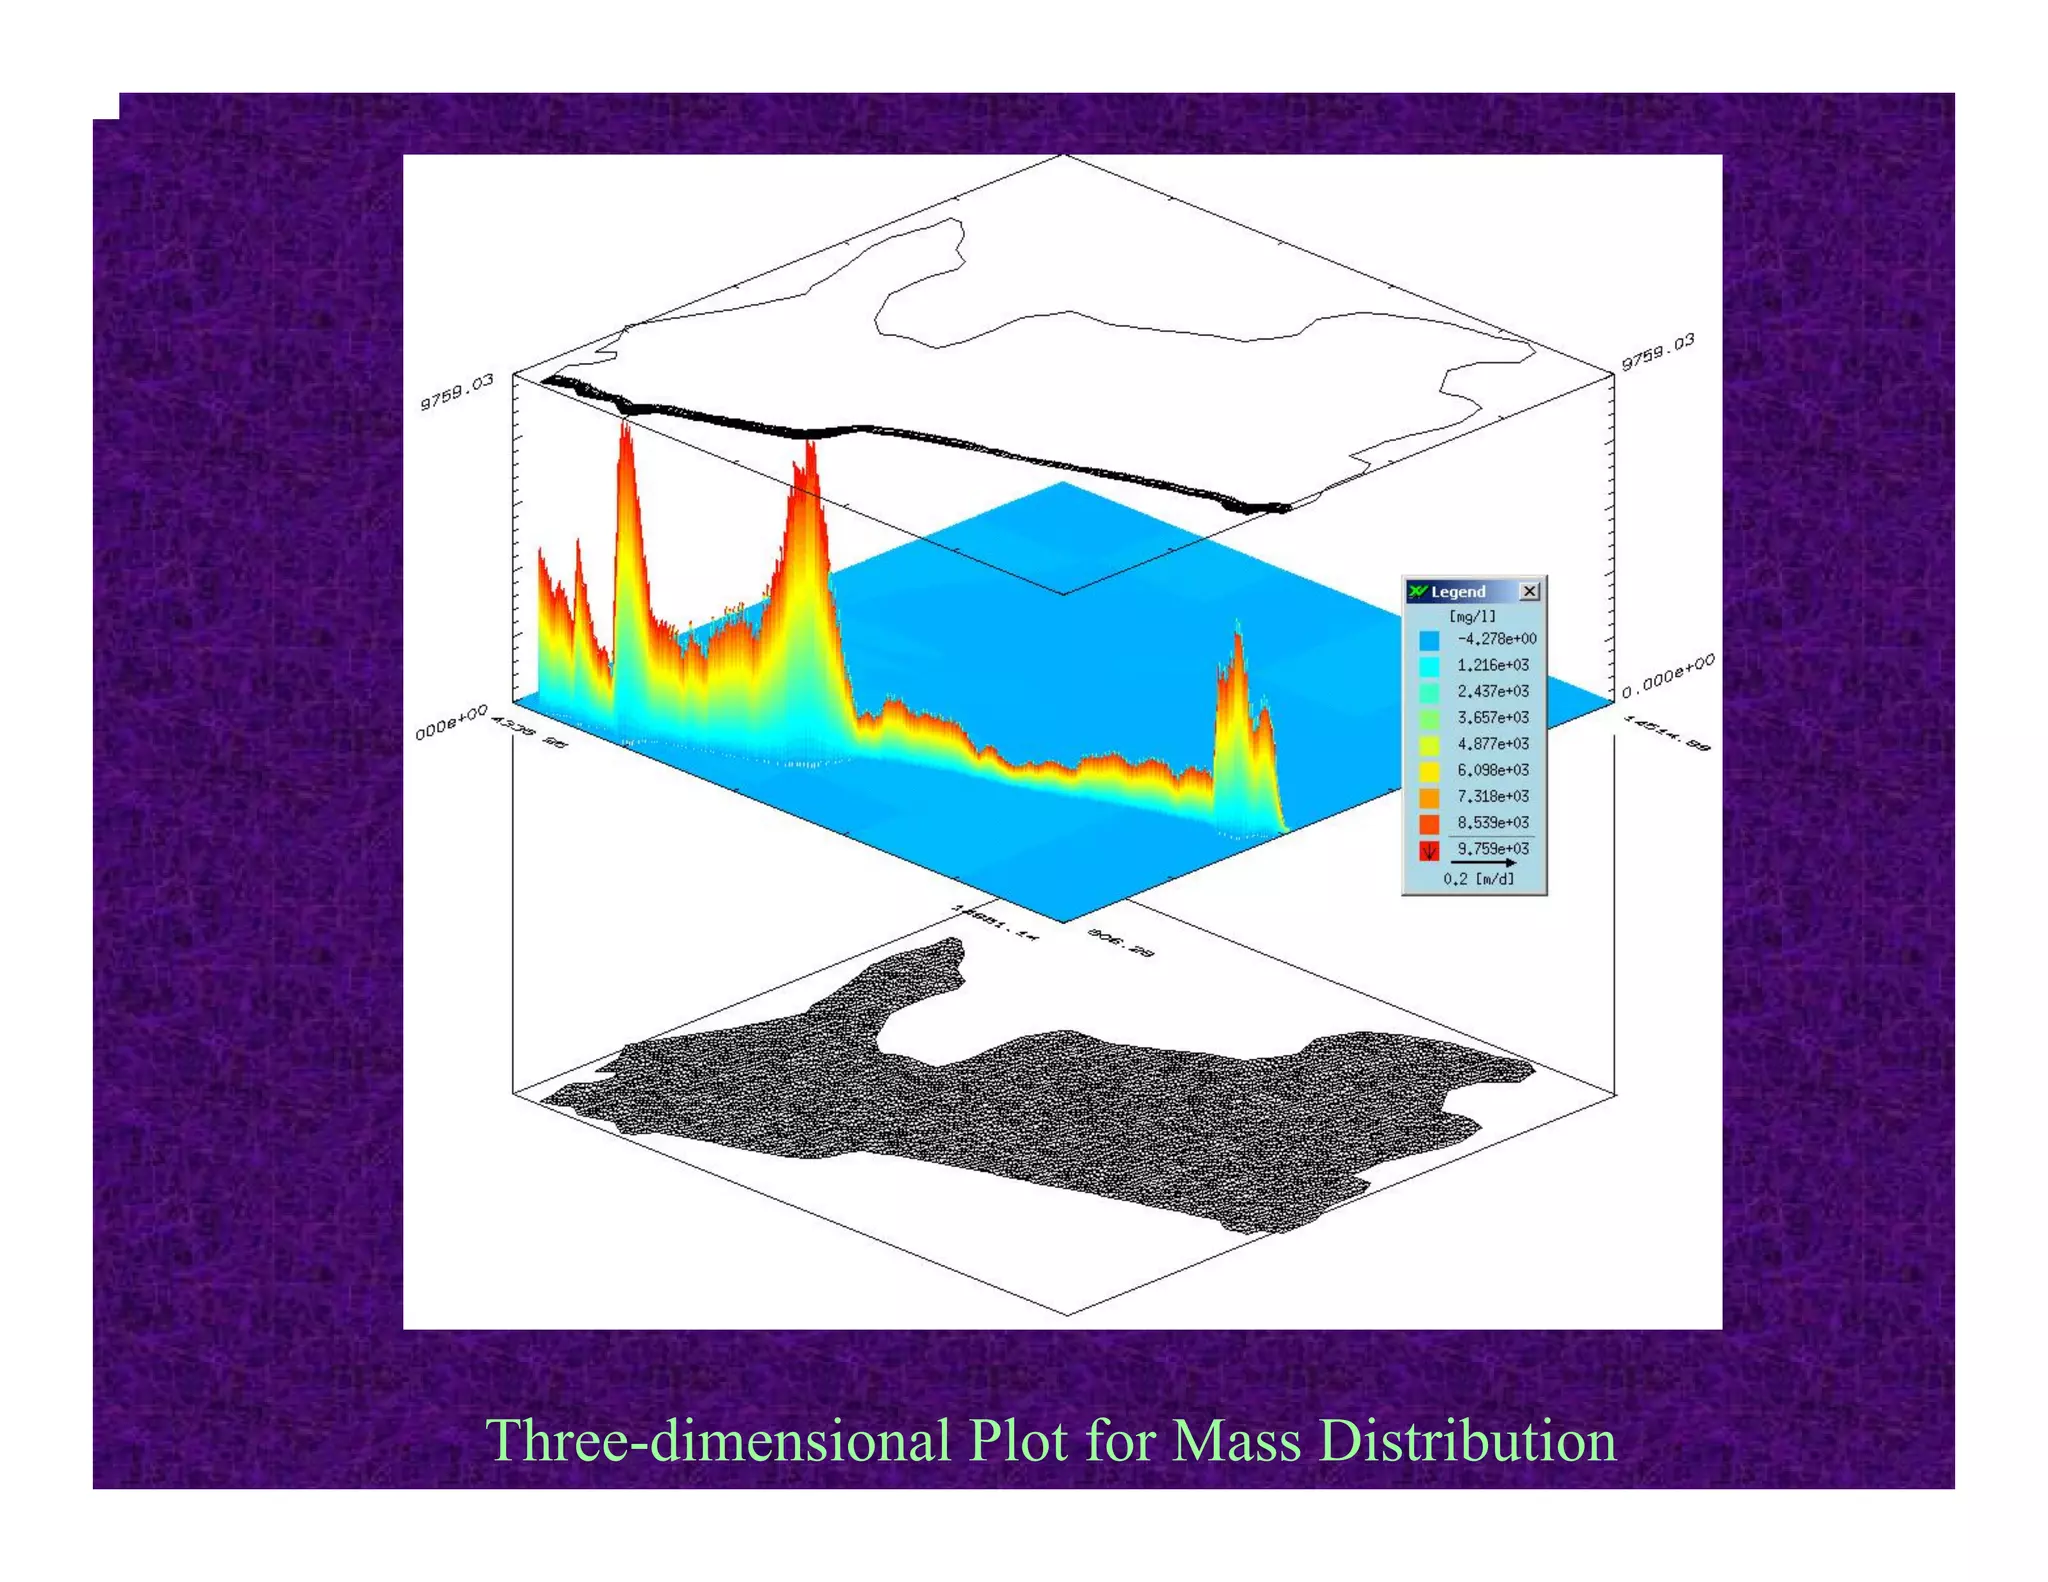
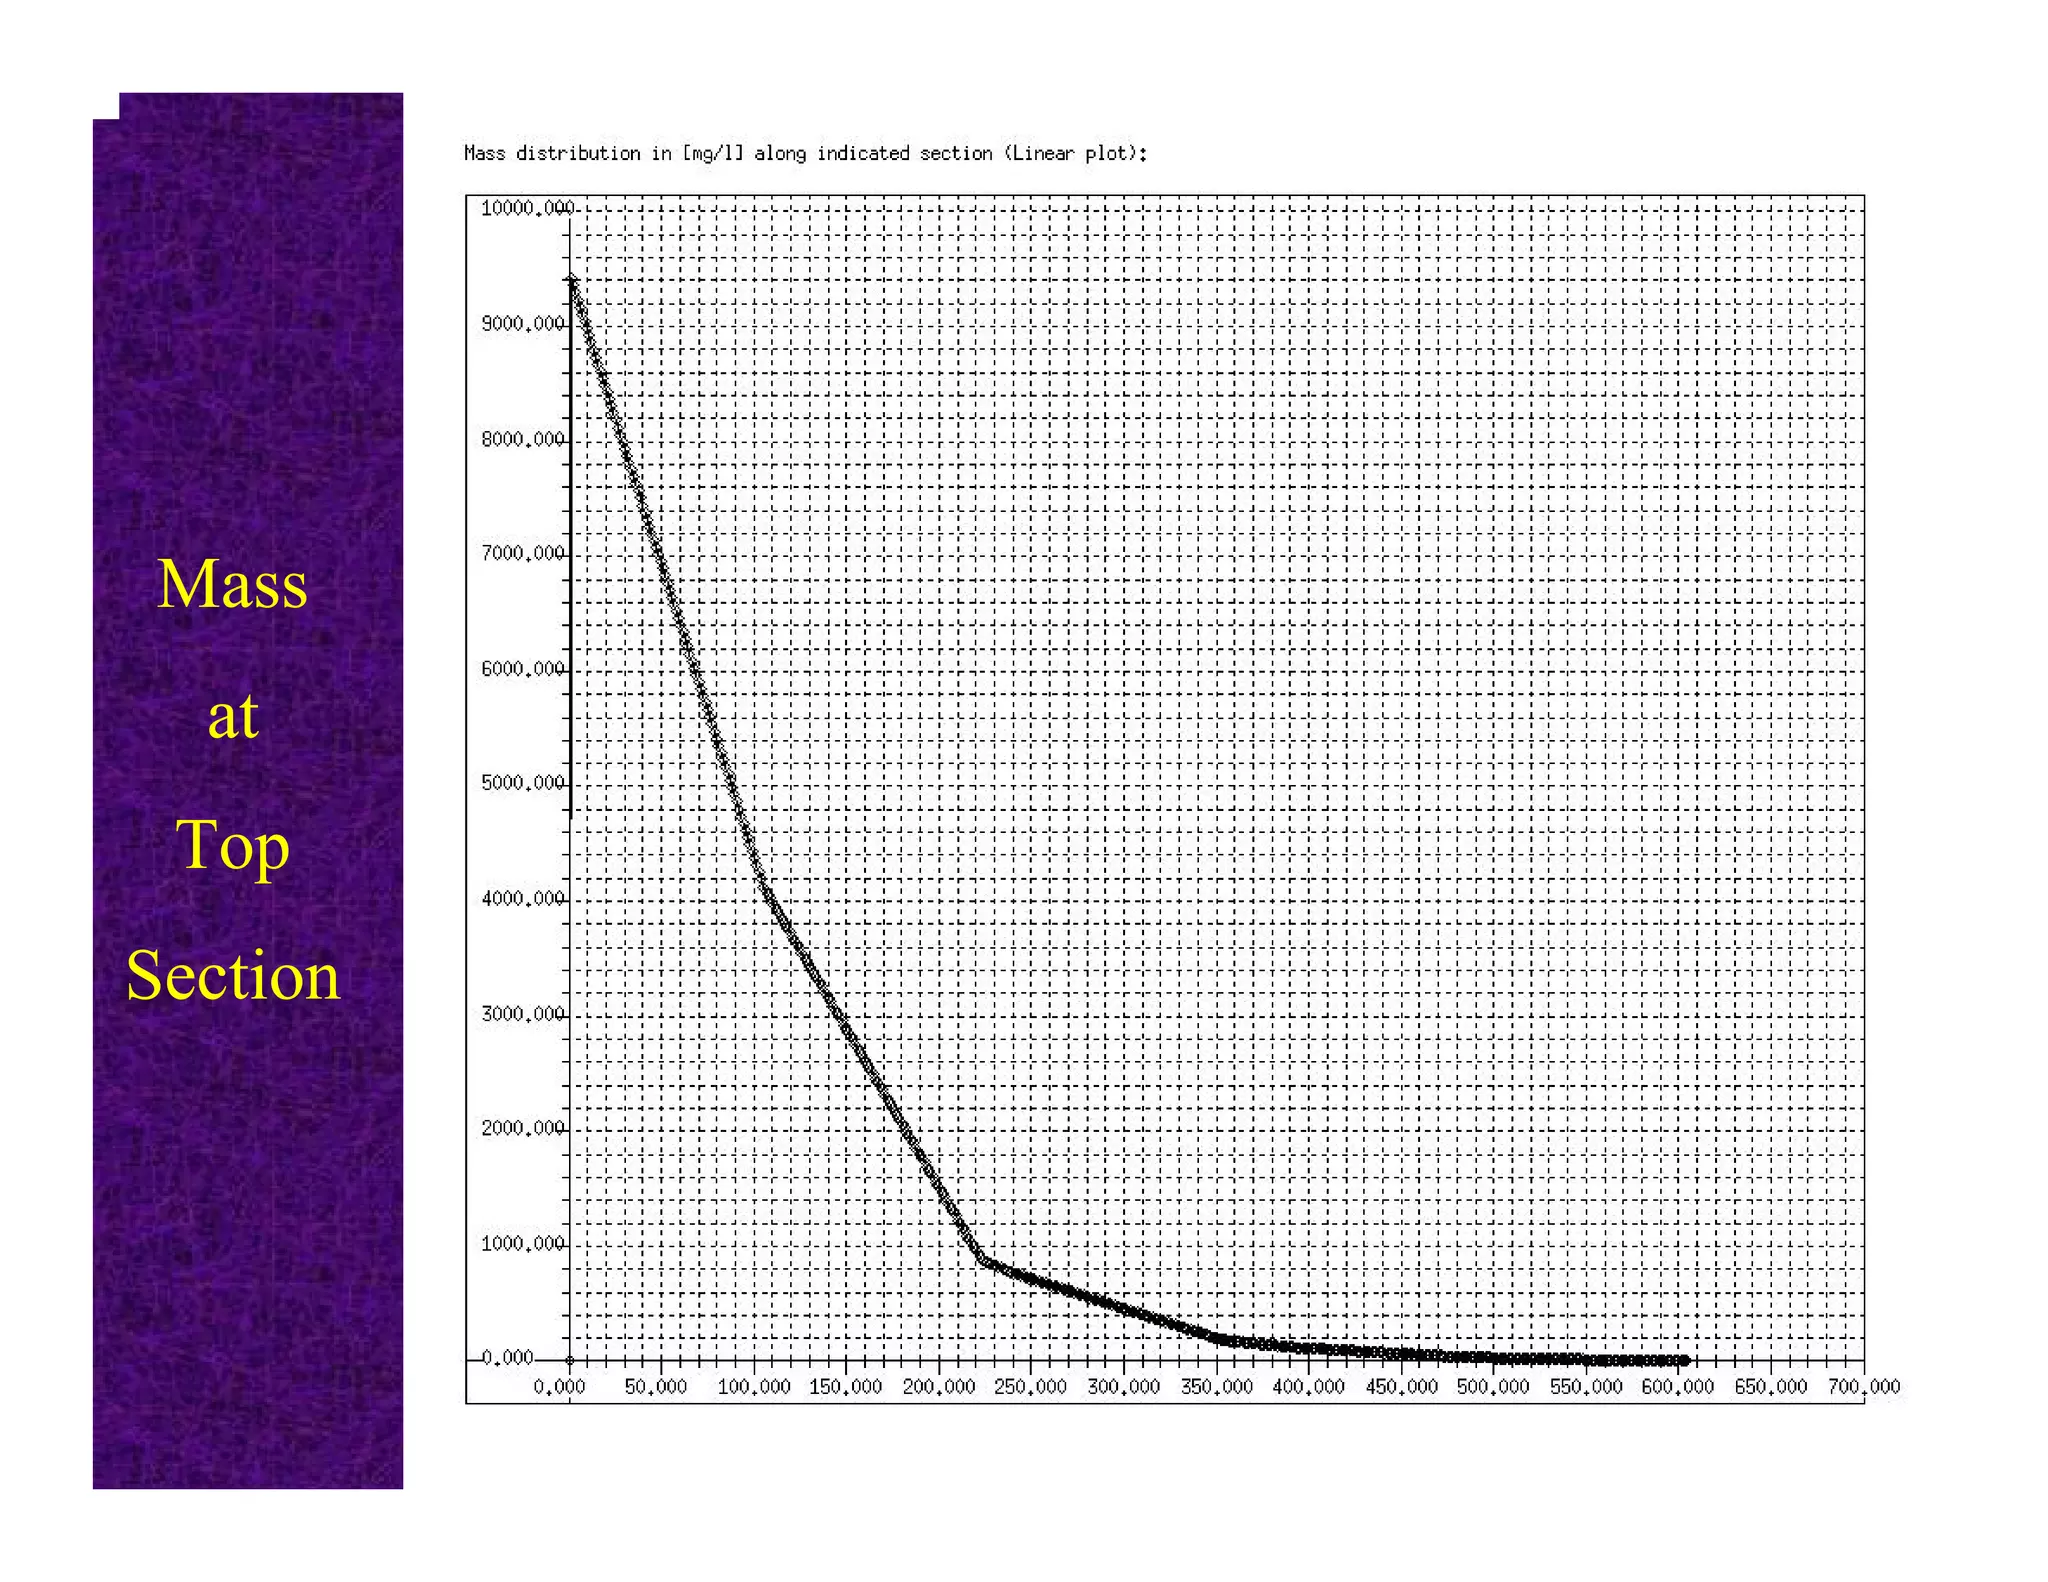
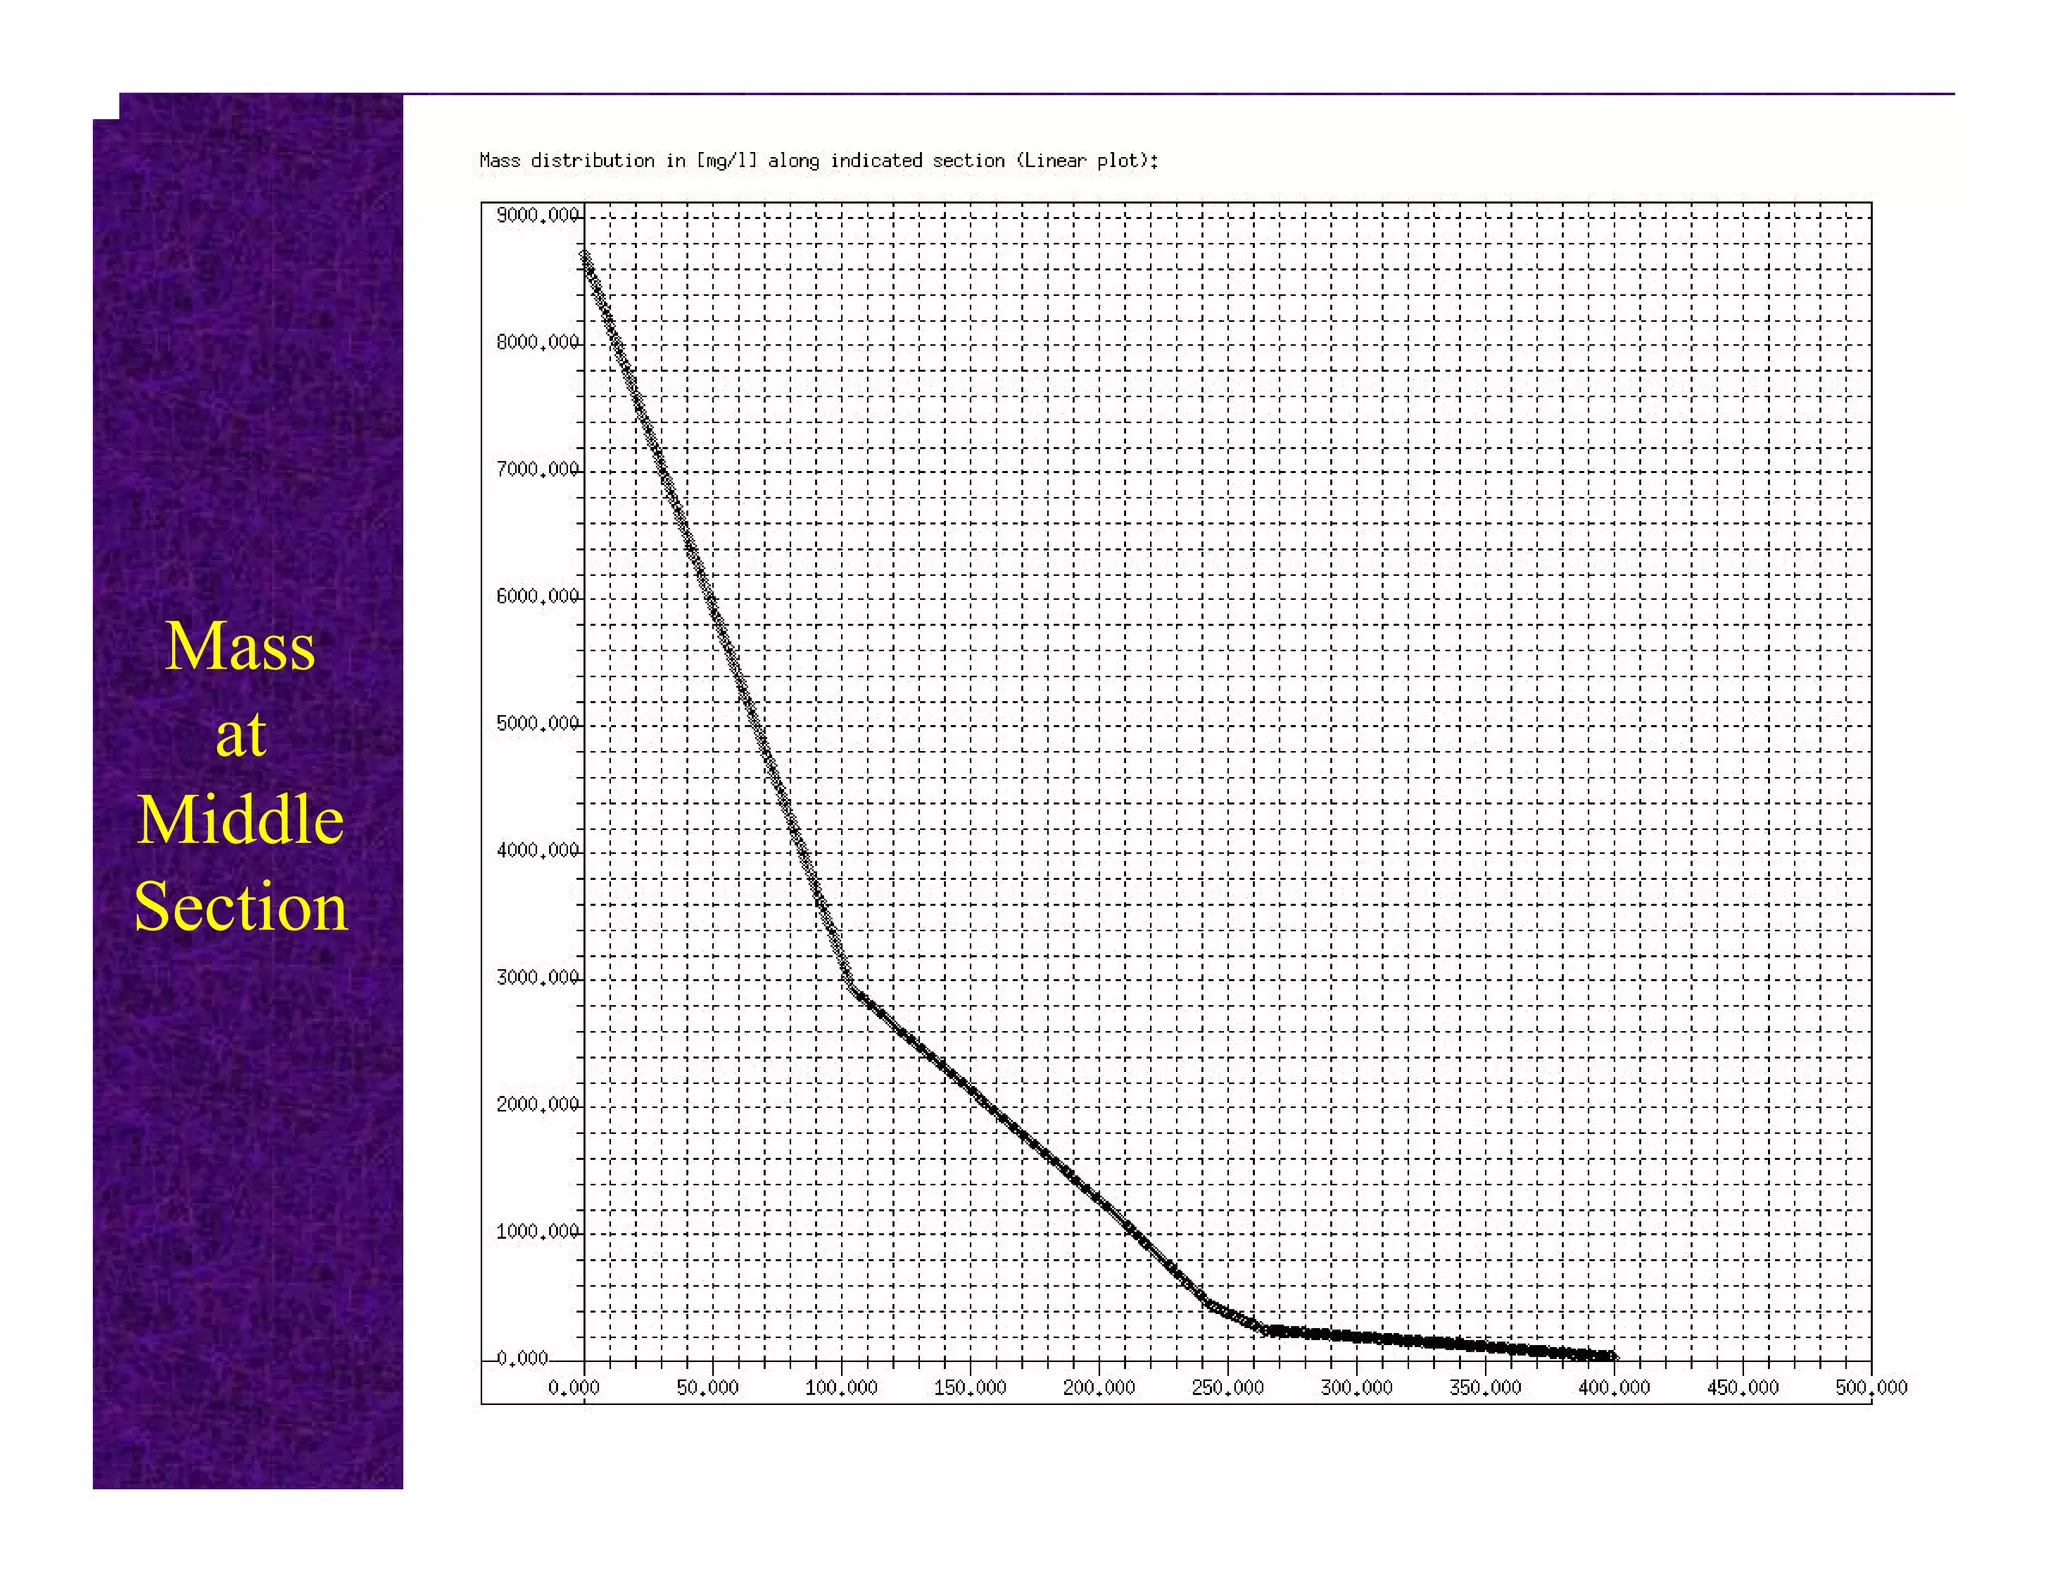
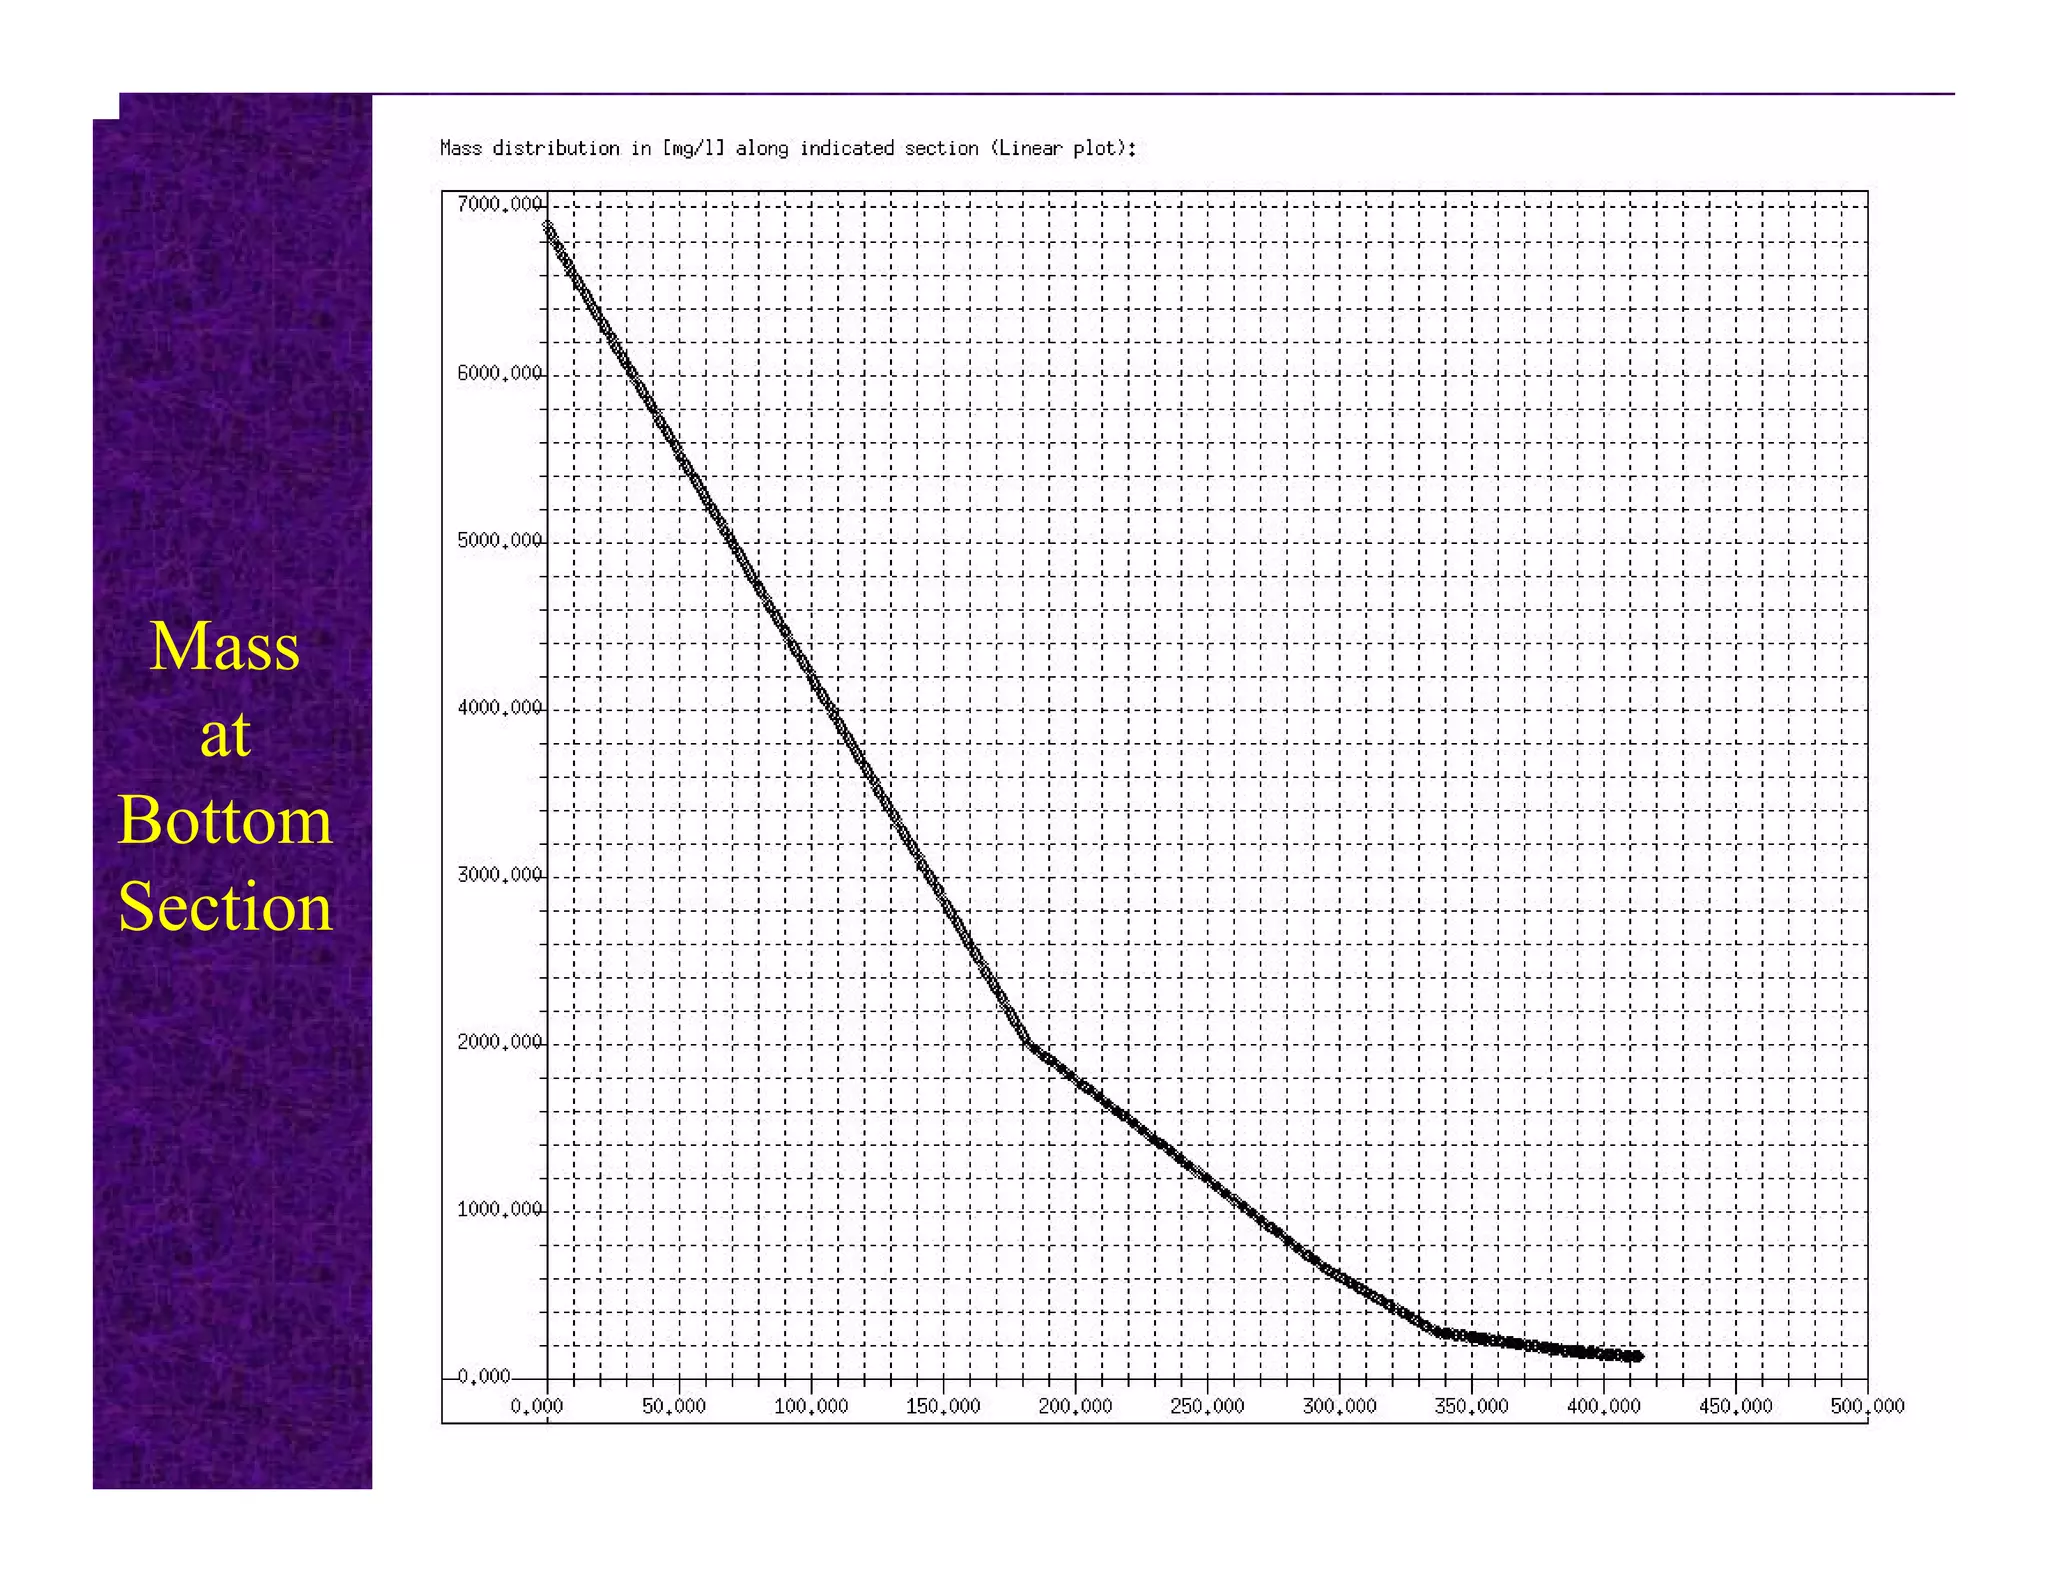
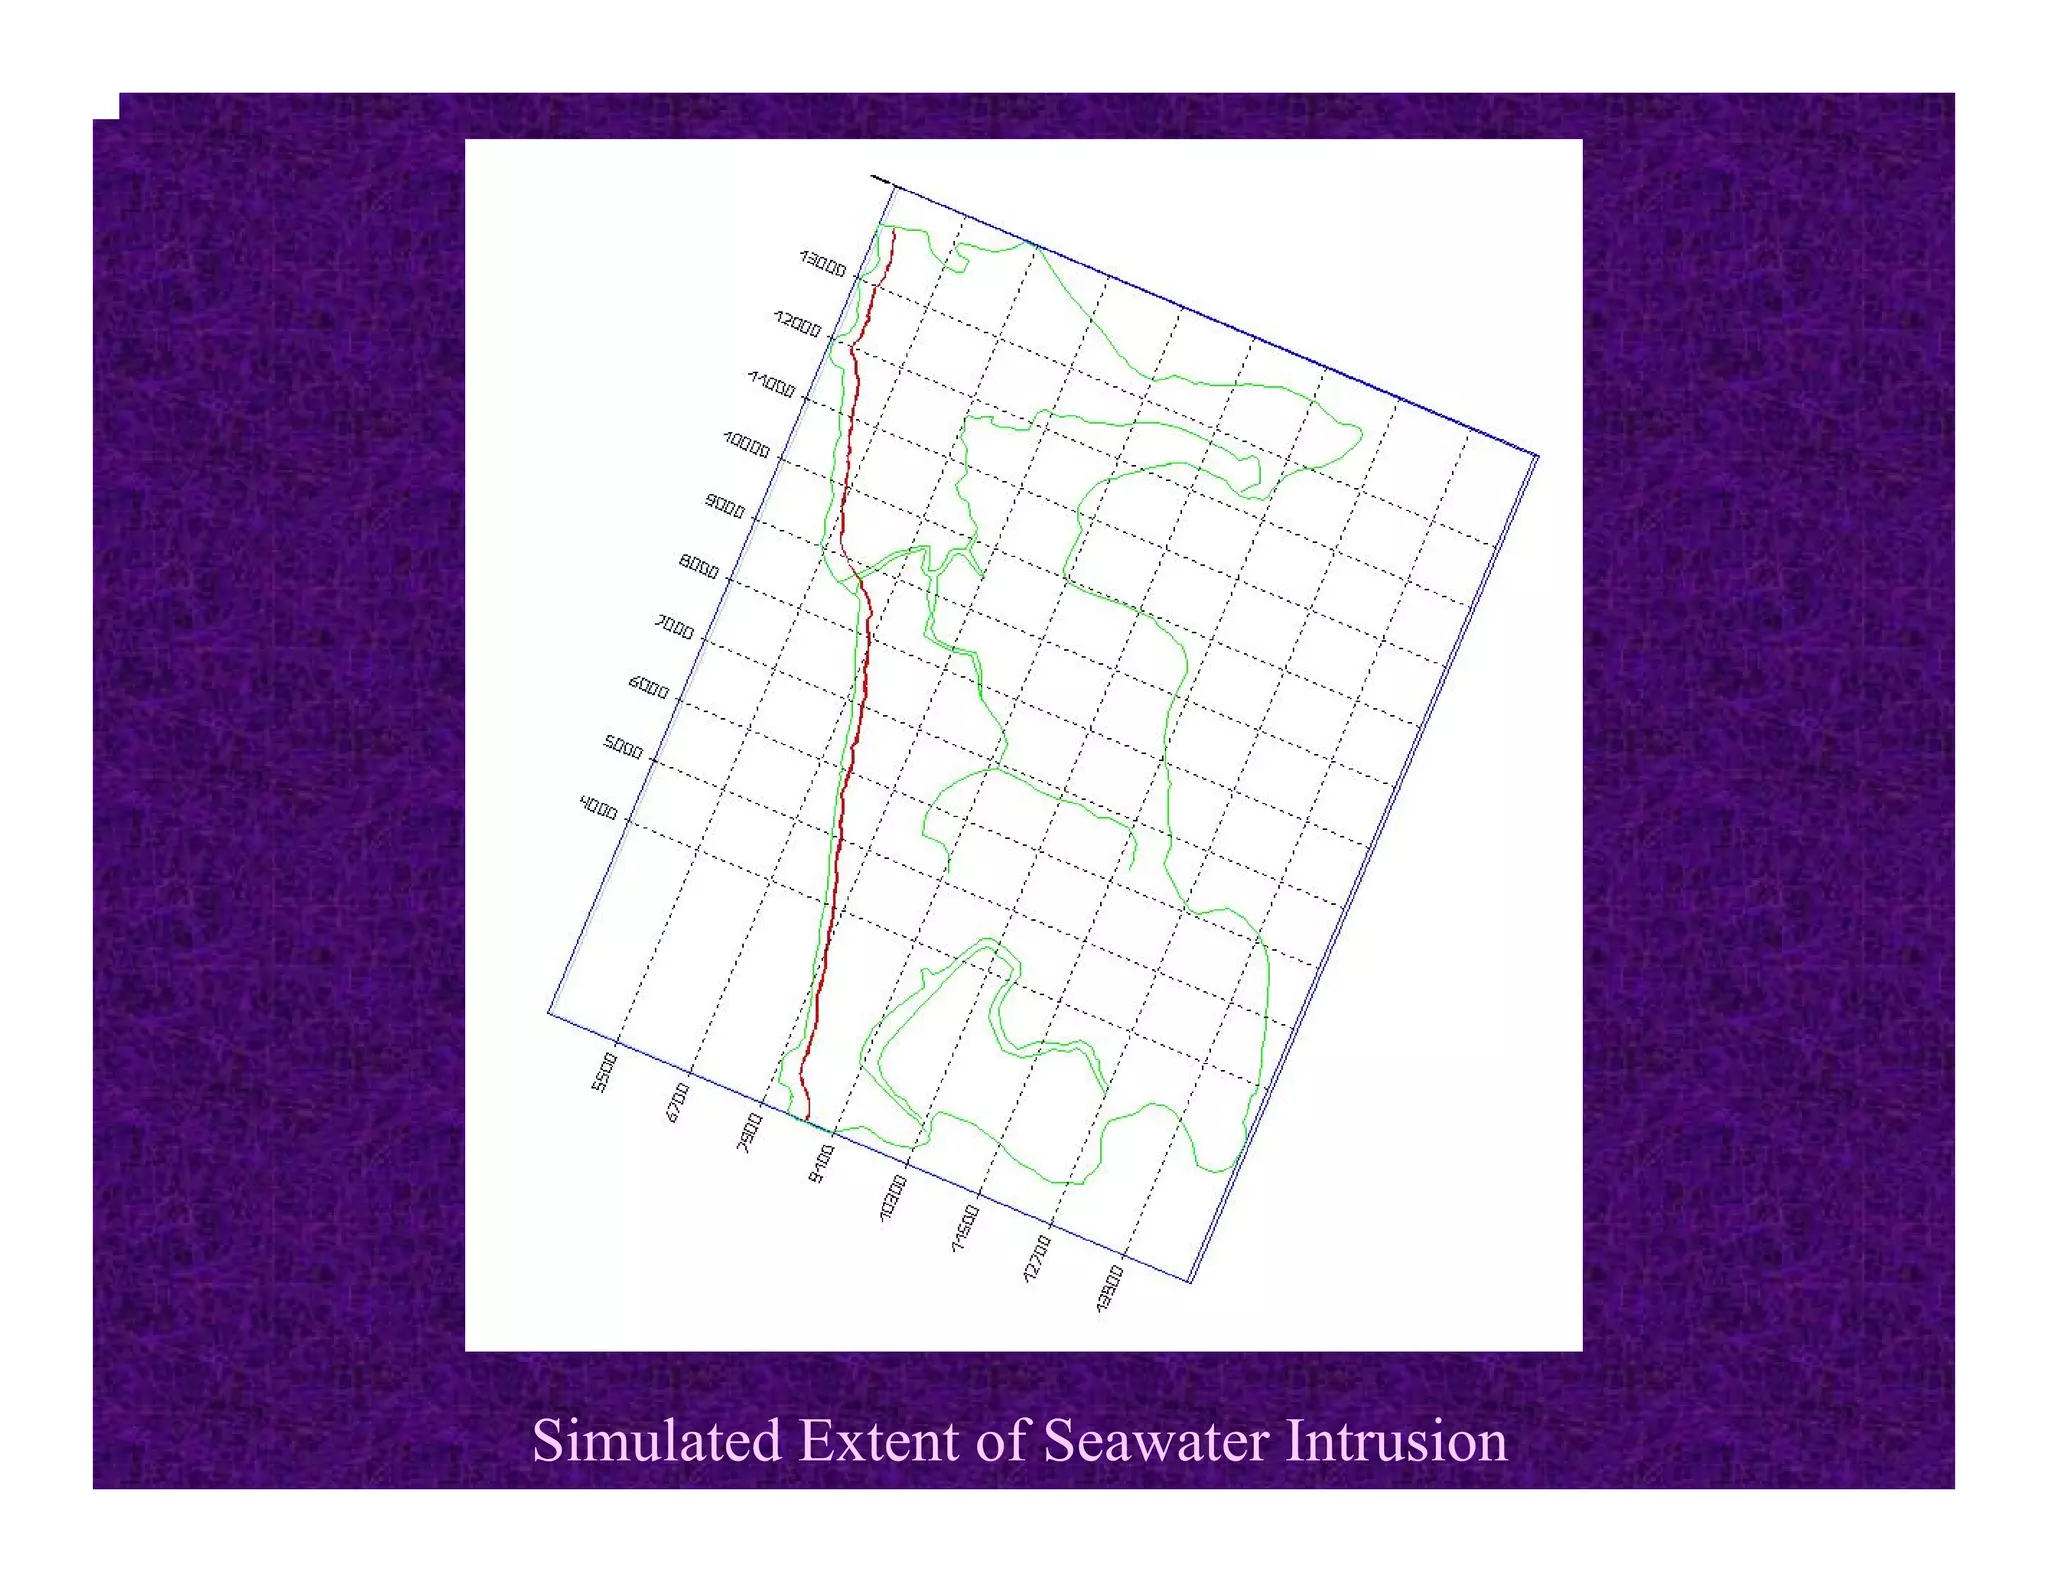
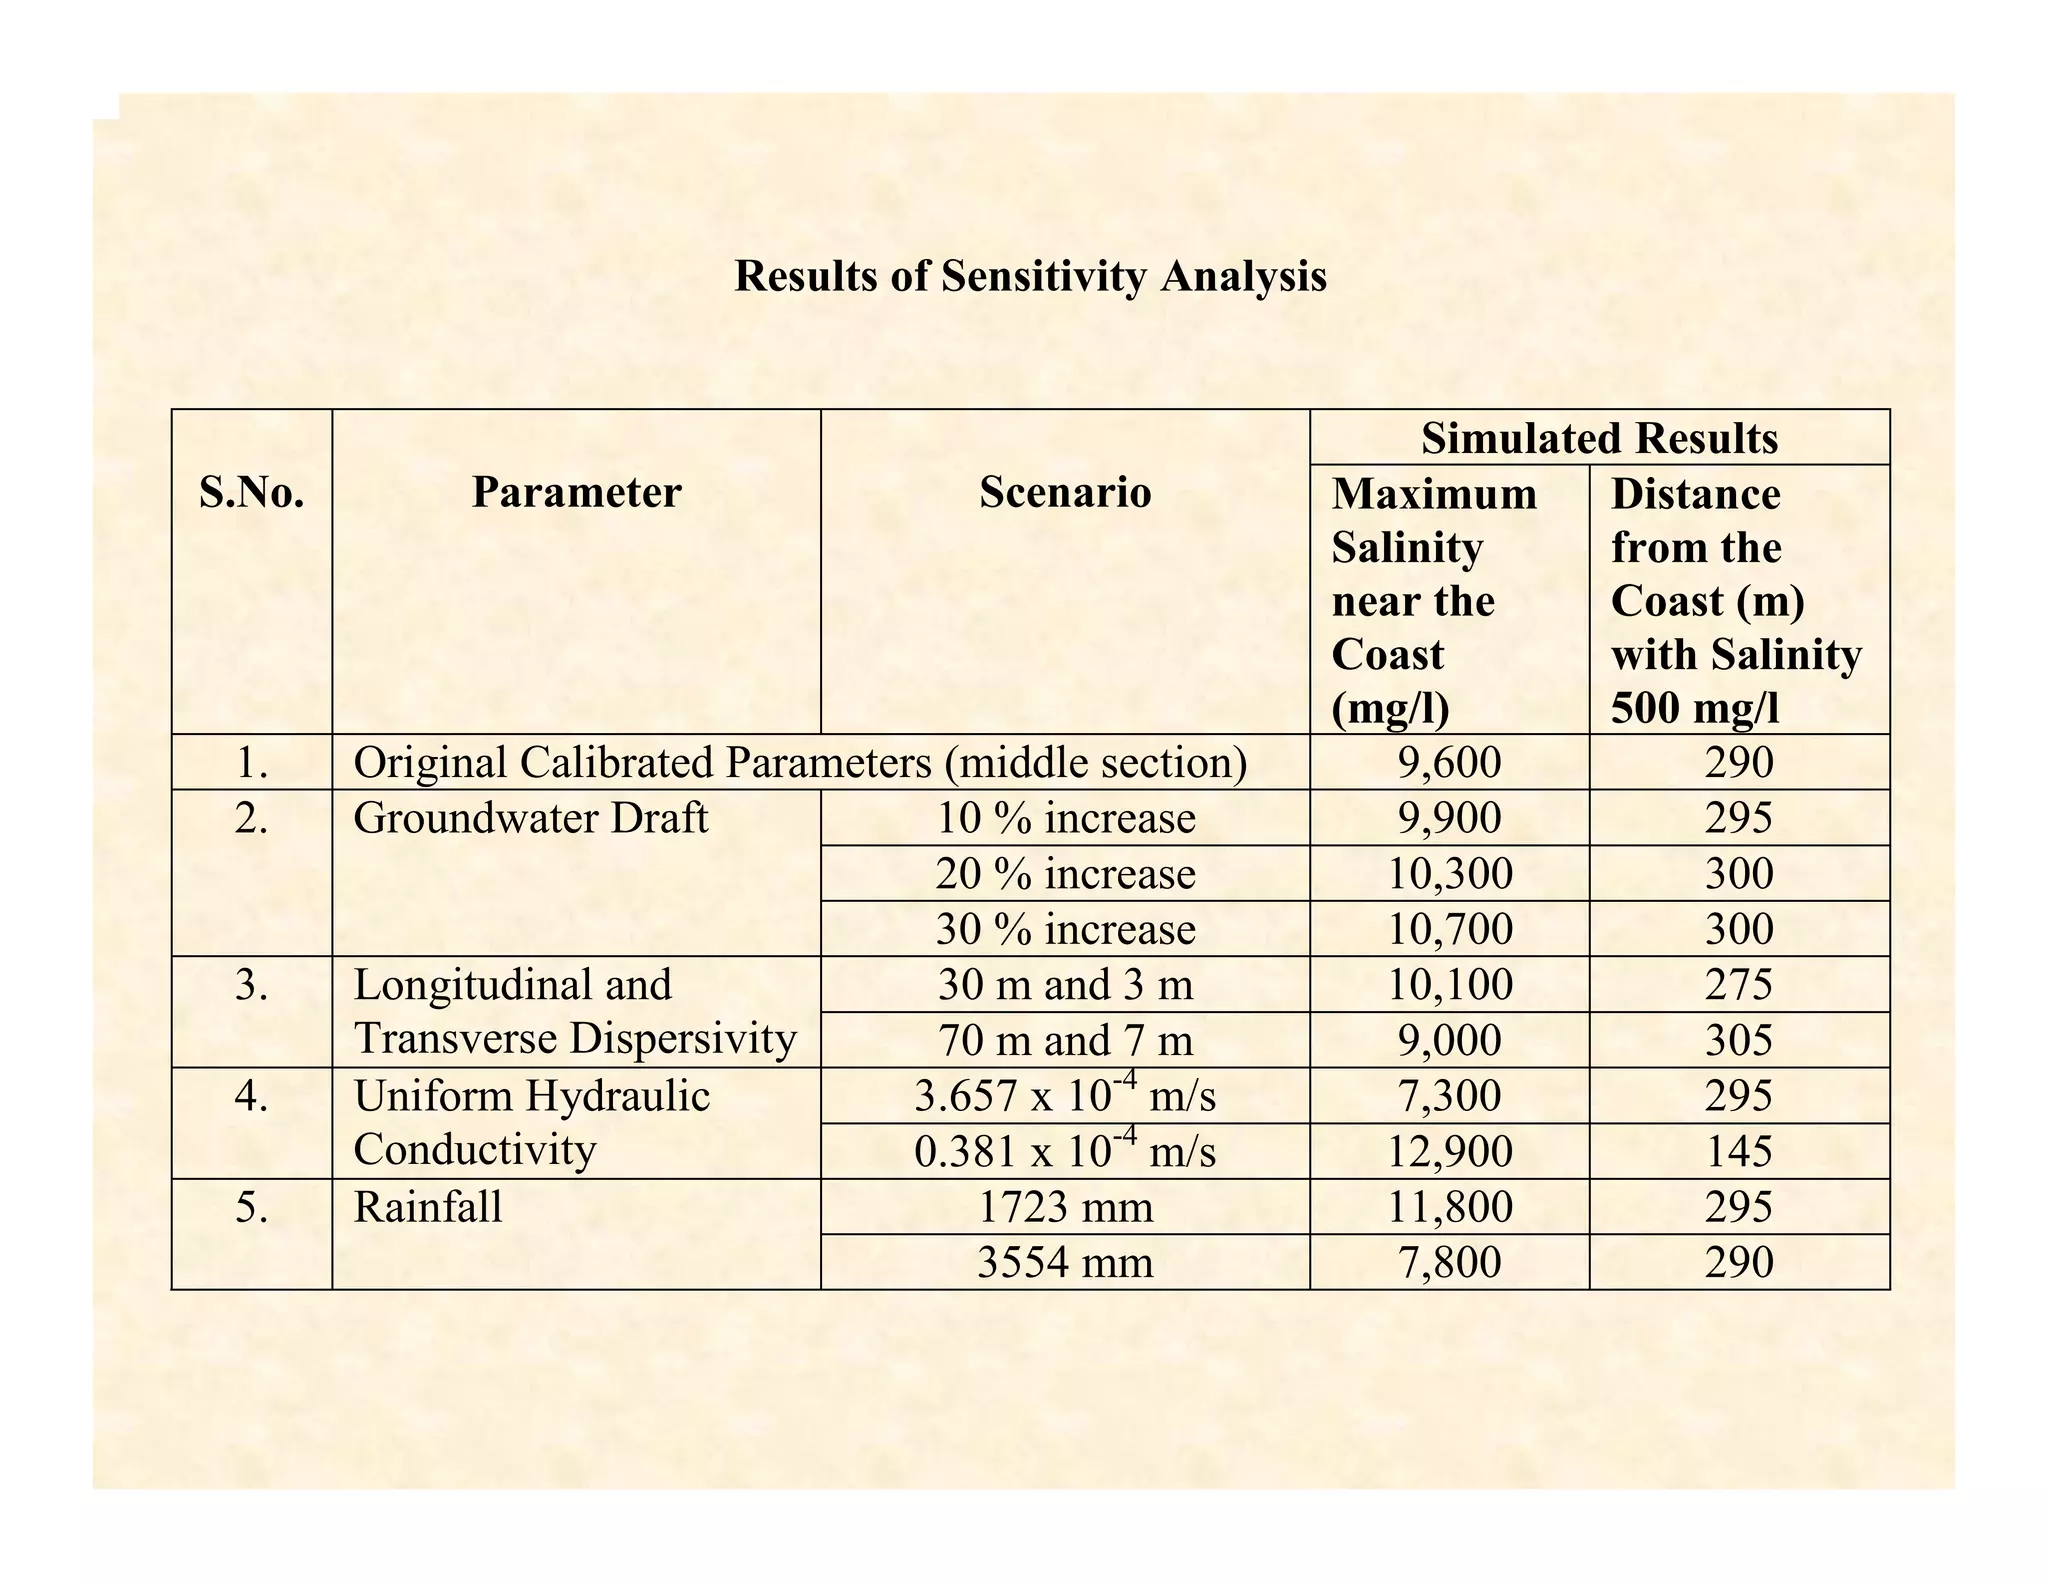


This document summarizes a study on modelling coastal aquifer seawater intrusion using FEFLOW software. The study area is along the coast of North Goa, India where increasing groundwater extraction is causing intrusion. The objectives are to simulate intrusion under pumping scenarios, identify sensitive parameters, and suggest remedial measures. Field investigations were conducted to collect data on groundwater levels, quality and resistivity. A 3D finite element model was set up and calibrated. Results show intrusion currently extends 290m inland but could advance farther with lower rainfall or increased pumping. Sensitive parameters include hydraulic conductivity, dispersivity and rainfall. Continuous monitoring and groundwater management are recommended.


