Downloaded 290 times
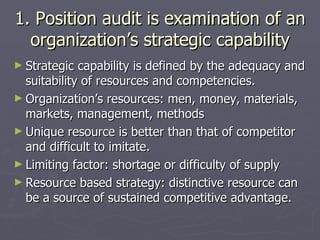

The document discusses strategic capability and managing it. It defines strategic capability as the adequacy and suitability of an organization's resources and competencies. It notes that a unique resource that is better than competitors' and difficult to imitate can provide sustained competitive advantage. The document also discusses value chain, product portfolio management, product life cycles, benchmarking, and performing SWOT analysis to appraise organizational strengths, weaknesses, opportunities, and threats.


