Here are the key steps to construct confidence intervals in R:
1. Generate sample data from a population distribution. For example, to generate a random sample of size 30 from a normal distribution with mean 100 and standard deviation 15:
x <- rnorm(30, 100, 15)
2. Calculate the sample mean and standard deviation:
mean(x)
sd(x)
3. Determine the appropriate t-statistic value based on the confidence level and degrees of freedom (n-1). For example, for a 95% CI with 29 df, the t-stat is 2.045:
qt(0.975, 29)
4. Calculate the confidence interval limits as:
Learning Objectives
• Estimatea population mean from a sample mean
when is known.
• Estimate a population mean from a sample mean
when is unknown.
• Estimate a population proportion using the z
statistic.
• Use the chi-square distribution to estimate the
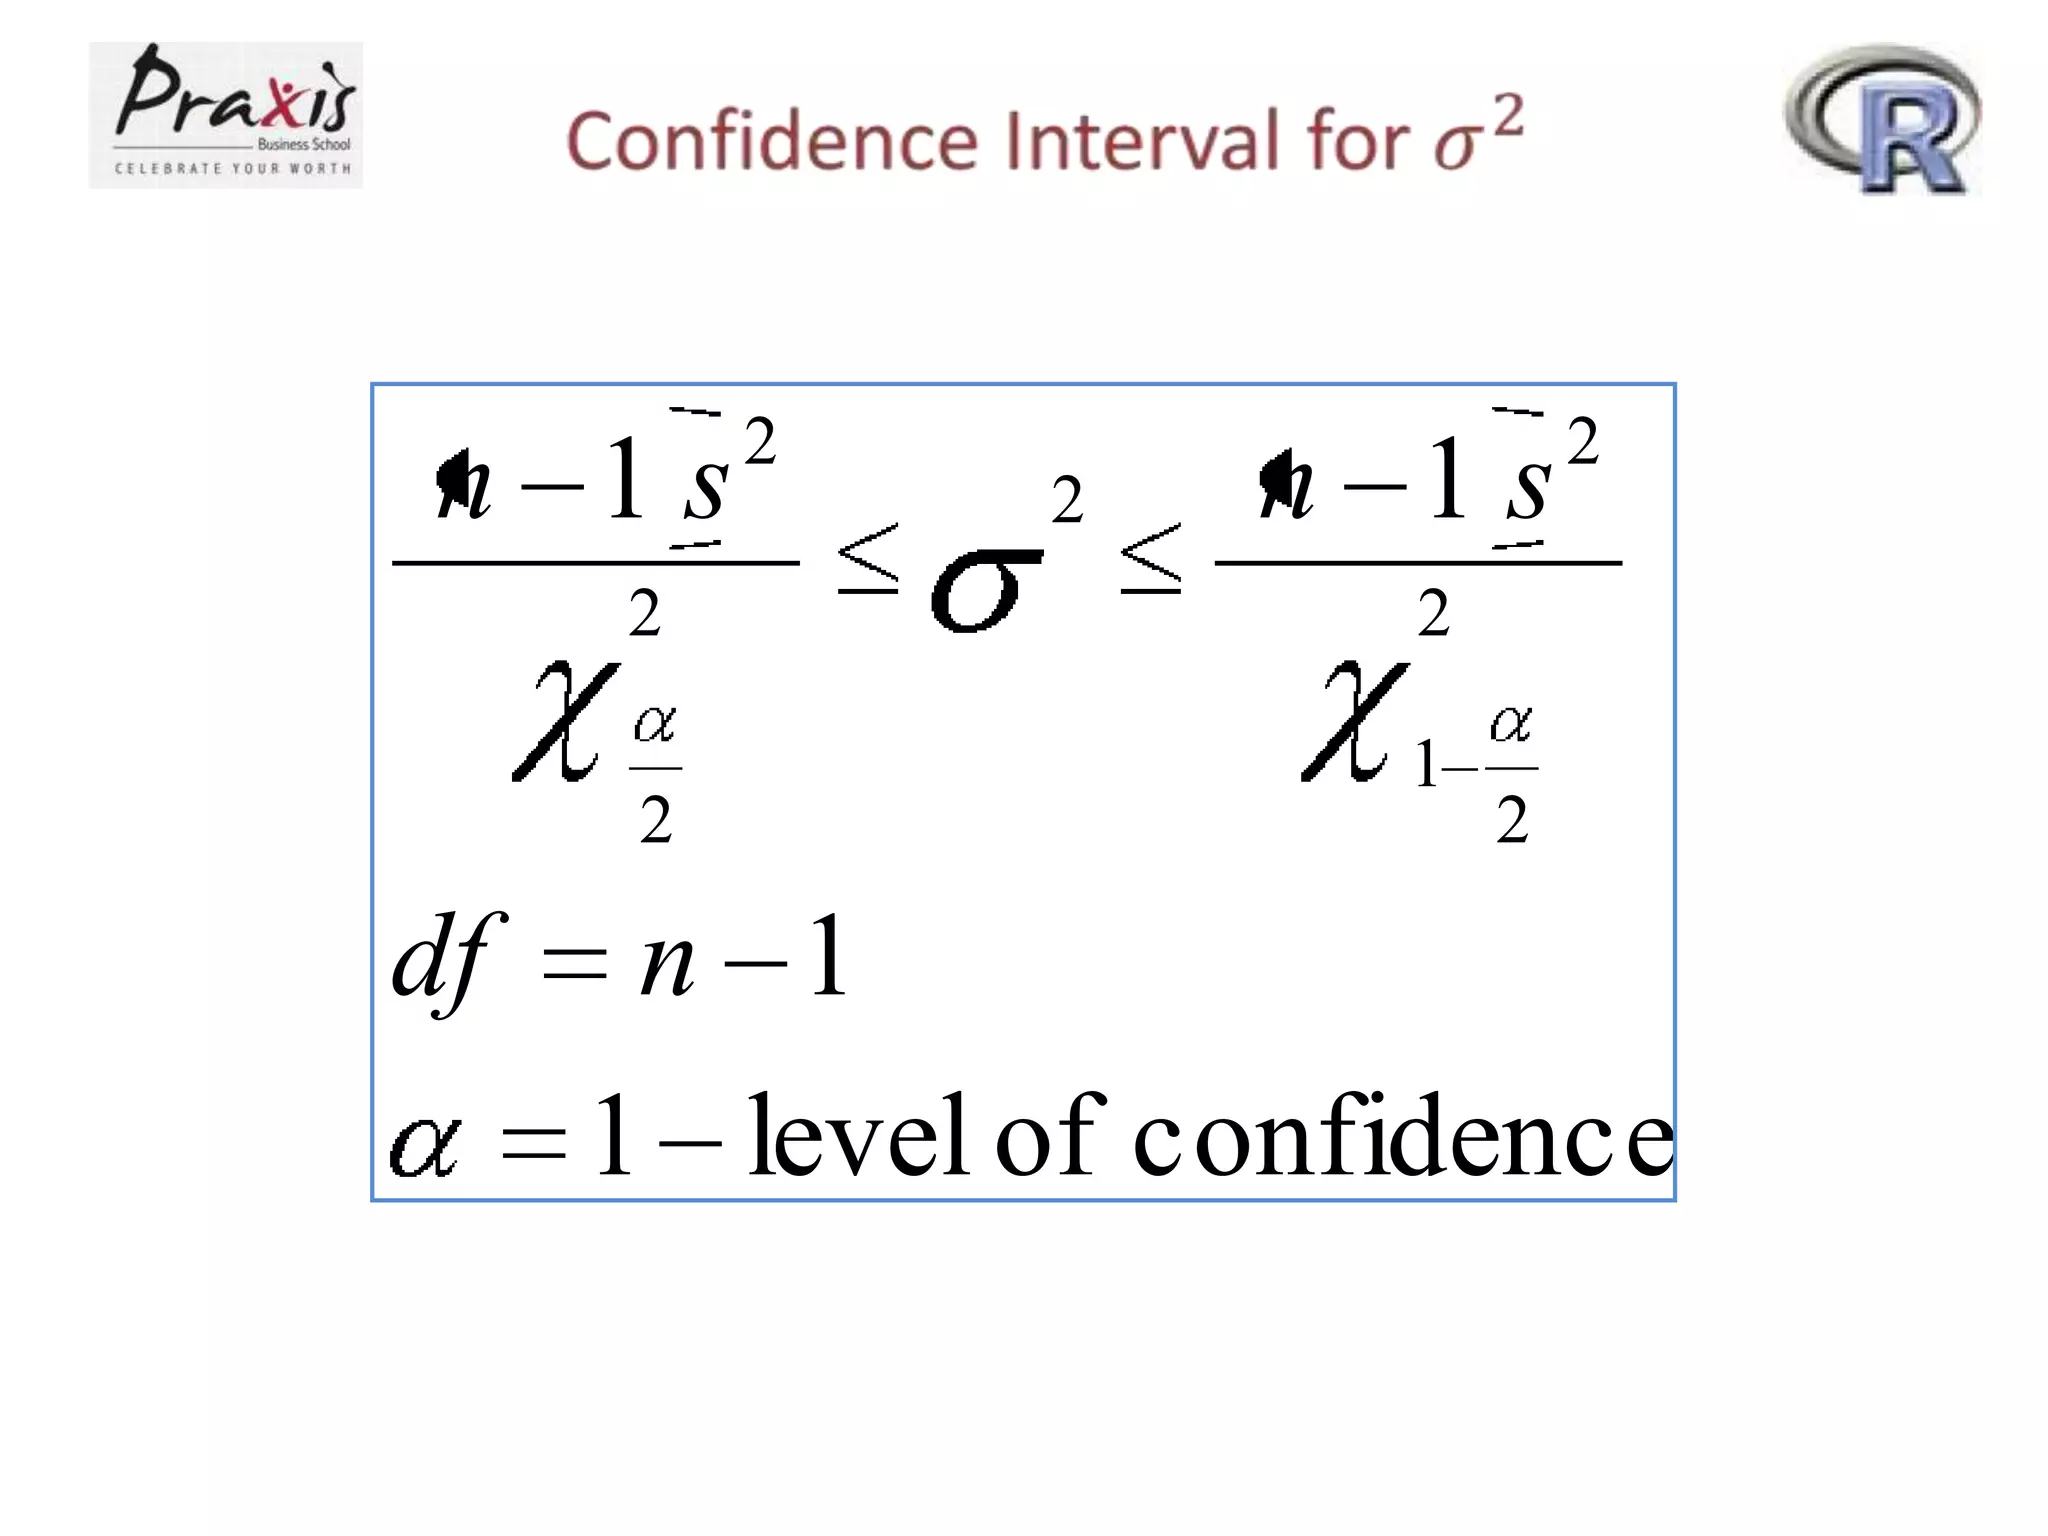
population variance given the sample variance.
• Determine the sample size needed in order to
estimate the population mean and population
proportion.
2.
Estimating the PopulationParameter
• A point estimate is a statistic calculated from
a sample that is used to estimate a population
parameter.
• Interval estimate - a range of values within
which the analyst can declare, with some
confidence, the population parameter lies.
3.
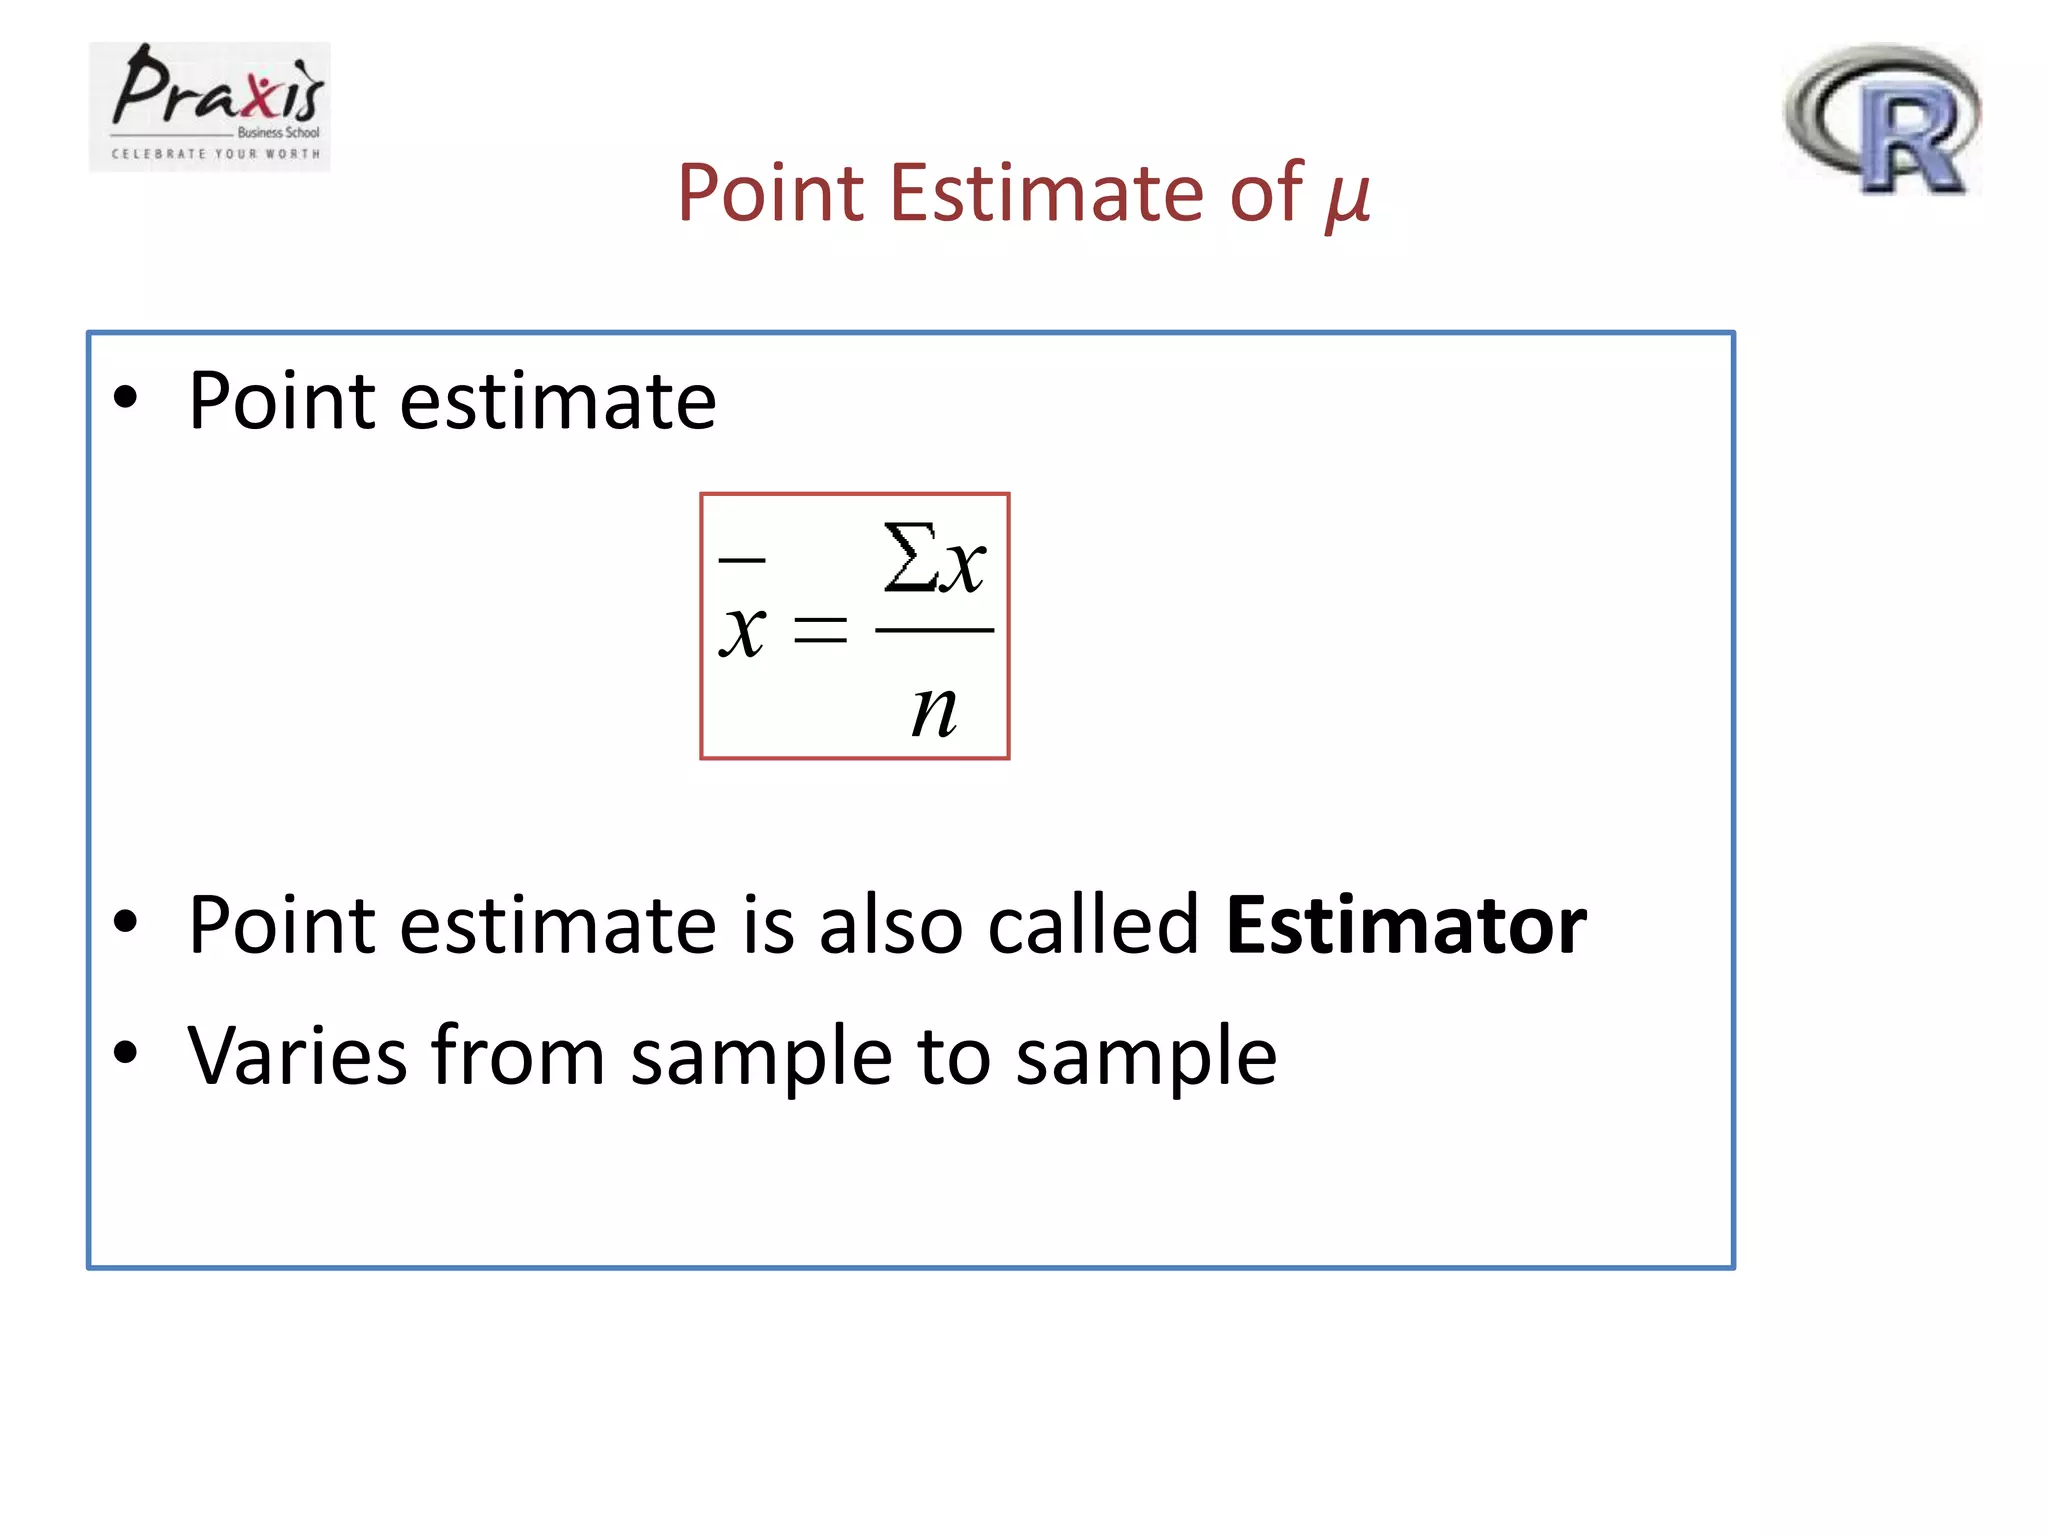
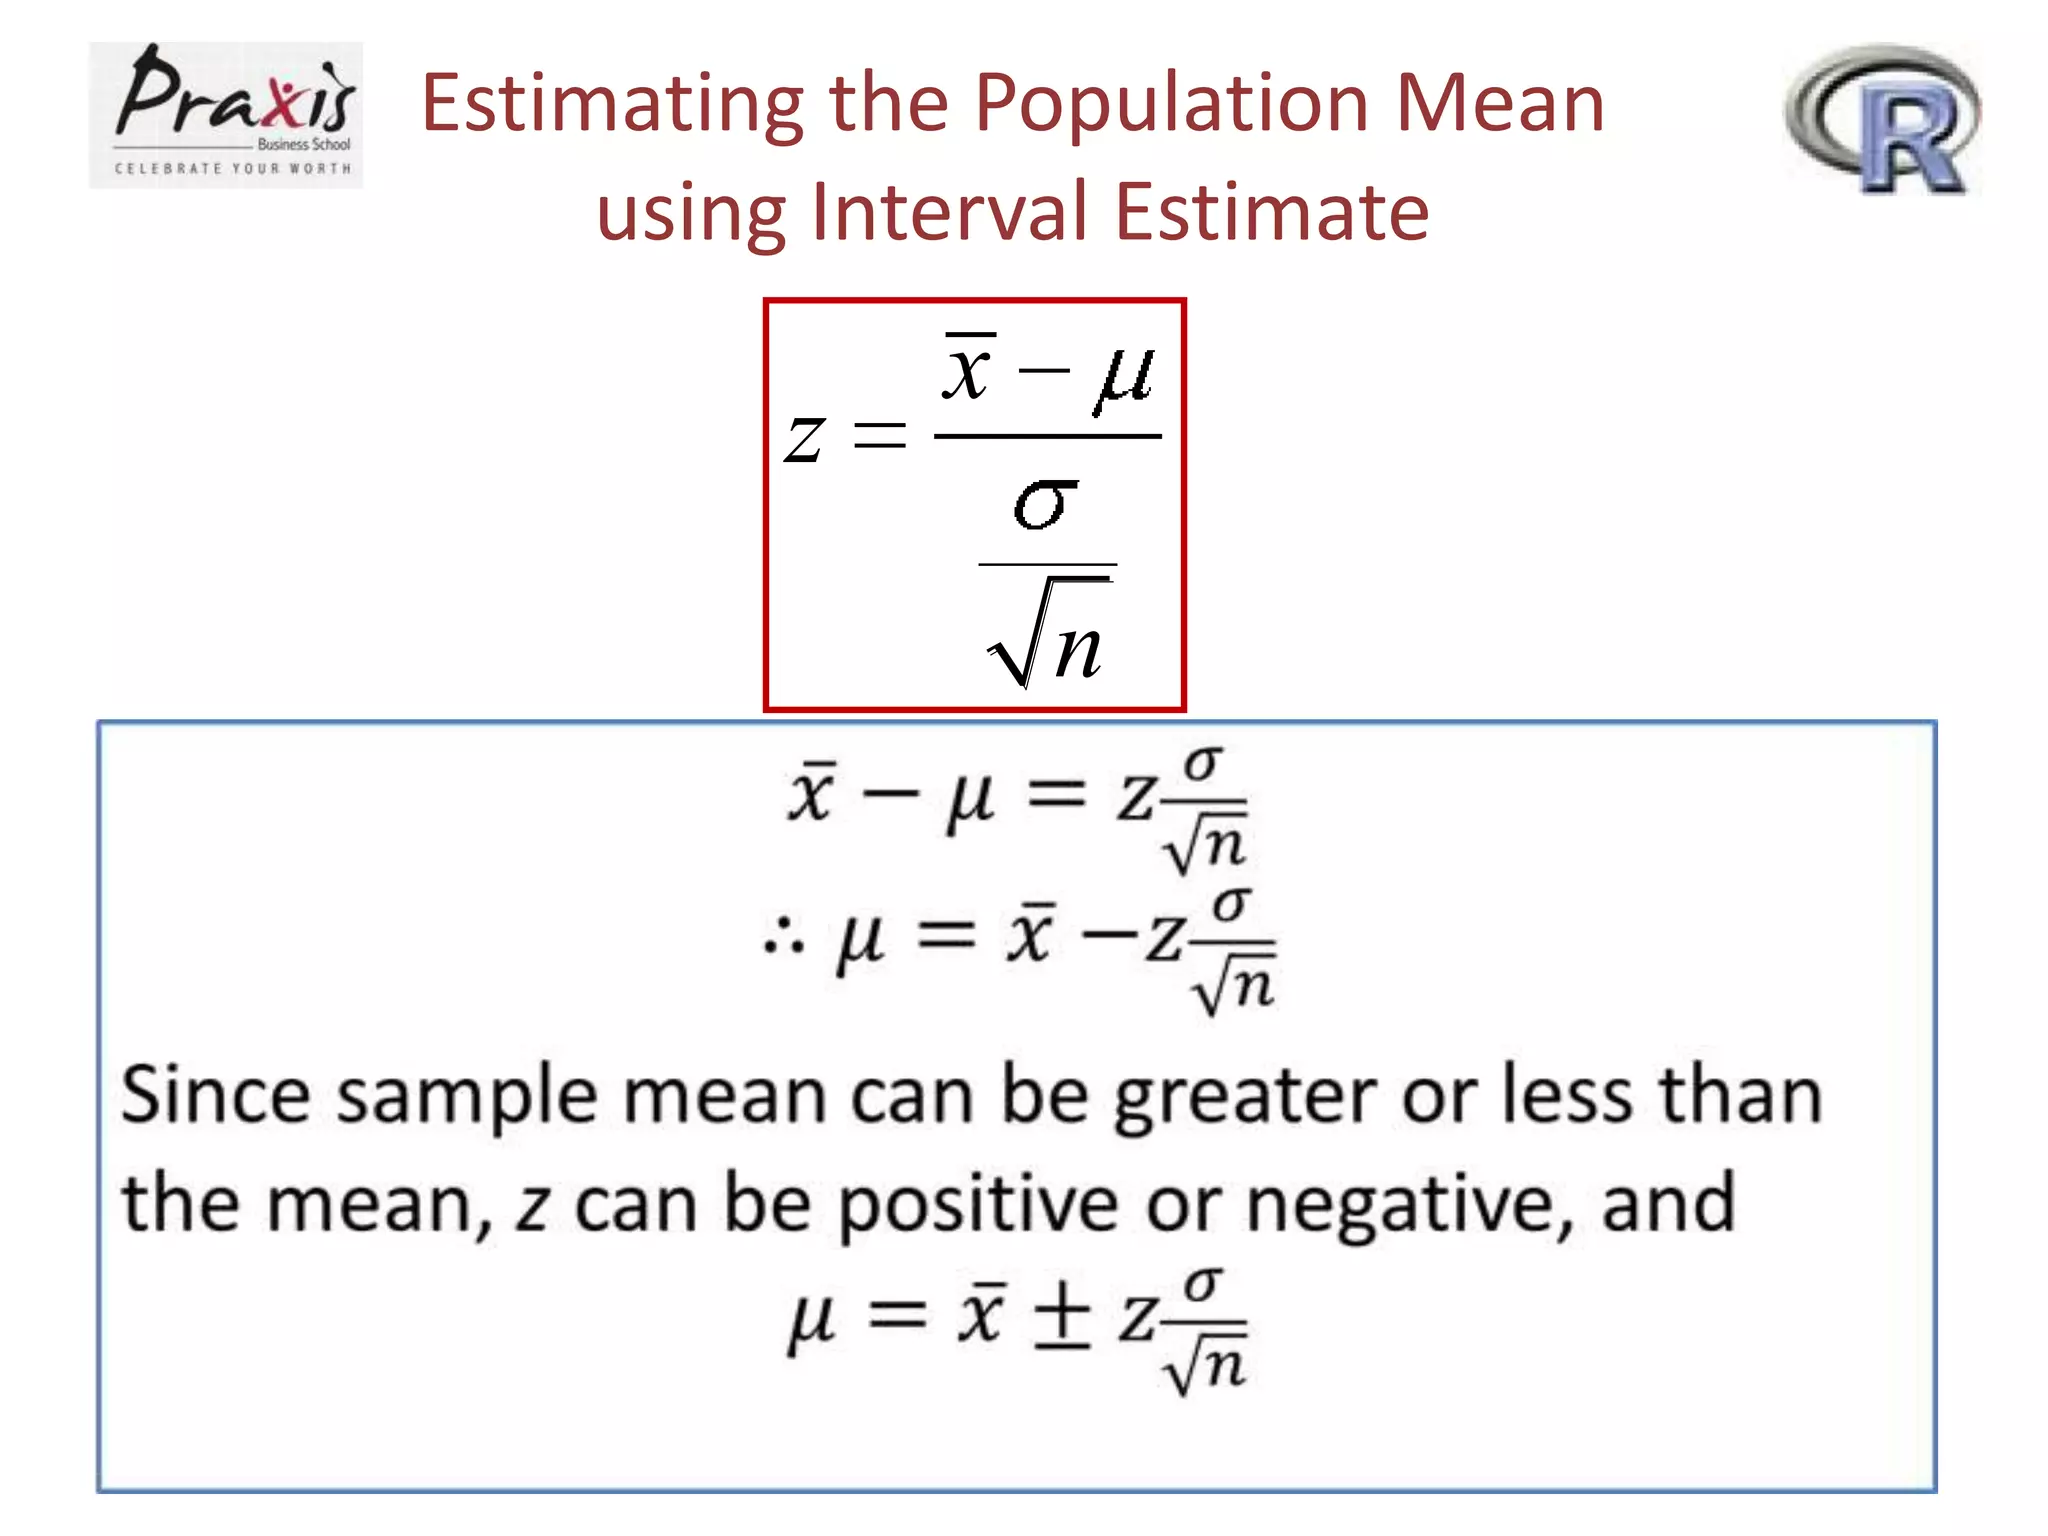
Point Estimate ofμ
• Point estimate
x
x
n
• Point estimate is also called Estimator
• Varies from sample to sample
4.
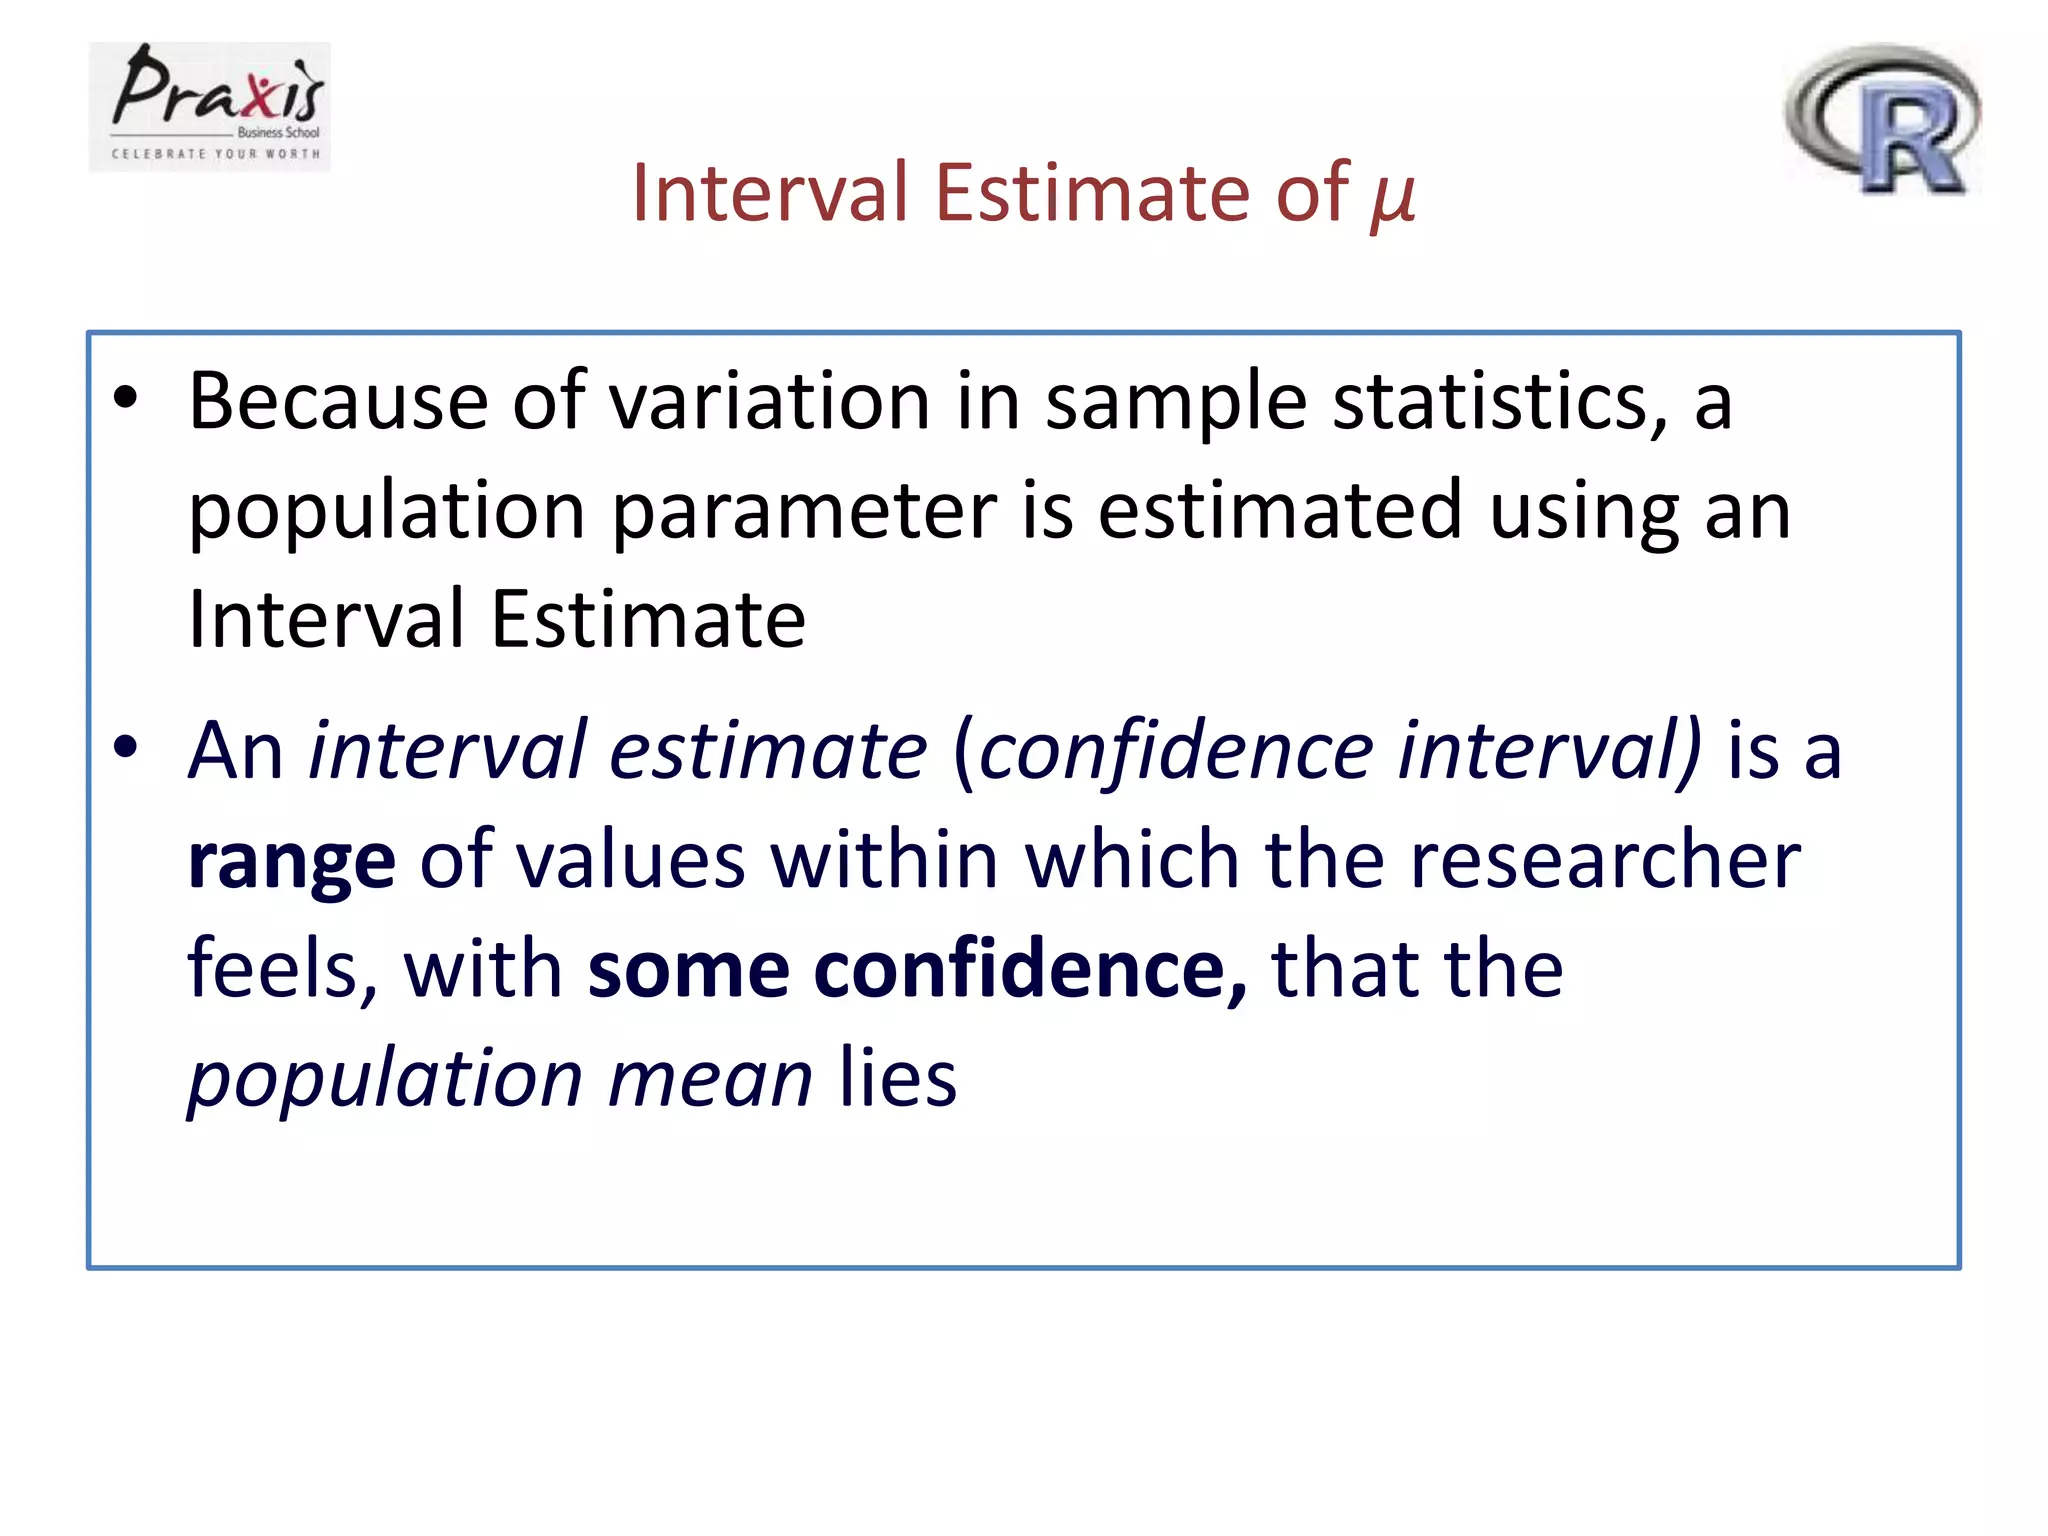
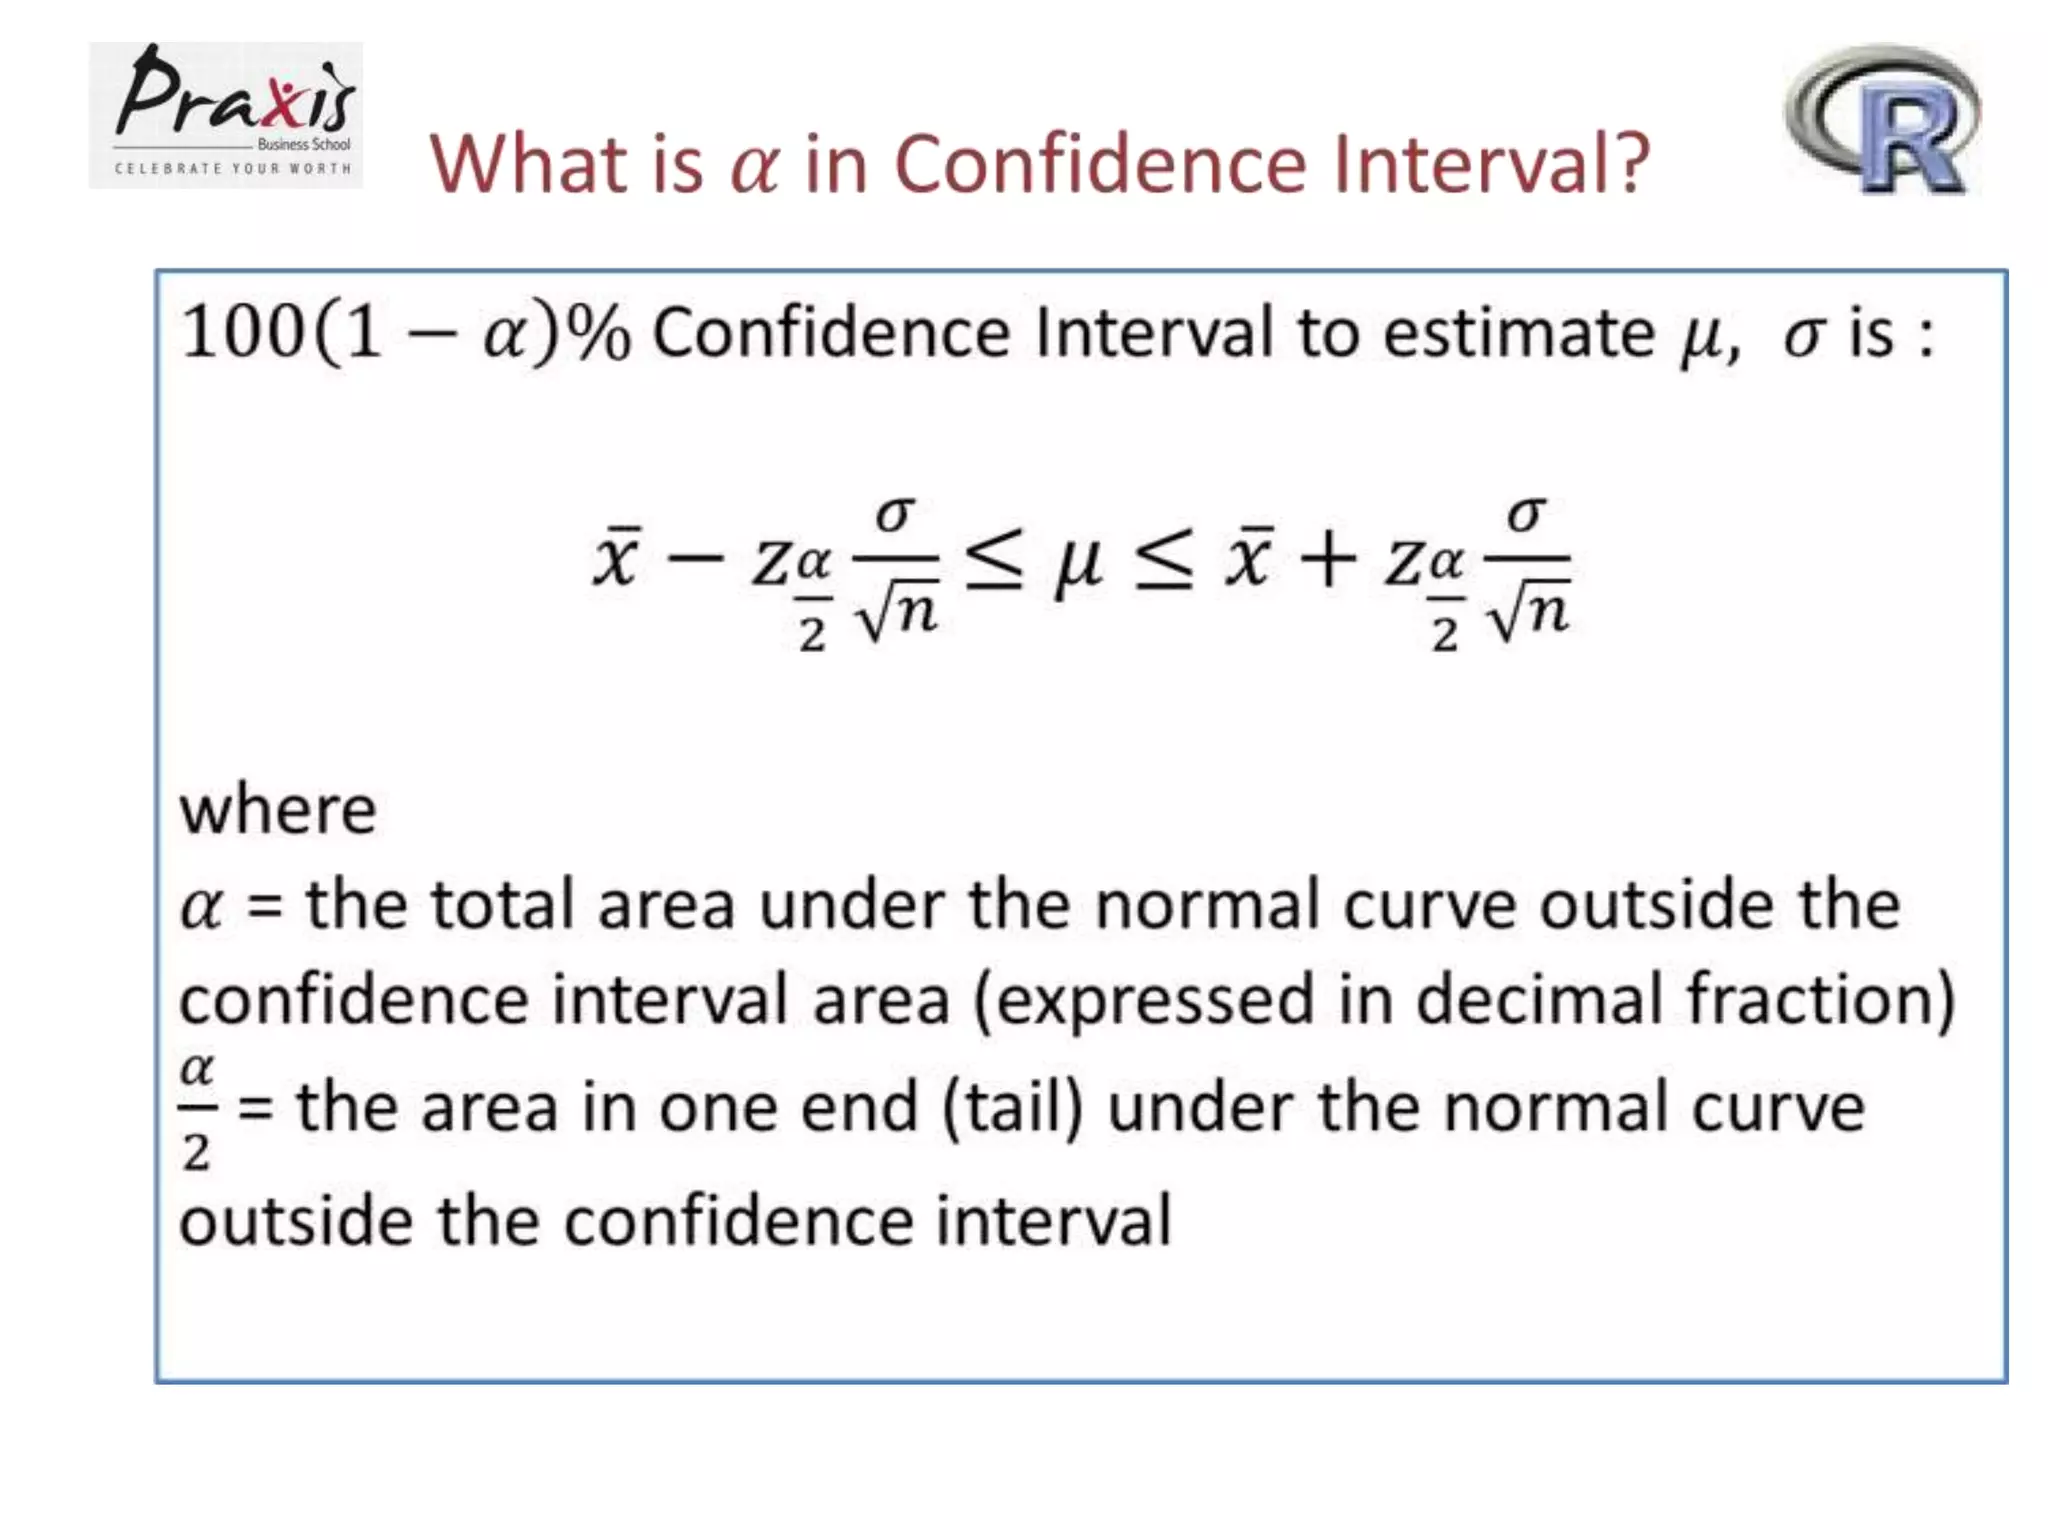
Interval Estimate ofμ
• Because of variation in sample statistics, a
population parameter is estimated using an
Interval Estimate
• An interval estimate (confidence interval) is a
range of values within which the researcher
feels, with some confidence, that the
population mean lies
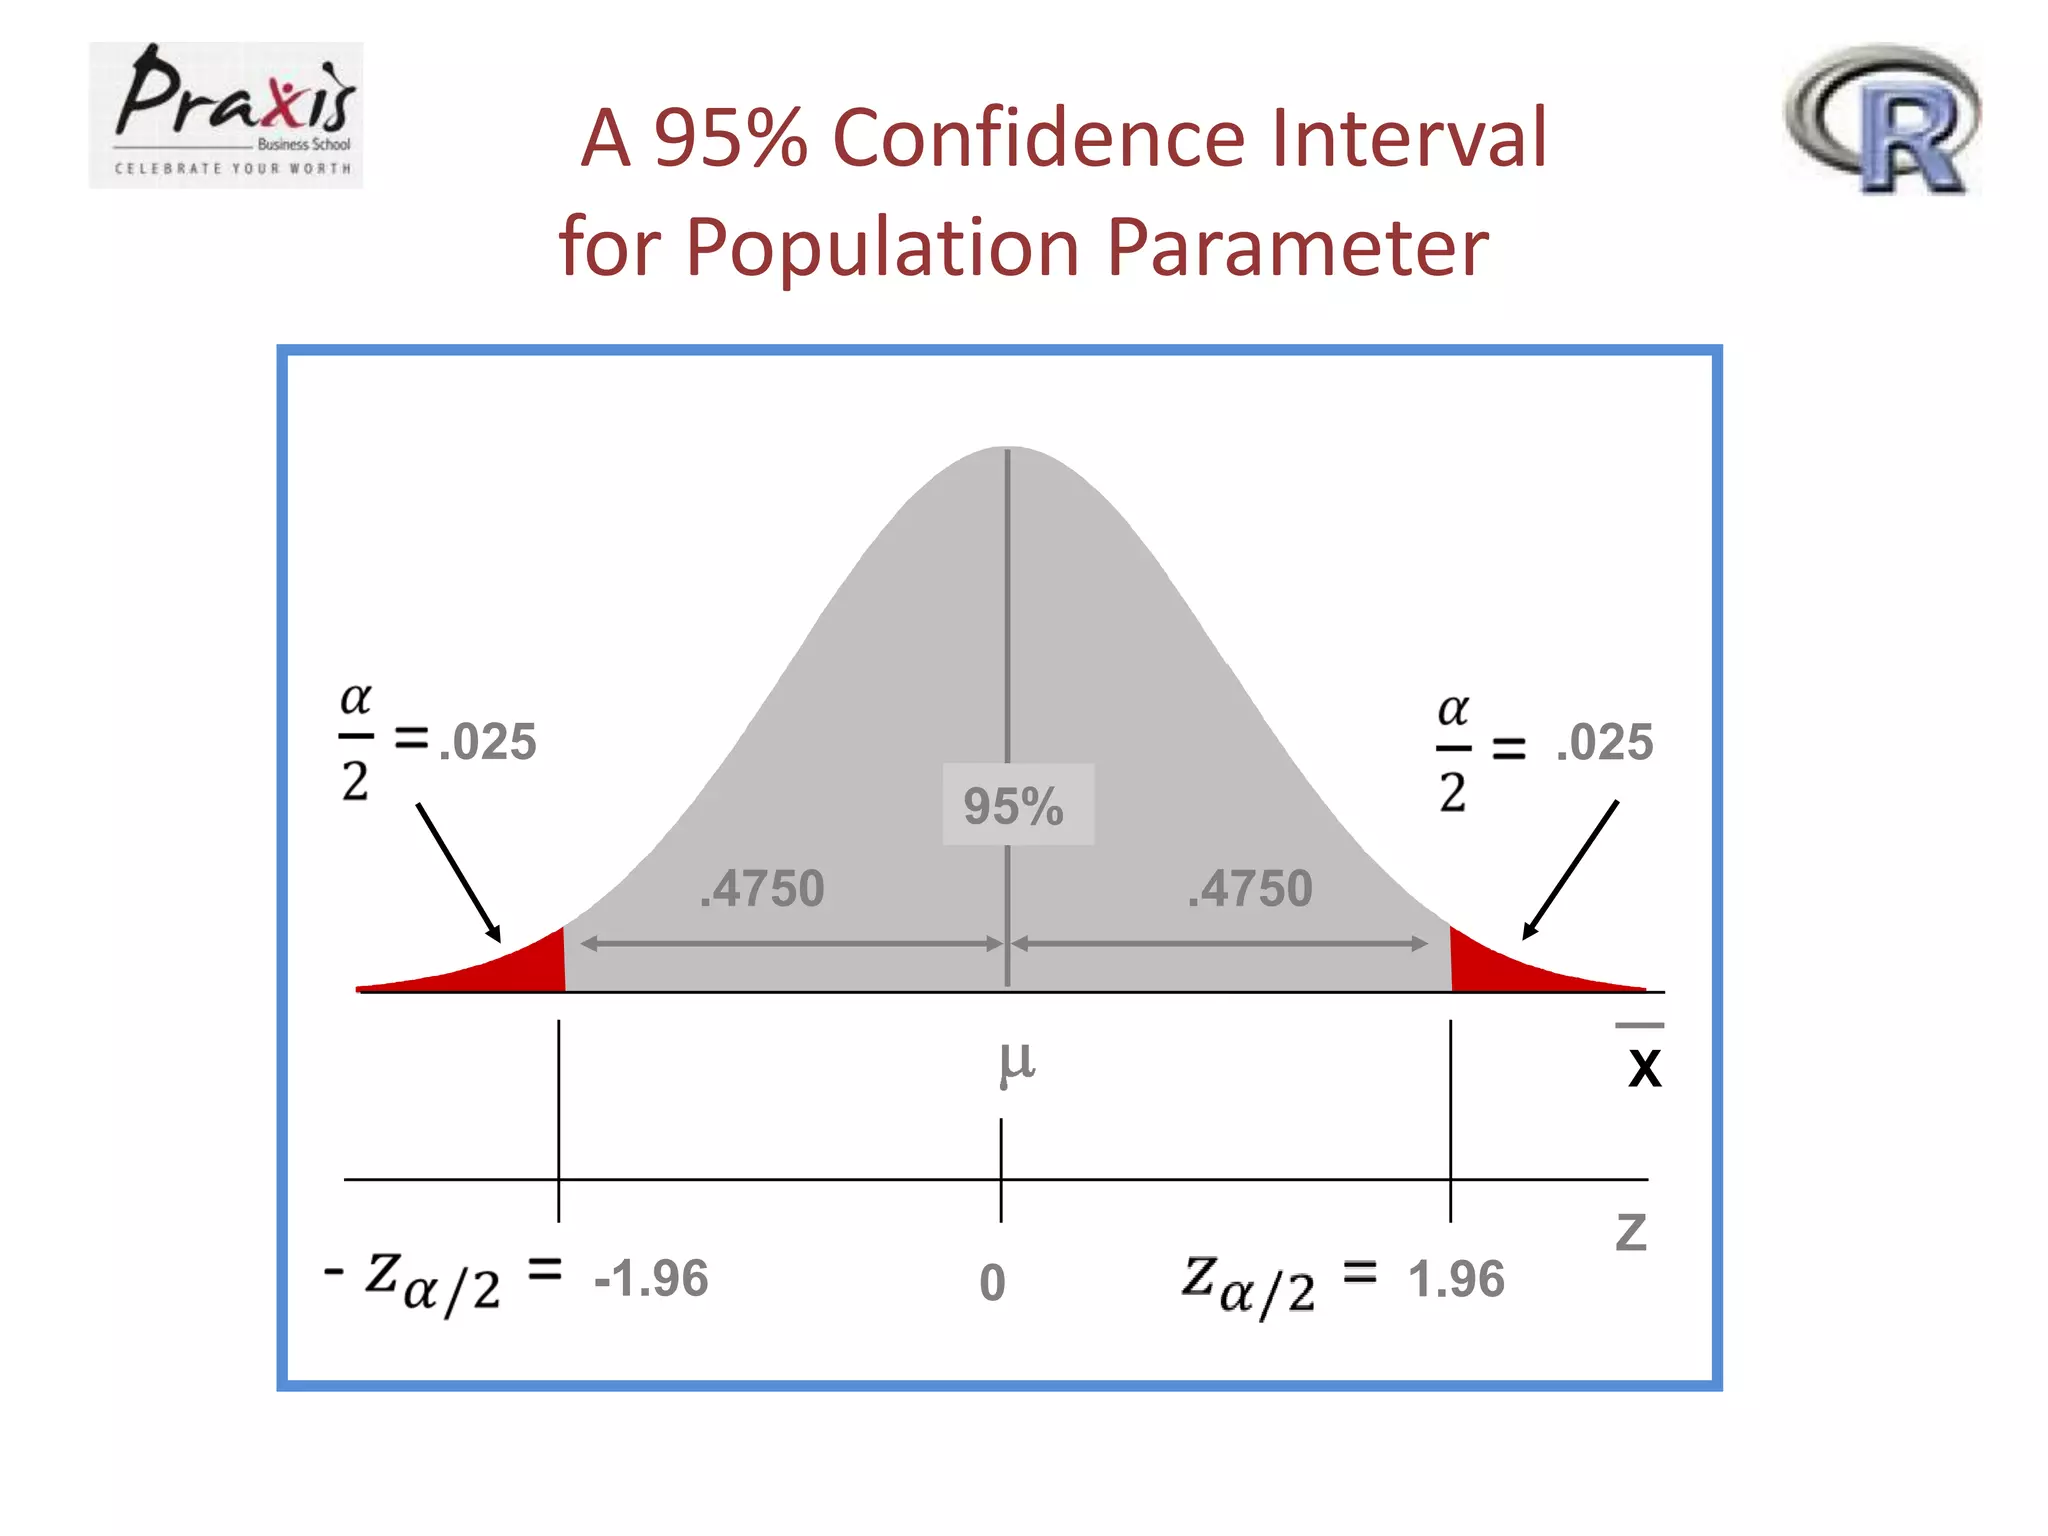
A 95% ConfidenceInterval
for Population Parameter
.025
.025
95%
.4750
.4750
X
-1.96
0
1.96
Z
9.
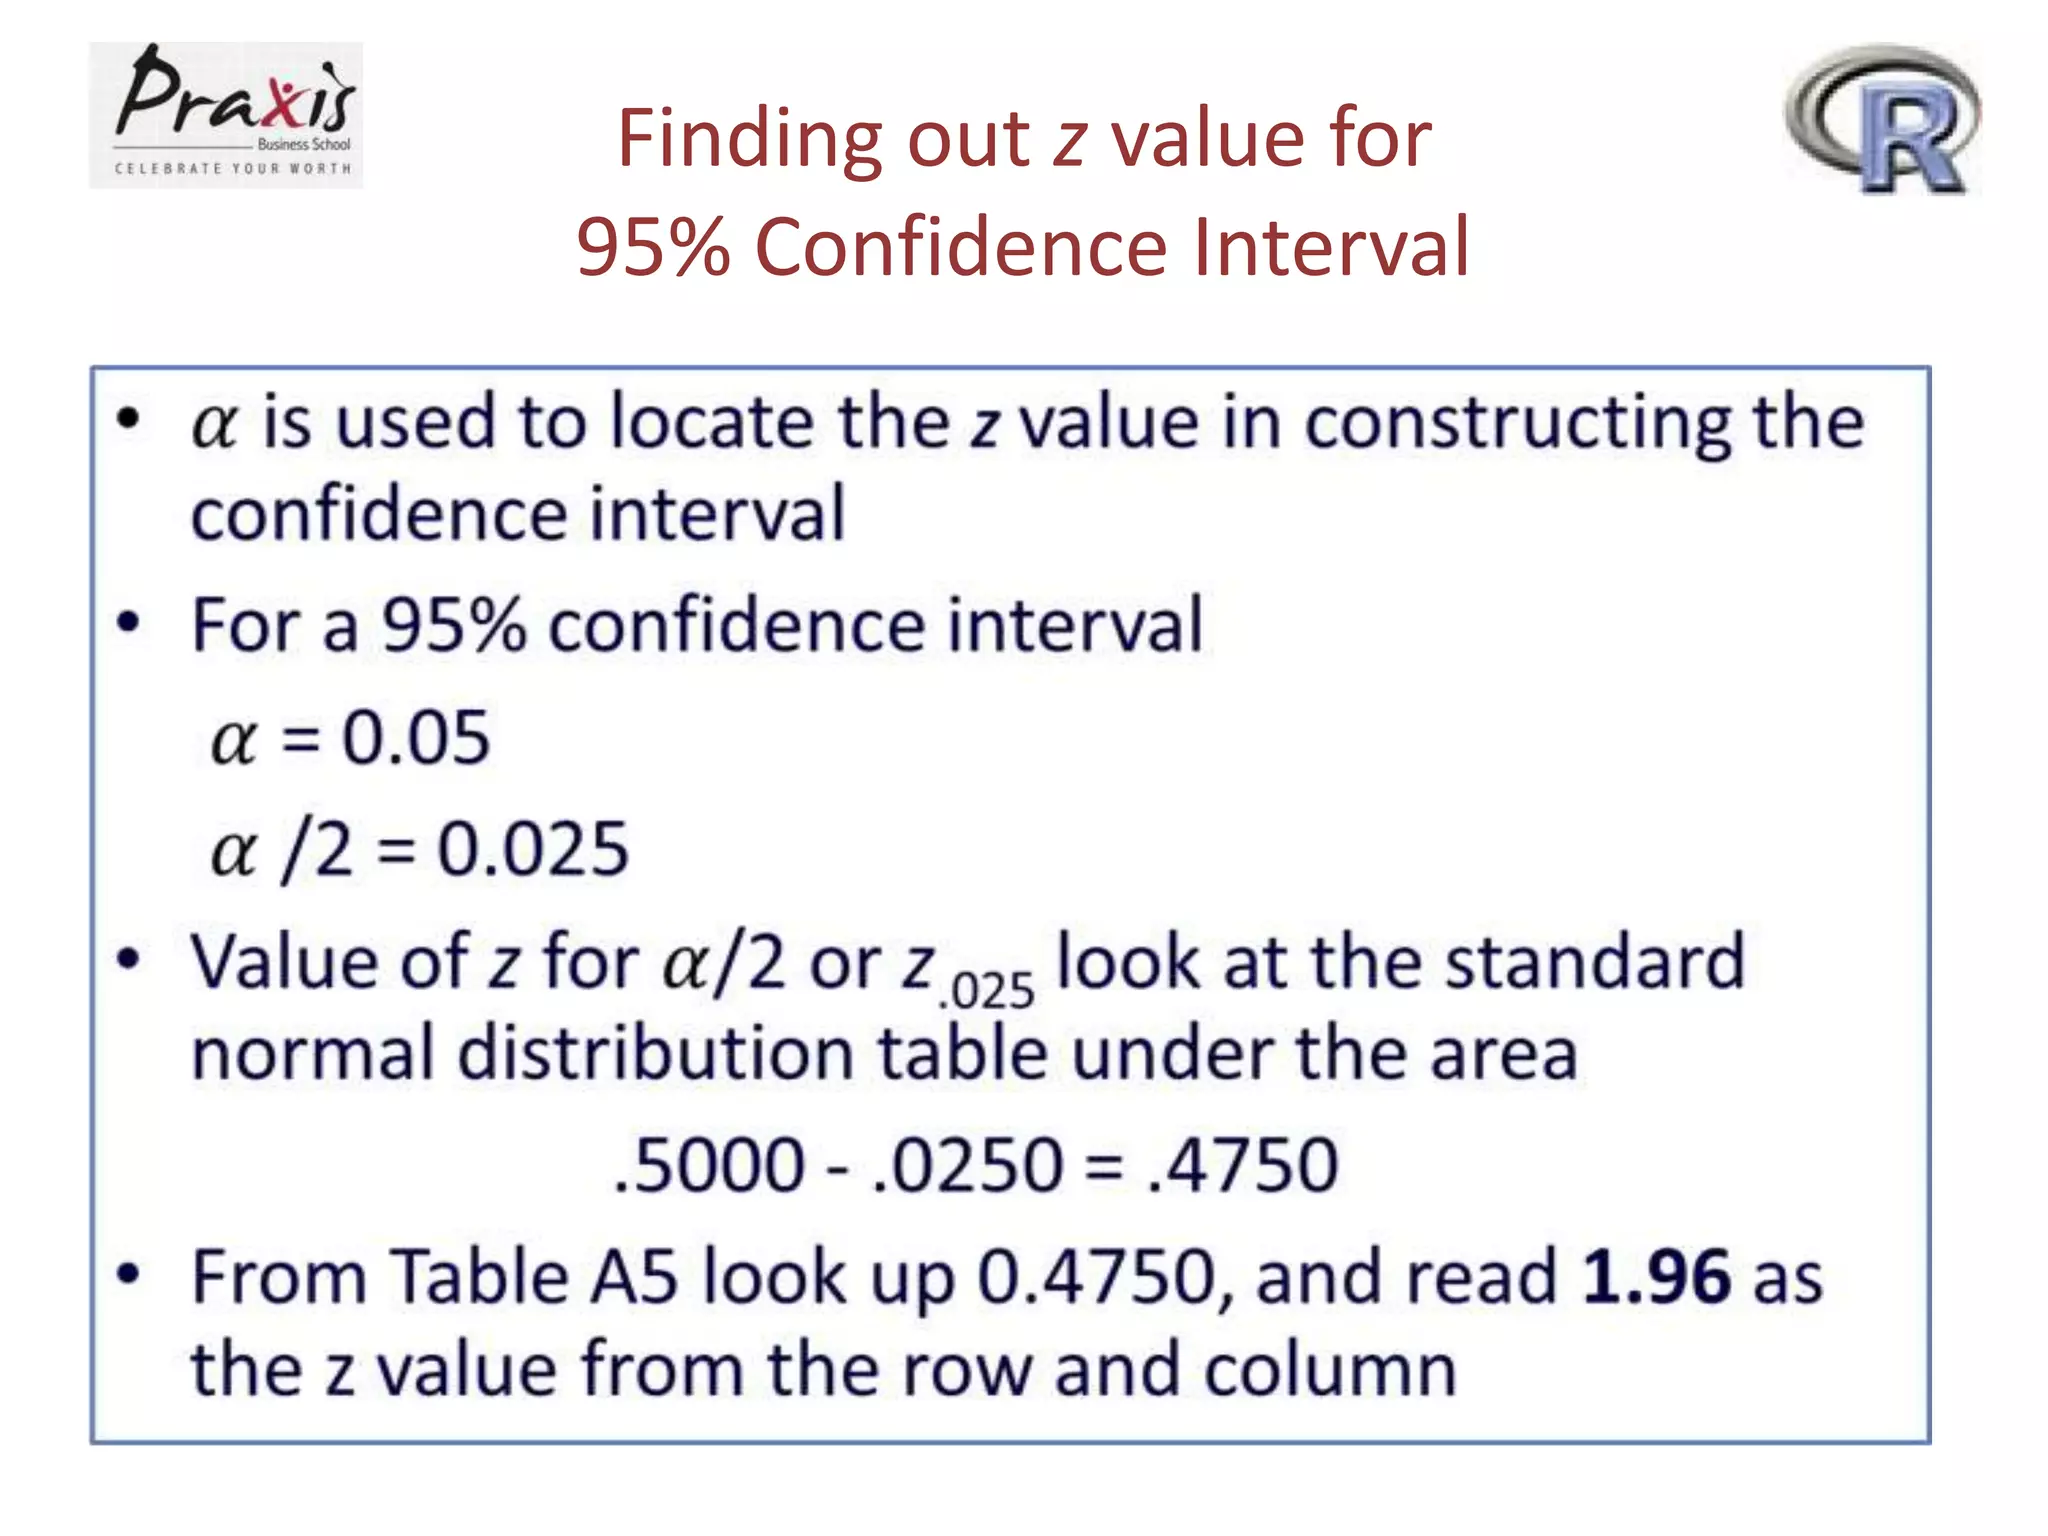
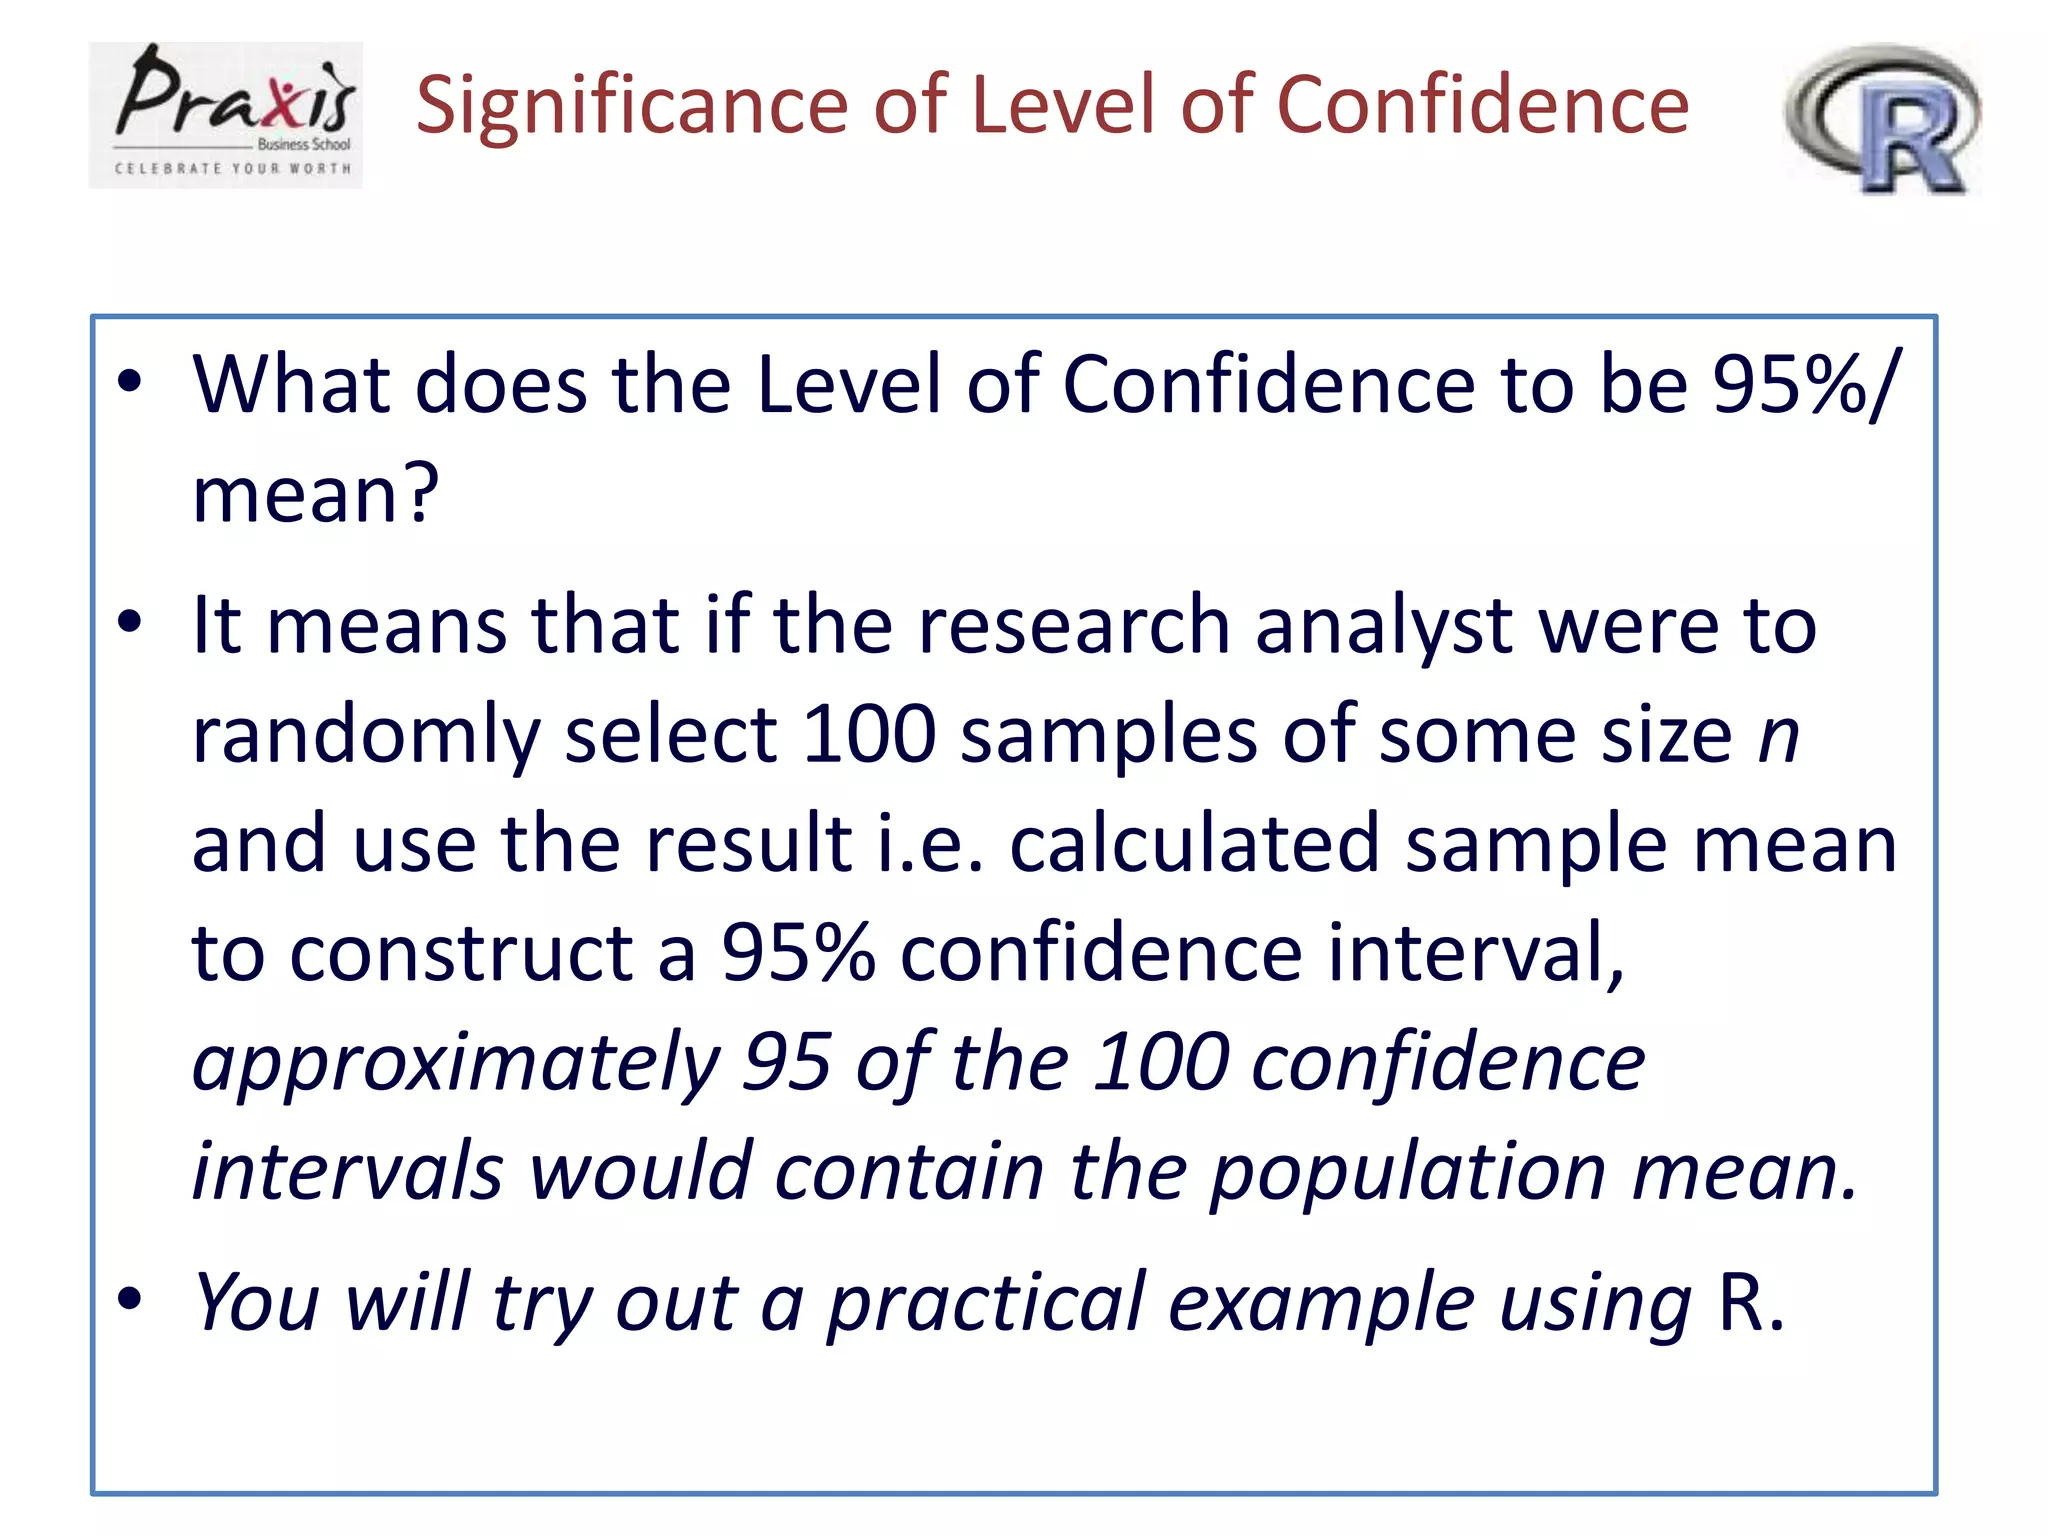
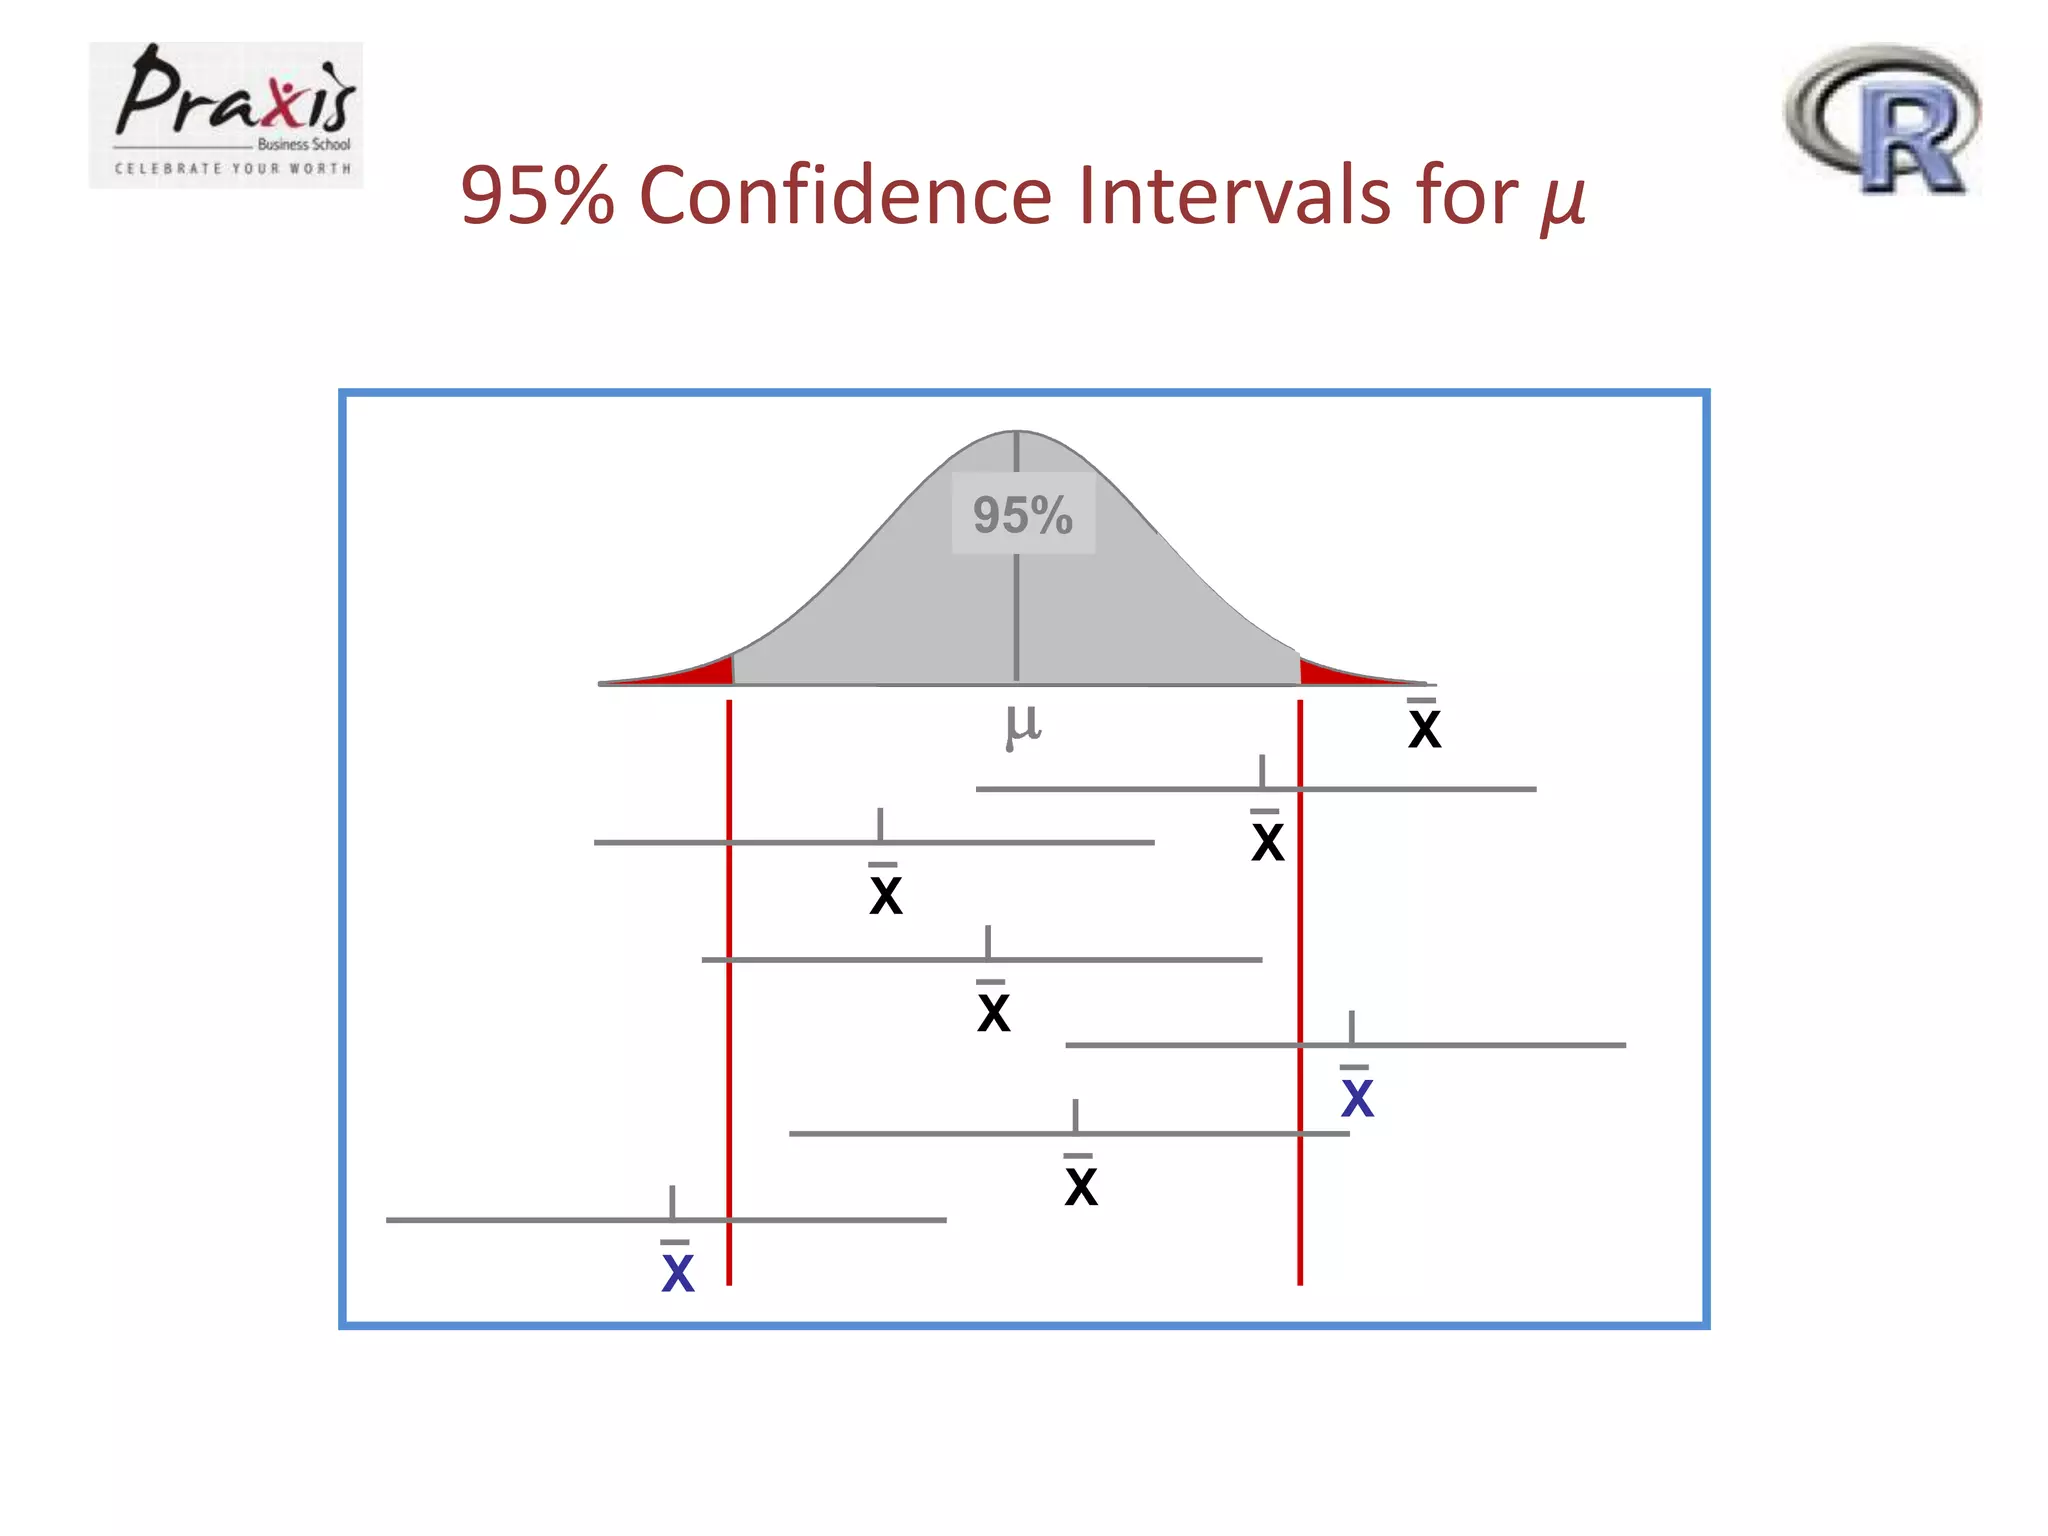
Significance of Levelof Confidence
• What does the Level of Confidence to be 95%/
mean?
• It means that if the research analyst were to
randomly select 100 samples of some size n
and use the result i.e. calculated sample mean
to construct a 95% confidence interval,
approximately 95 of the 100 confidence
intervals would contain the population mean.
• You will try out a practical example using R.
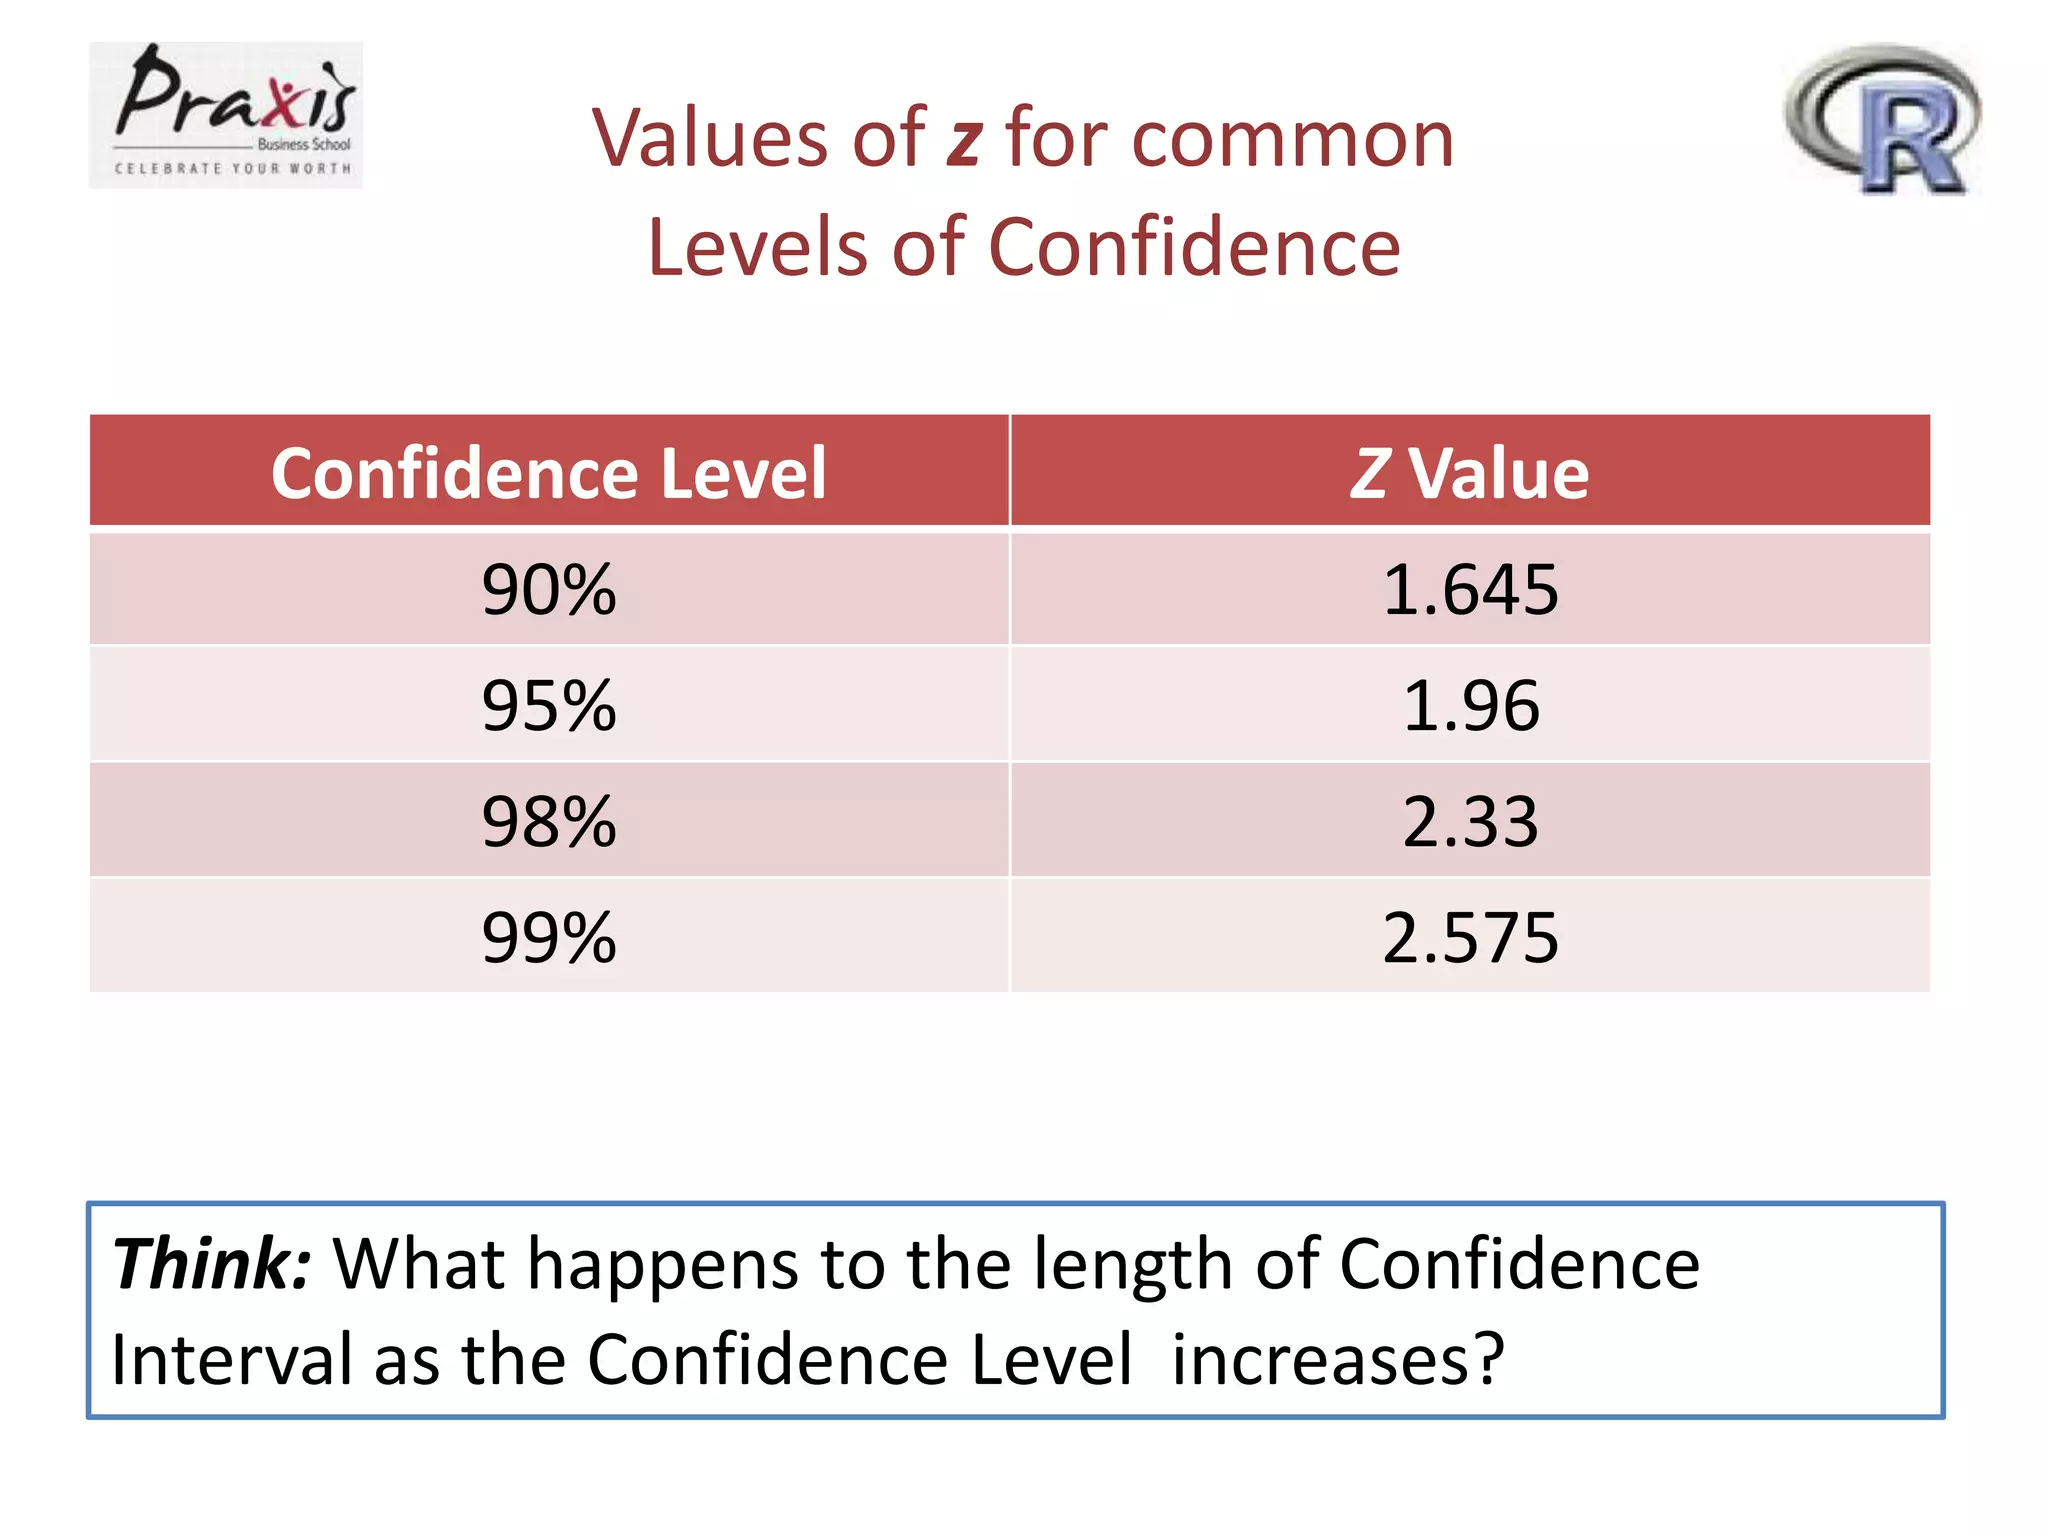
Values of zfor common
Levels of Confidence
Confidence Level
90%
95%
98%
99%
Z Value
1.645
1.96
2.33
2.575
Think: What happens to the length of Confidence
Interval as the Confidence Level increases?
12.
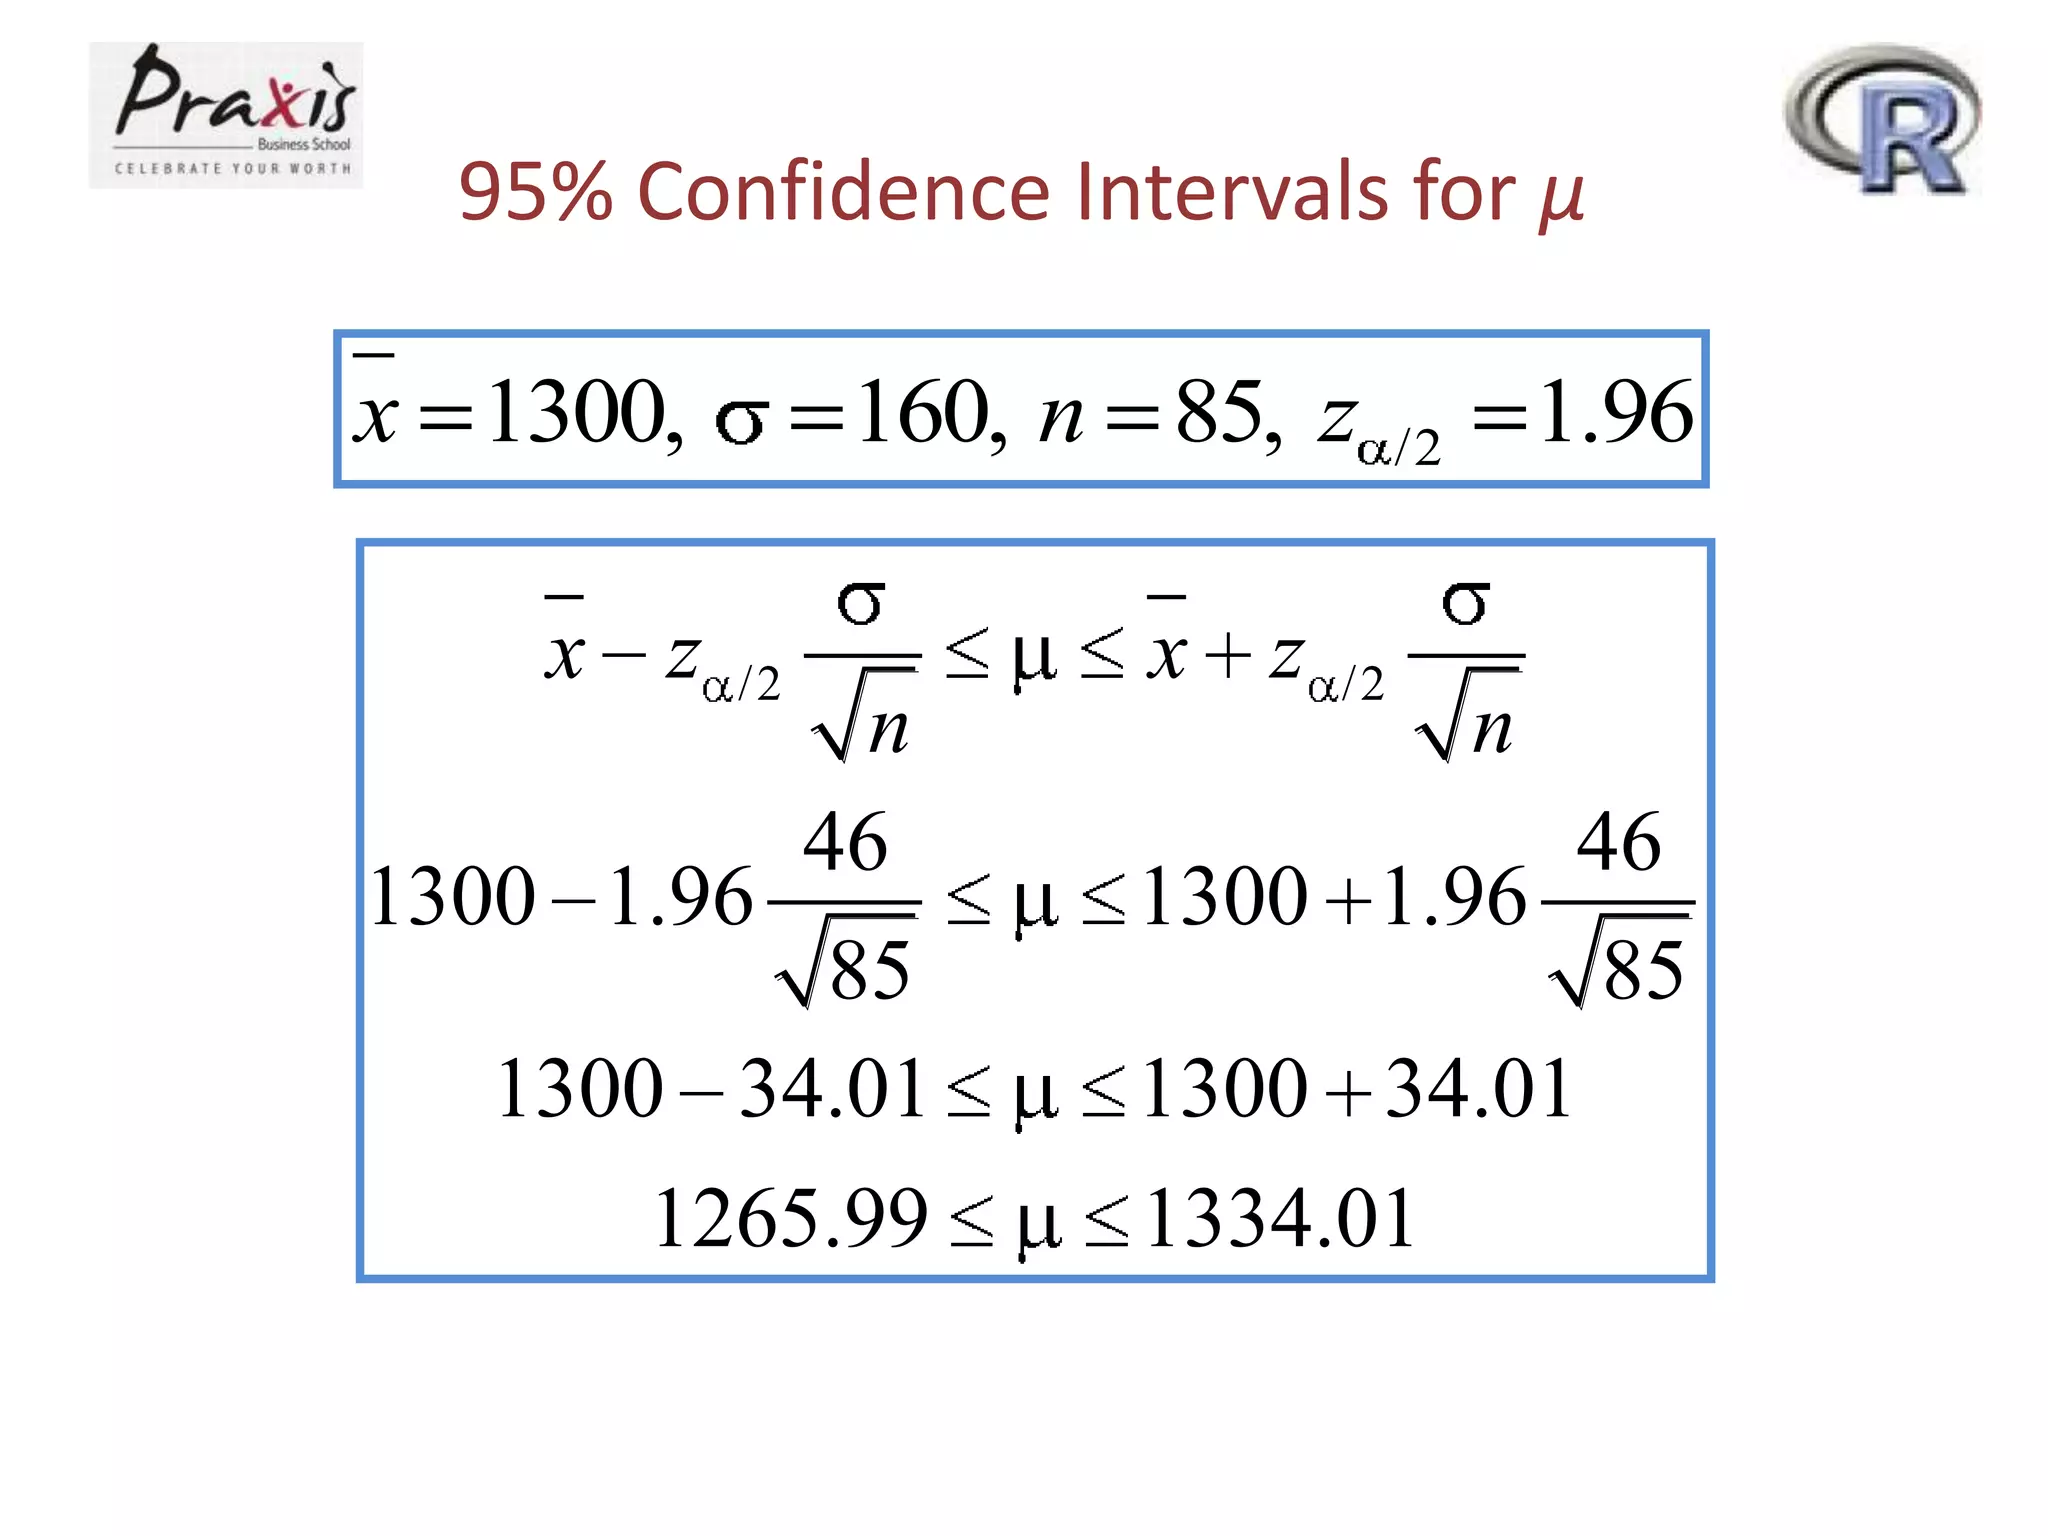
95% Confidence Intervalsfor μ
x 1300,
x z
160, n 85, z
/2
n
46
1300 1.96
85
1300 34.01
1265.99
x z
/2
1.96
/2
n
46
1300 1.96
85
1300 34.01
1334.01
13.
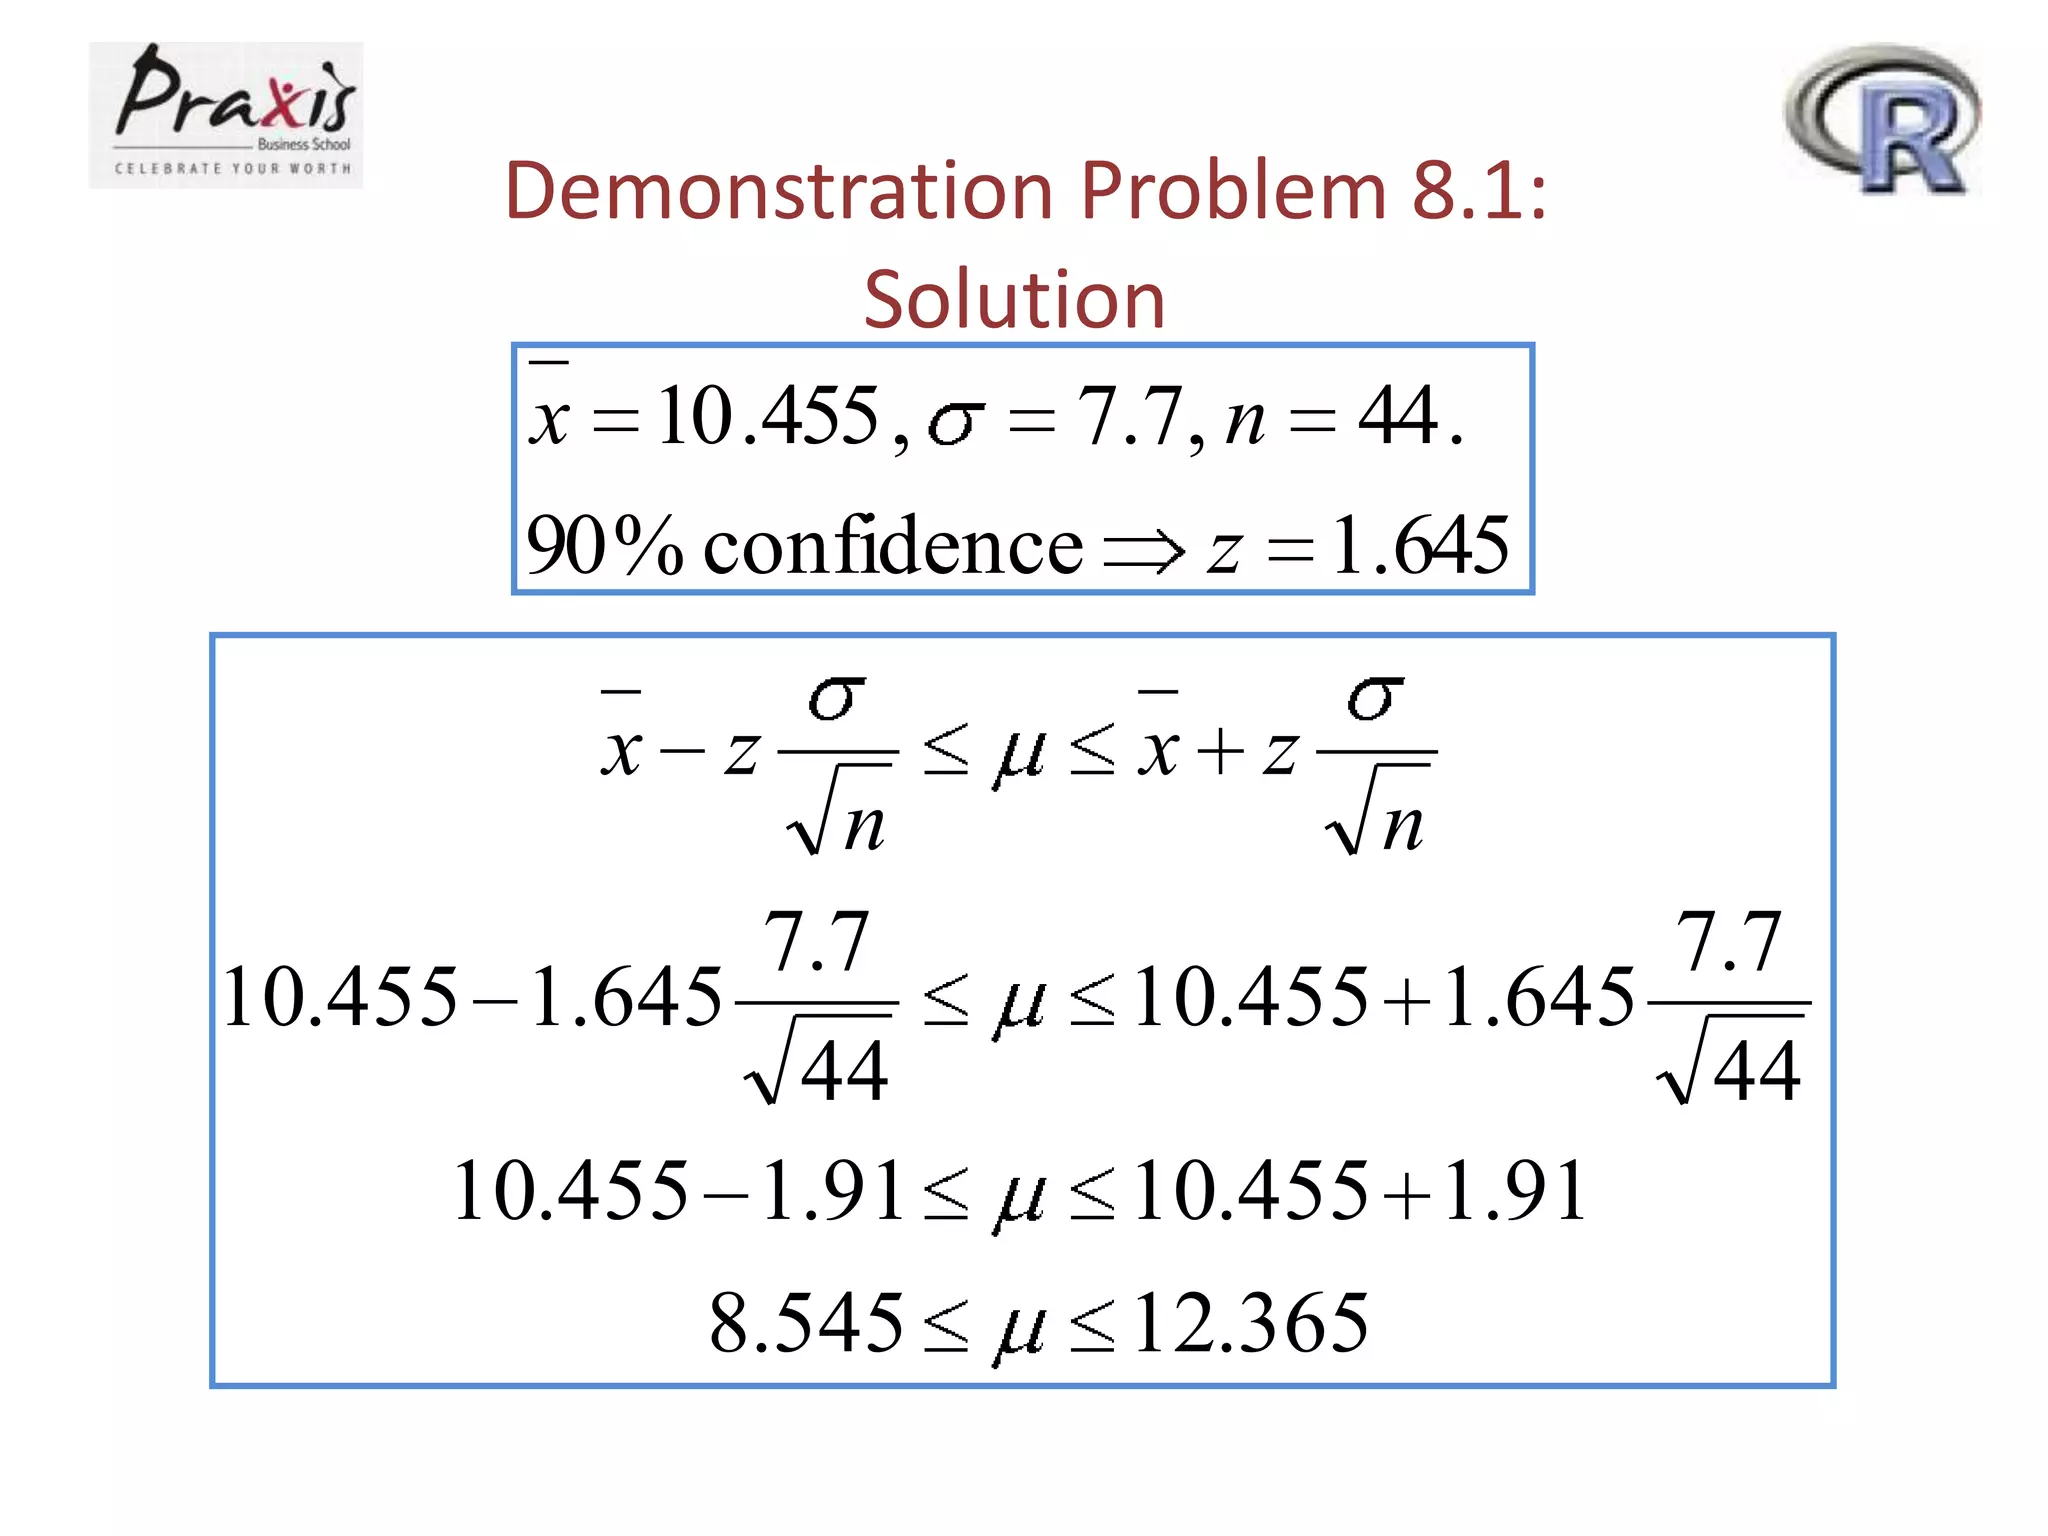
Demonstration Problem 8.1
•A survey was taken of U.S. companies that do
business with firms in India. One of the questions
on the survey was: Approximately how many years
has your company been trading with firms in India?
A random sample of 44 responses to this question
yielded a mean of 10.455 years. Suppose the
population standard deviation for this question
is 7.7 years. Using this information, construct a 90%
confidence interval for the mean number of years that
a company has been trading in India for the population
of U.S. companies trading with firms in India.
14.
Demonstration Problem 8.1:
Solution
x10 .455 ,
7.7, n 44 .
90 % confidence z 1.645
x z
n
7.7
10.455 1.645
44
10.455 1.91
8.545
x z
n
7.7
10.455 1.645
44
10.455 1.91
12.365
15.
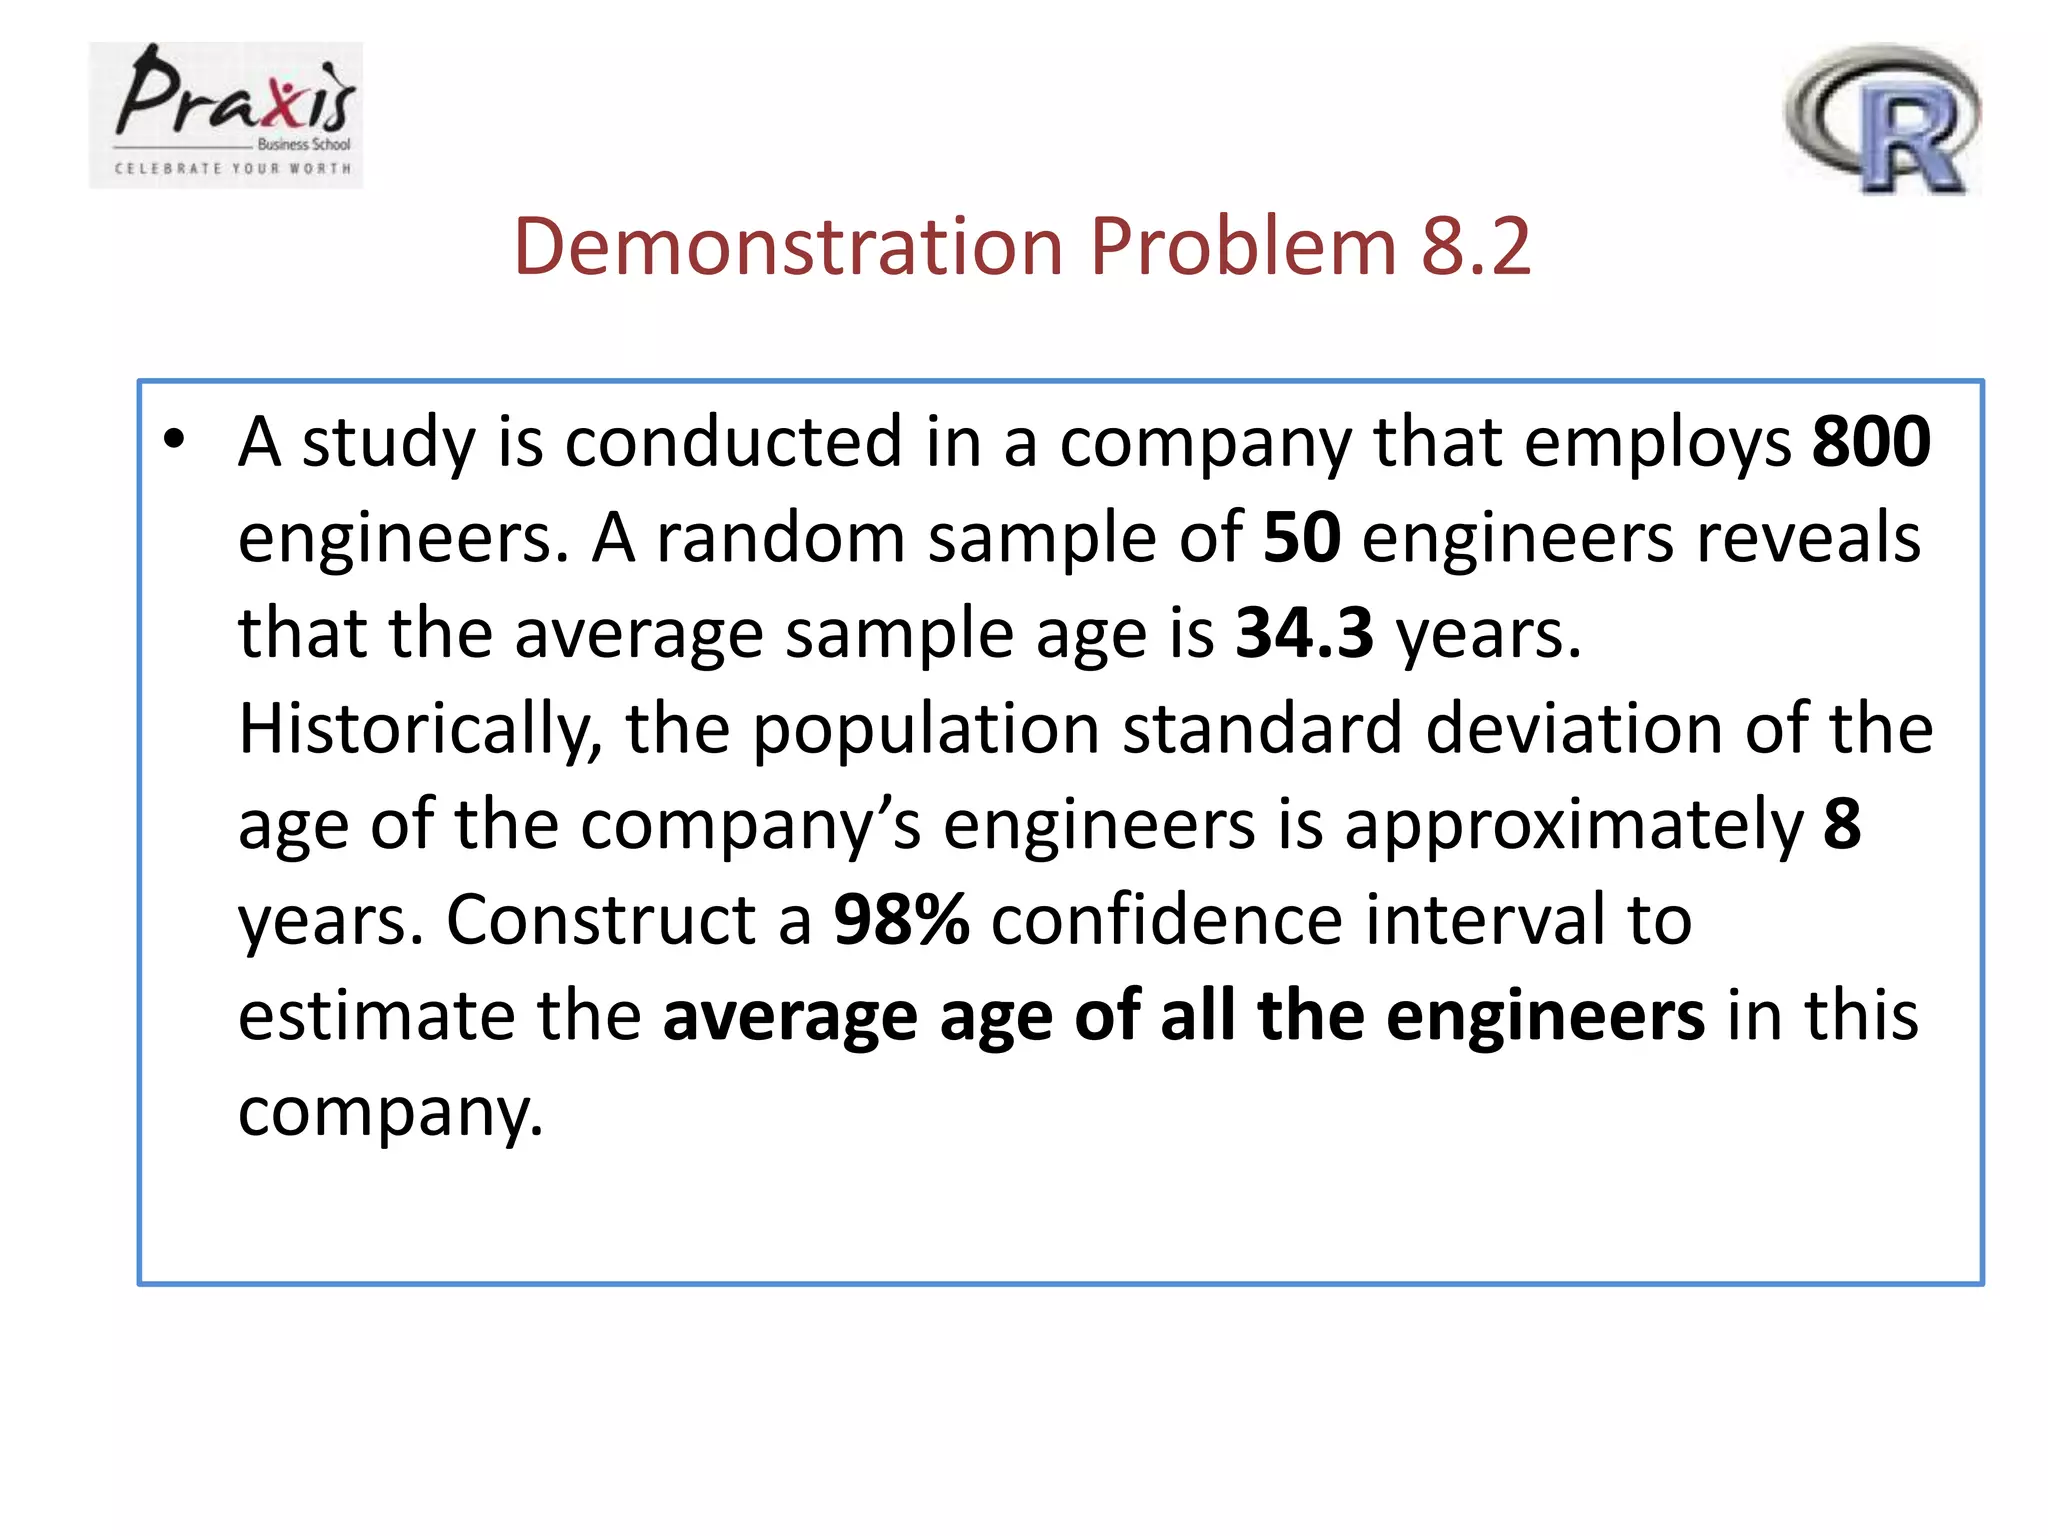
Demonstration Problem 8.2
•A study is conducted in a company that employs 800
engineers. A random sample of 50 engineers reveals
that the average sample age is 34.3 years.
Historically, the population standard deviation of the
age of the company’s engineers is approximately 8
years. Construct a 98% confidence interval to
estimate the average age of all the engineers in this
company.
16.
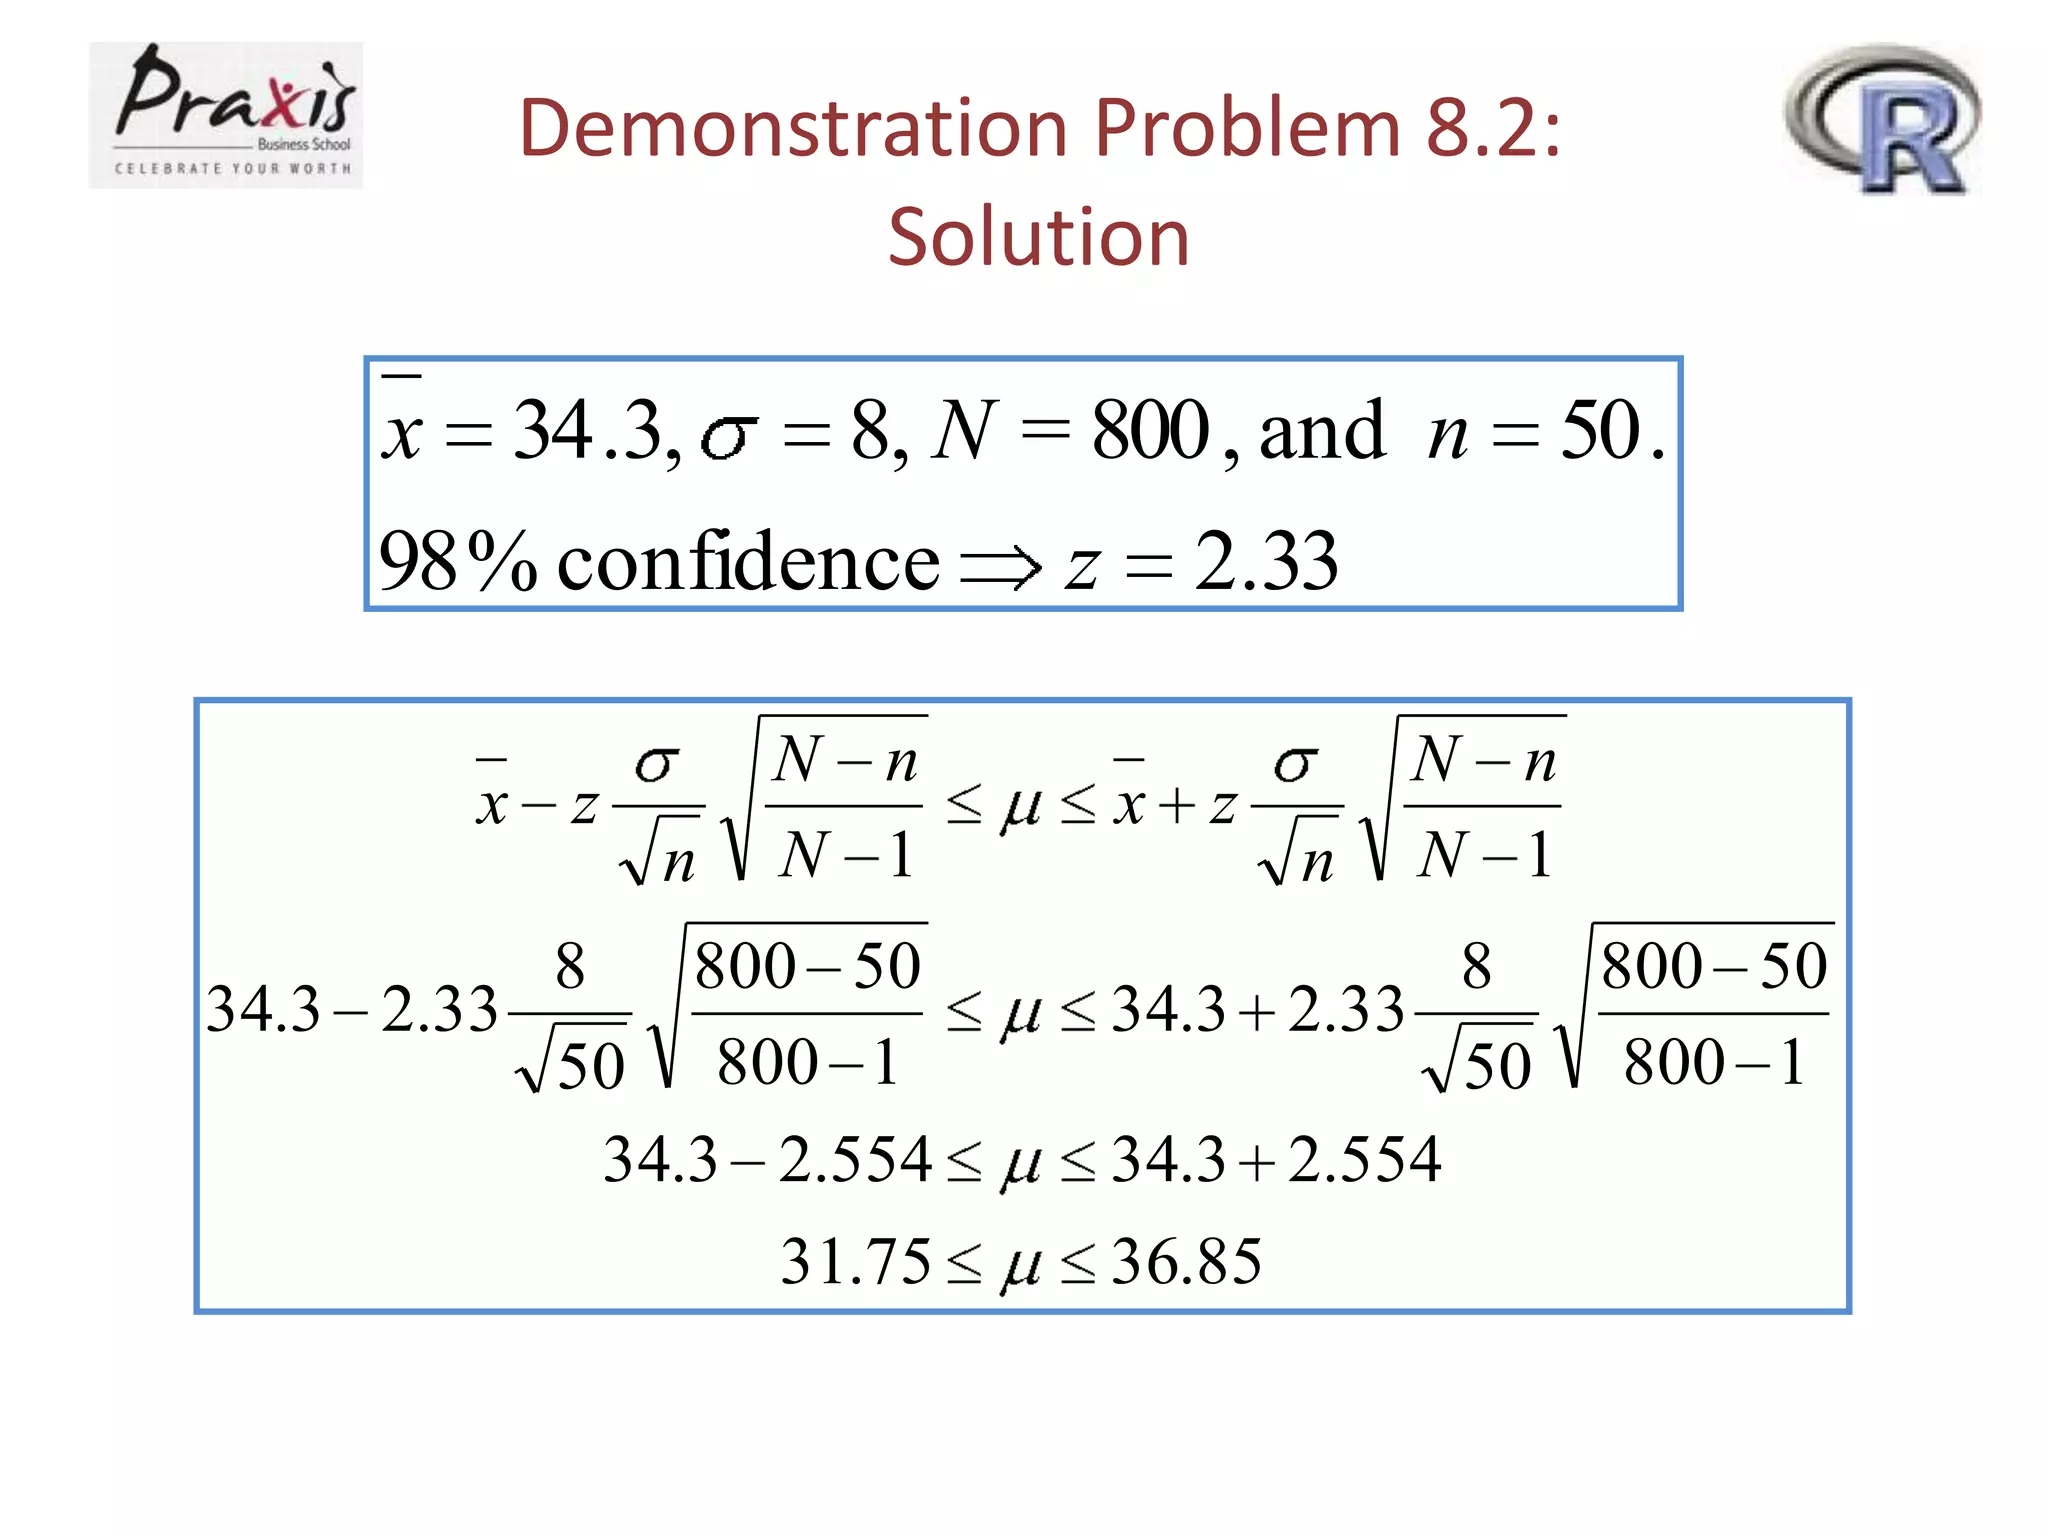
Demonstration Problem 8.2:
Solution
x34 .3,
8, N = 800 , and n 50 .
98 % confidence z 2.33
x z
n
N n
N 1
8
800 50
34.3 2.33
50 800 1
34.3 2.554
31.75
x z
n
N n
N 1
8
800 50
34.3 2.33
50 800 1
34.3 2.554
36.85
17.
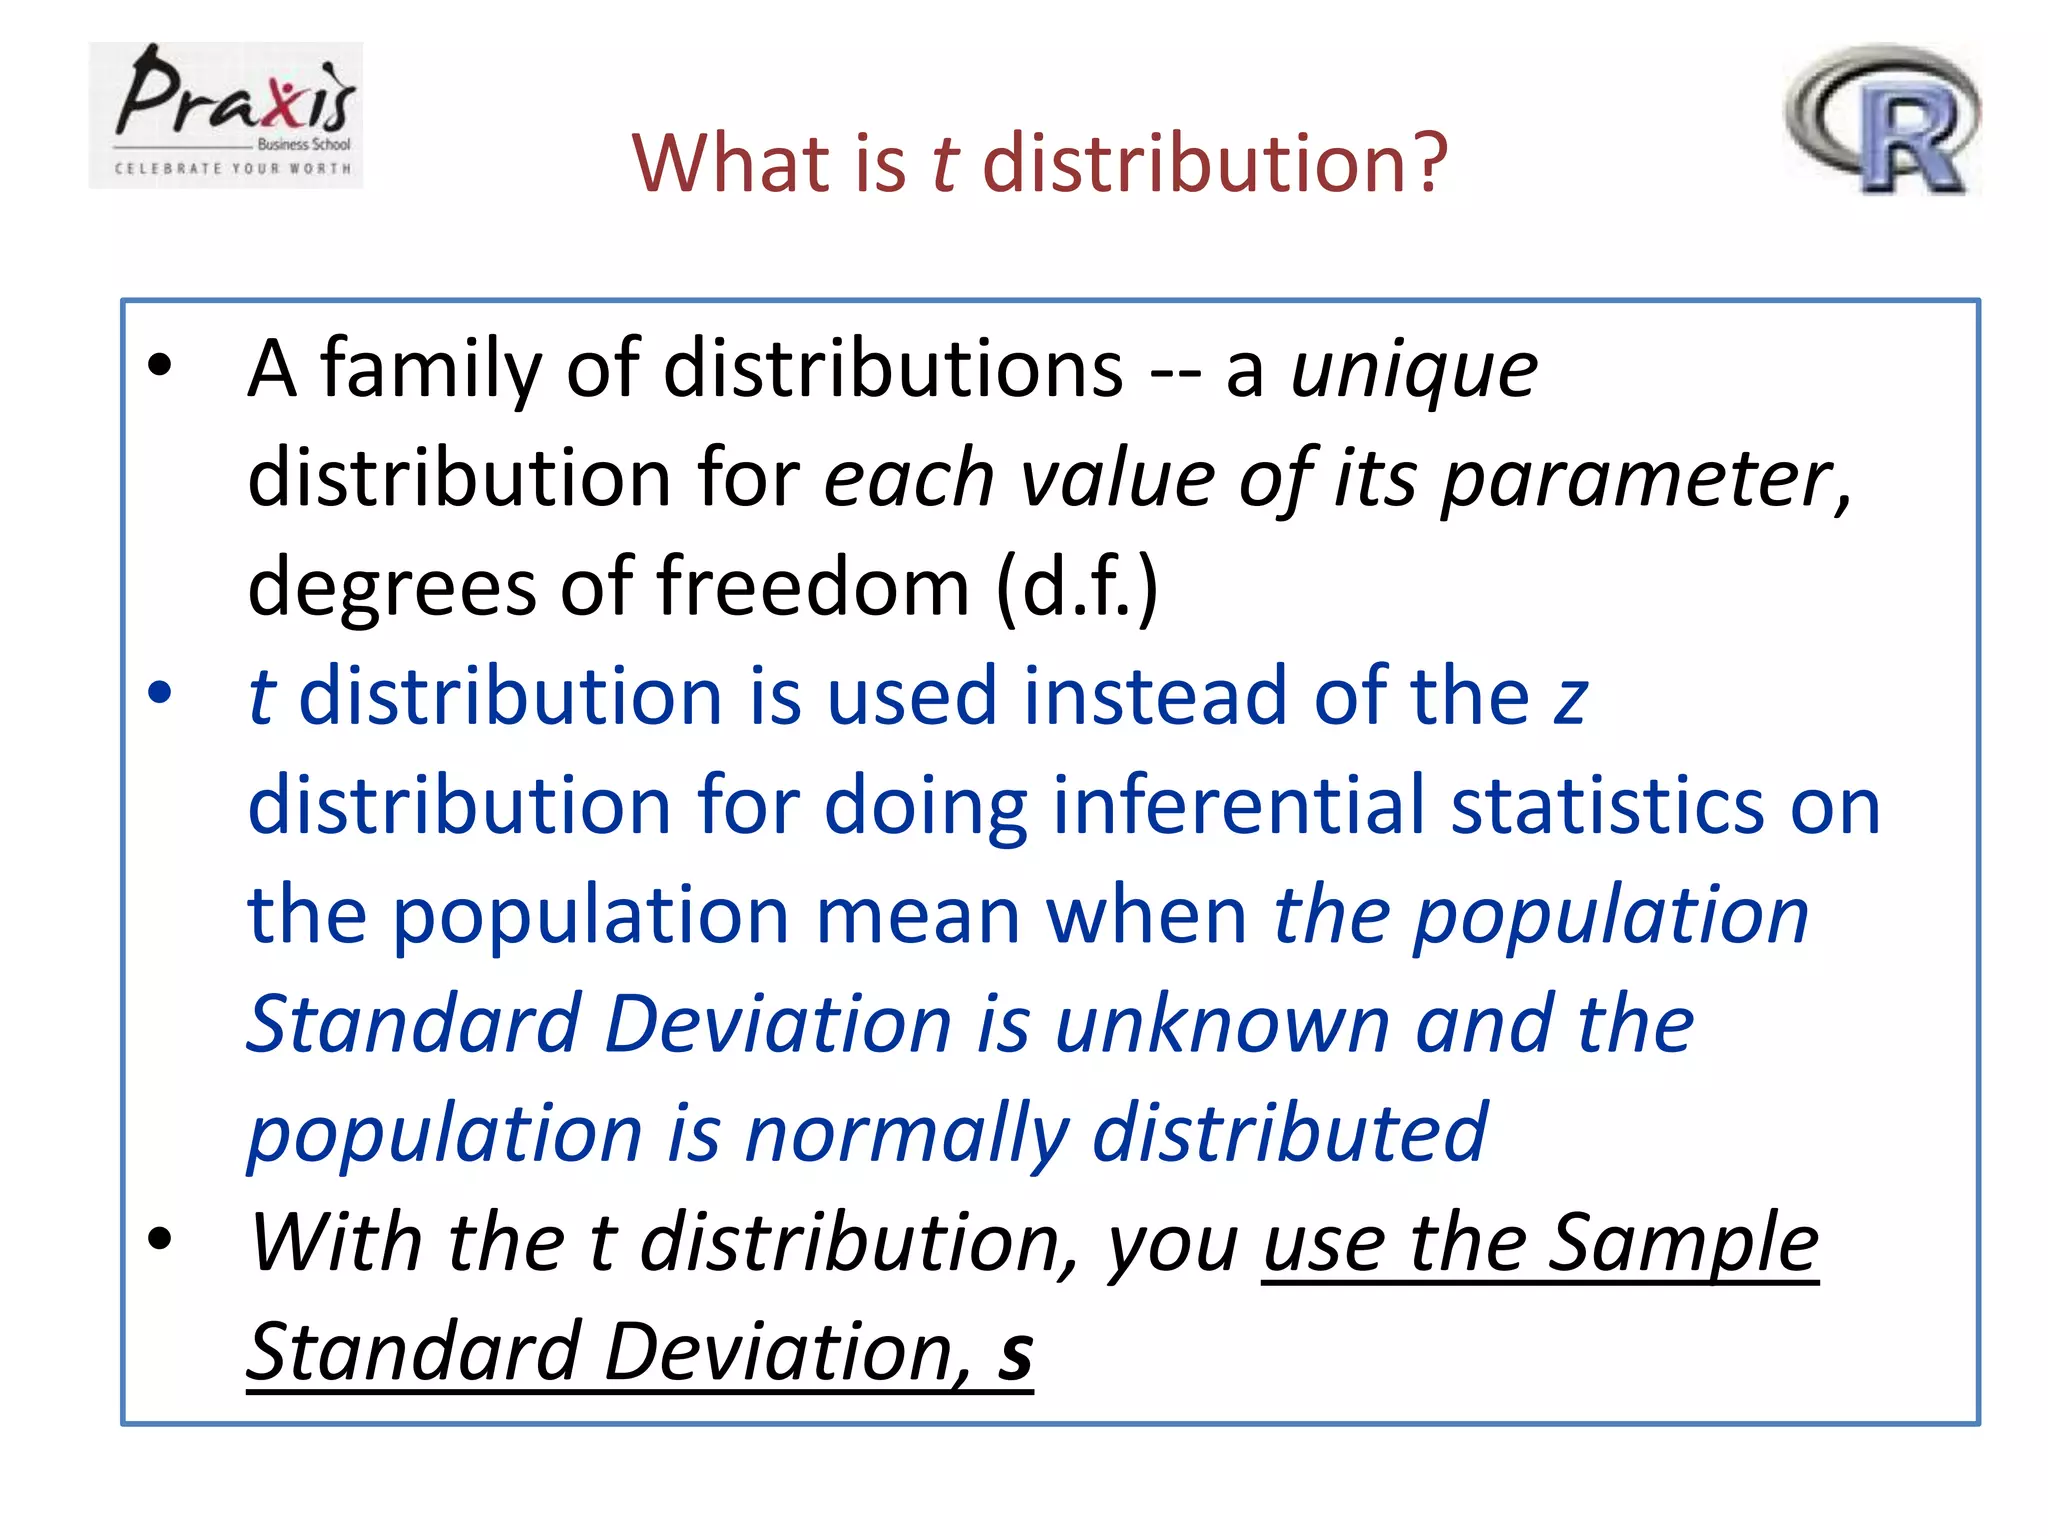
What is tdistribution?
• A family of distributions -- a unique
distribution for each value of its parameter,
degrees of freedom (d.f.)
• t distribution is used instead of the z
distribution for doing inferential statistics on
the population mean when the population
Standard Deviation is unknown and the
population is normally distributed
• With the t distribution, you use the Sample
Standard Deviation, s
18.
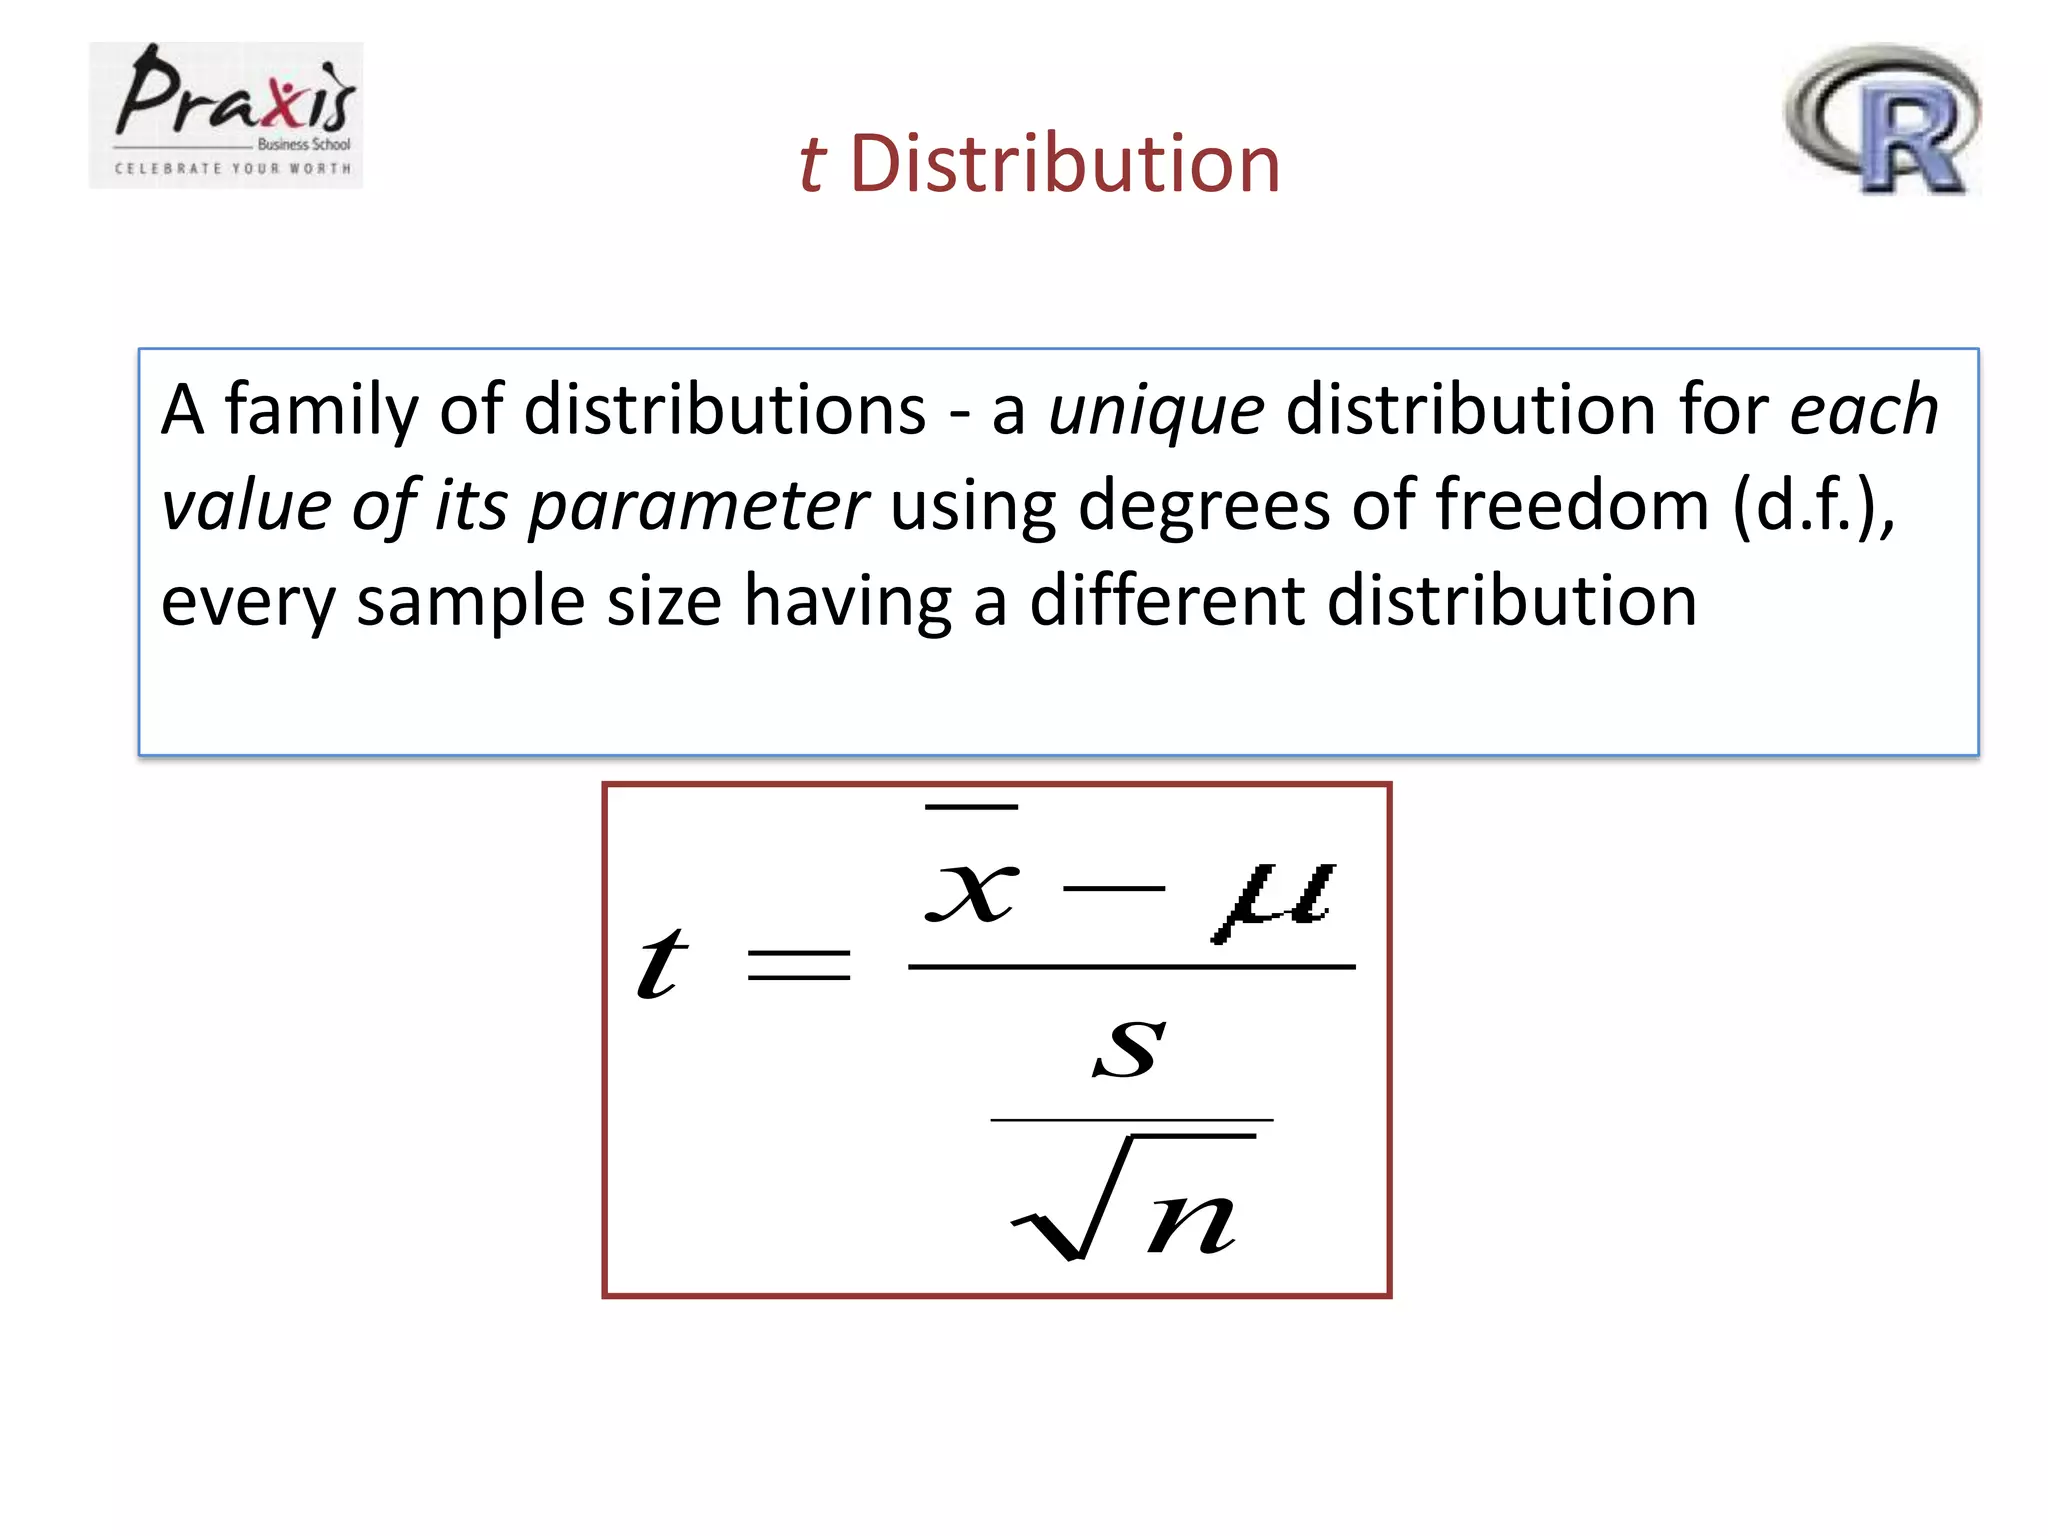
t Distribution
A familyof distributions - a unique distribution for each
value of its parameter using degrees of freedom (d.f.),
every sample size having a different distribution
t
x
s
n
19.
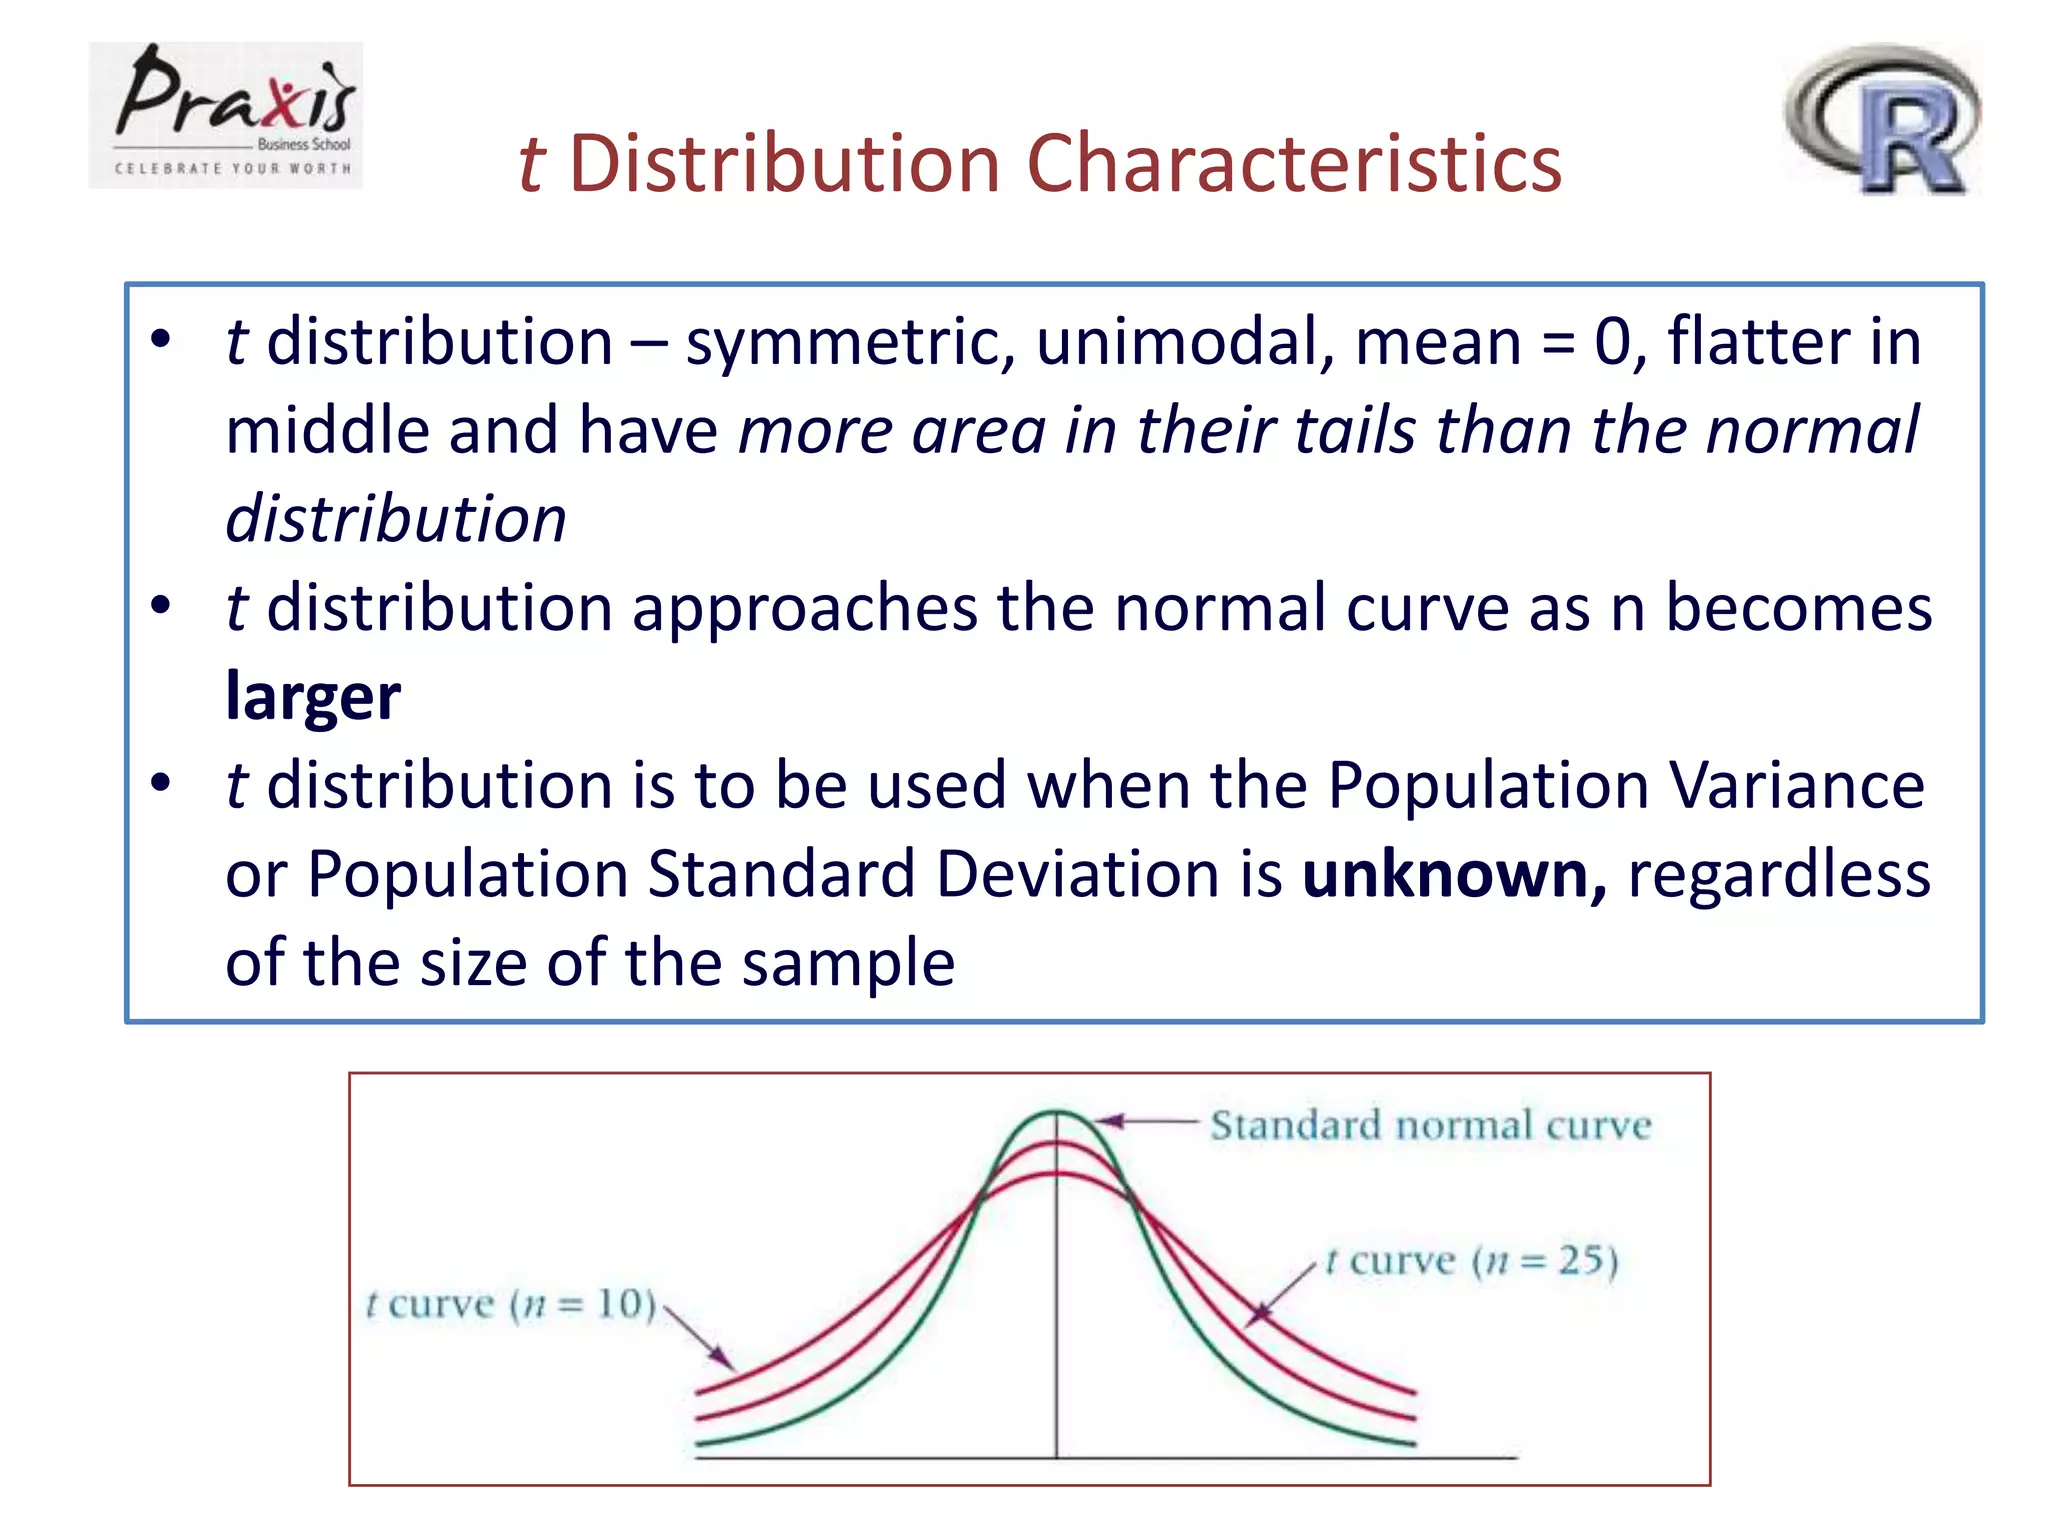
t Distribution Characteristics
•t distribution – symmetric, unimodal, mean = 0, flatter in
middle and have more area in their tails than the normal
distribution
• t distribution approaches the normal curve as n becomes
larger
• t distribution is to be used when the Population Variance
or Population Standard Deviation is unknown, regardless
of the size of the sample
20.
Robustness of tDistribution
• Most statistical techniques have one or
more underlying assumptions
• If a technique is relatively insensitive to
minor violations in one or more
assumptions, the technique is said to be
robust to that assumption.
• t statistic for estimating a population mean
is relatively robust to the assumption that
the population is normally distributed
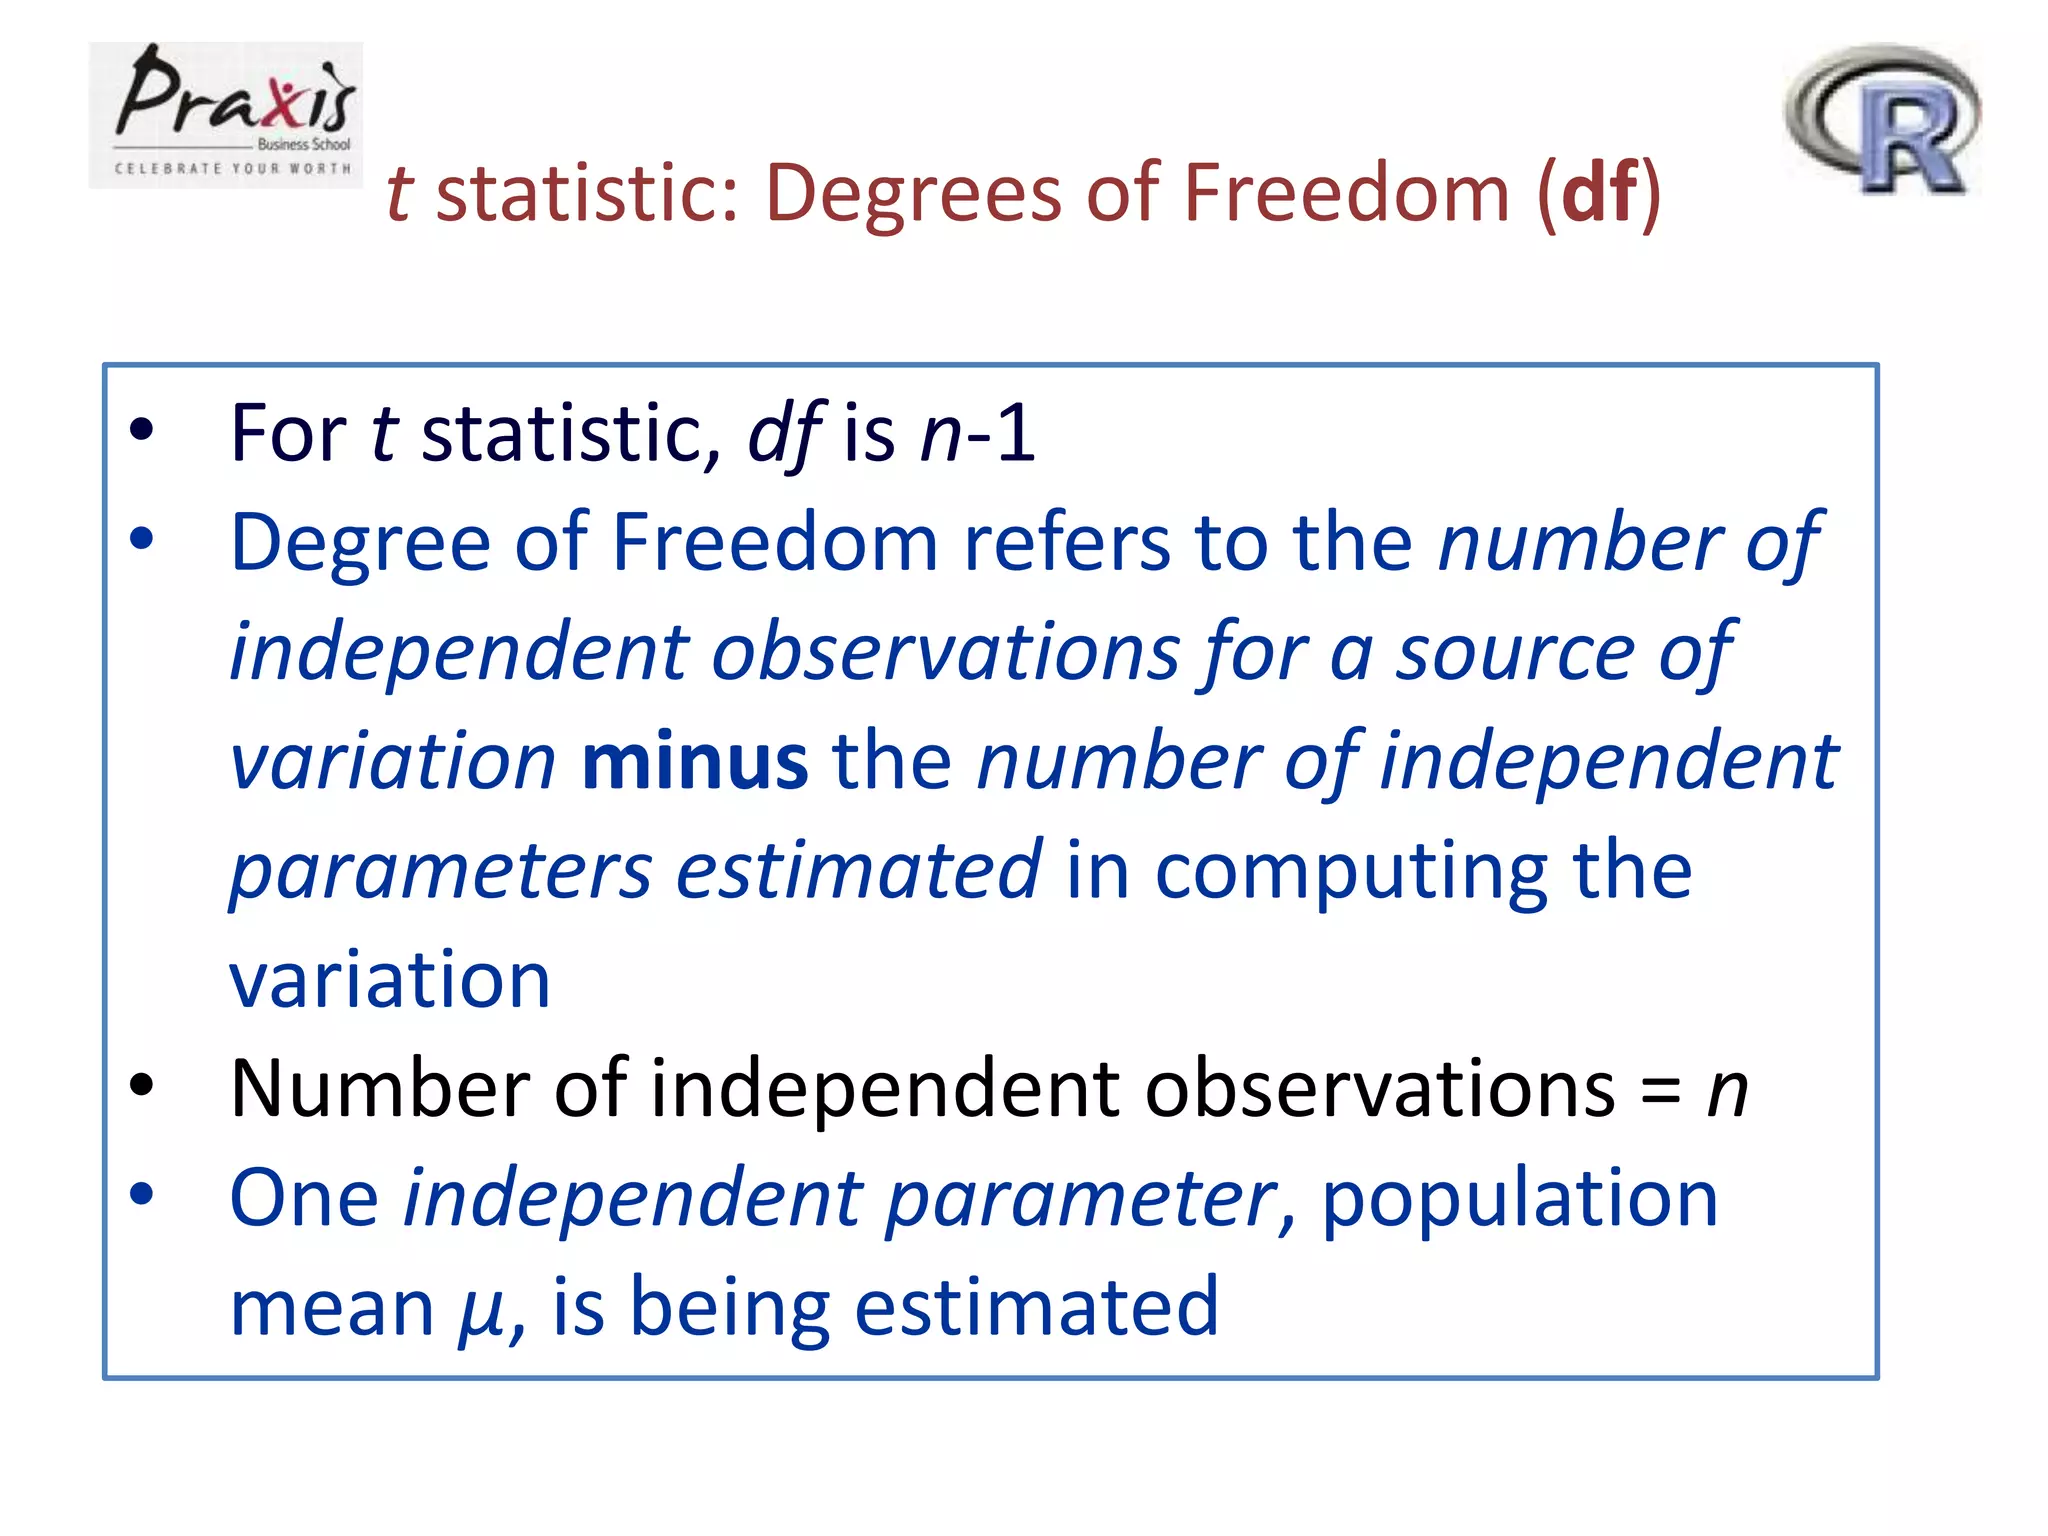
t statistic: Degreesof Freedom (df)
• For t statistic, df is n-1
• Degree of Freedom refers to the number of
independent observations for a source of
variation minus the number of independent
parameters estimated in computing the
variation
• Number of independent observations = n
• One independent parameter, population
mean μ, is being estimated
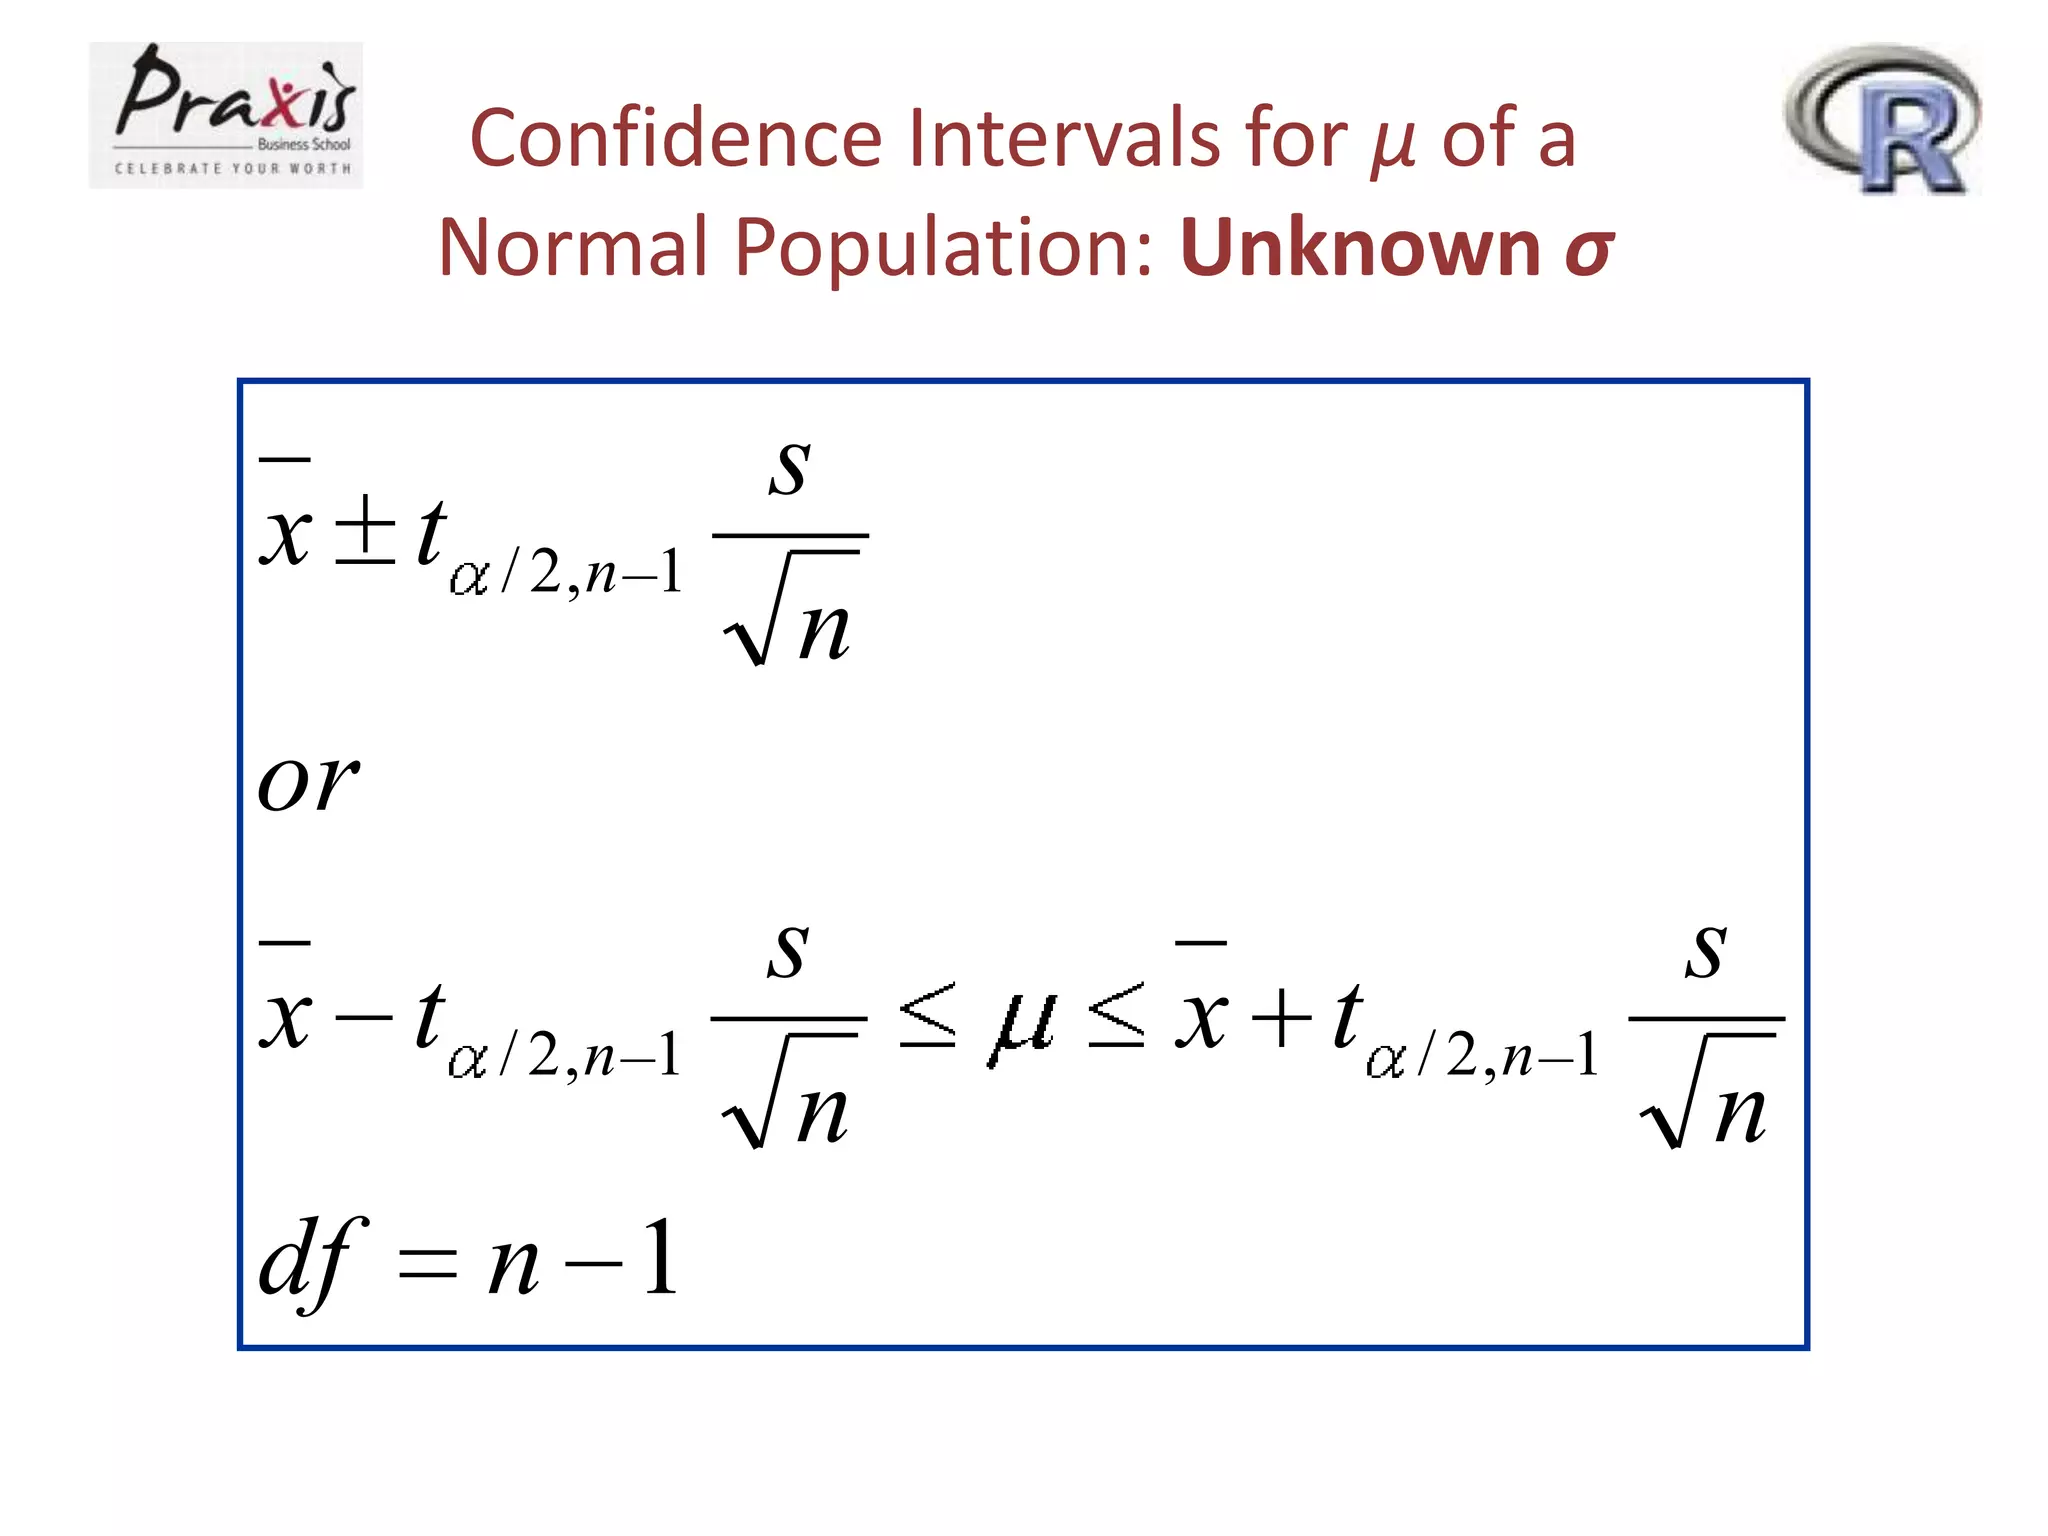
23.
Confidence Intervals forμ of a
Normal Population: Unknown σ
/ 2,n 1
s
n
x t
/ 2,n 1
s
n
df
n 1
x t
or
x t
/ 2,n 1
s
n
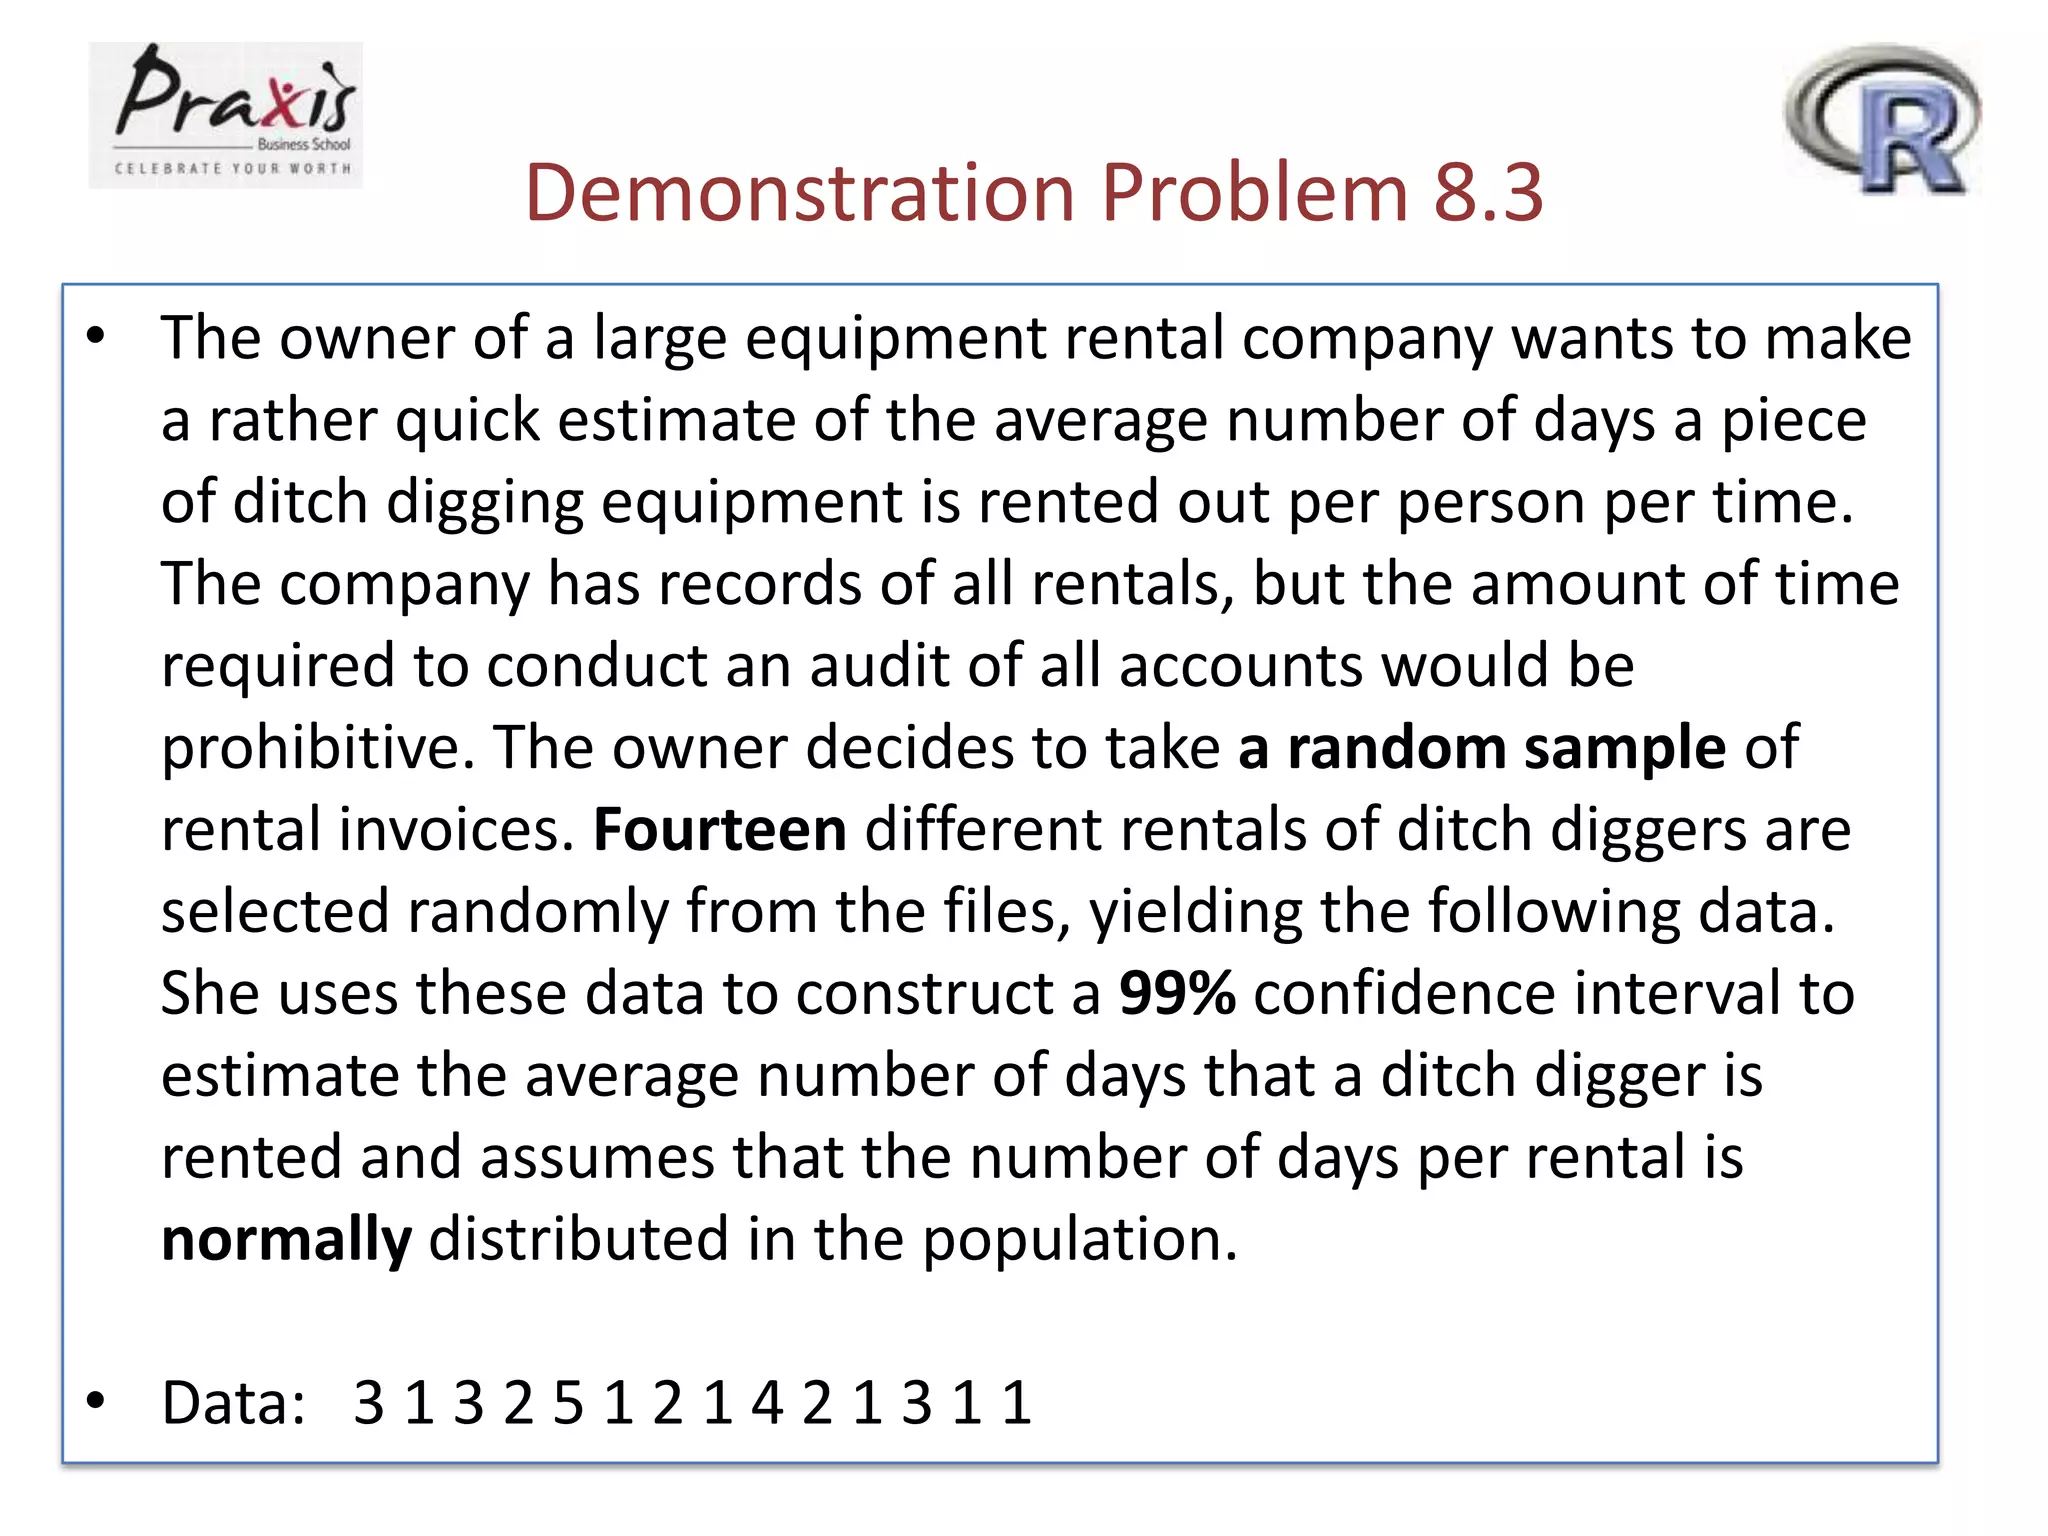
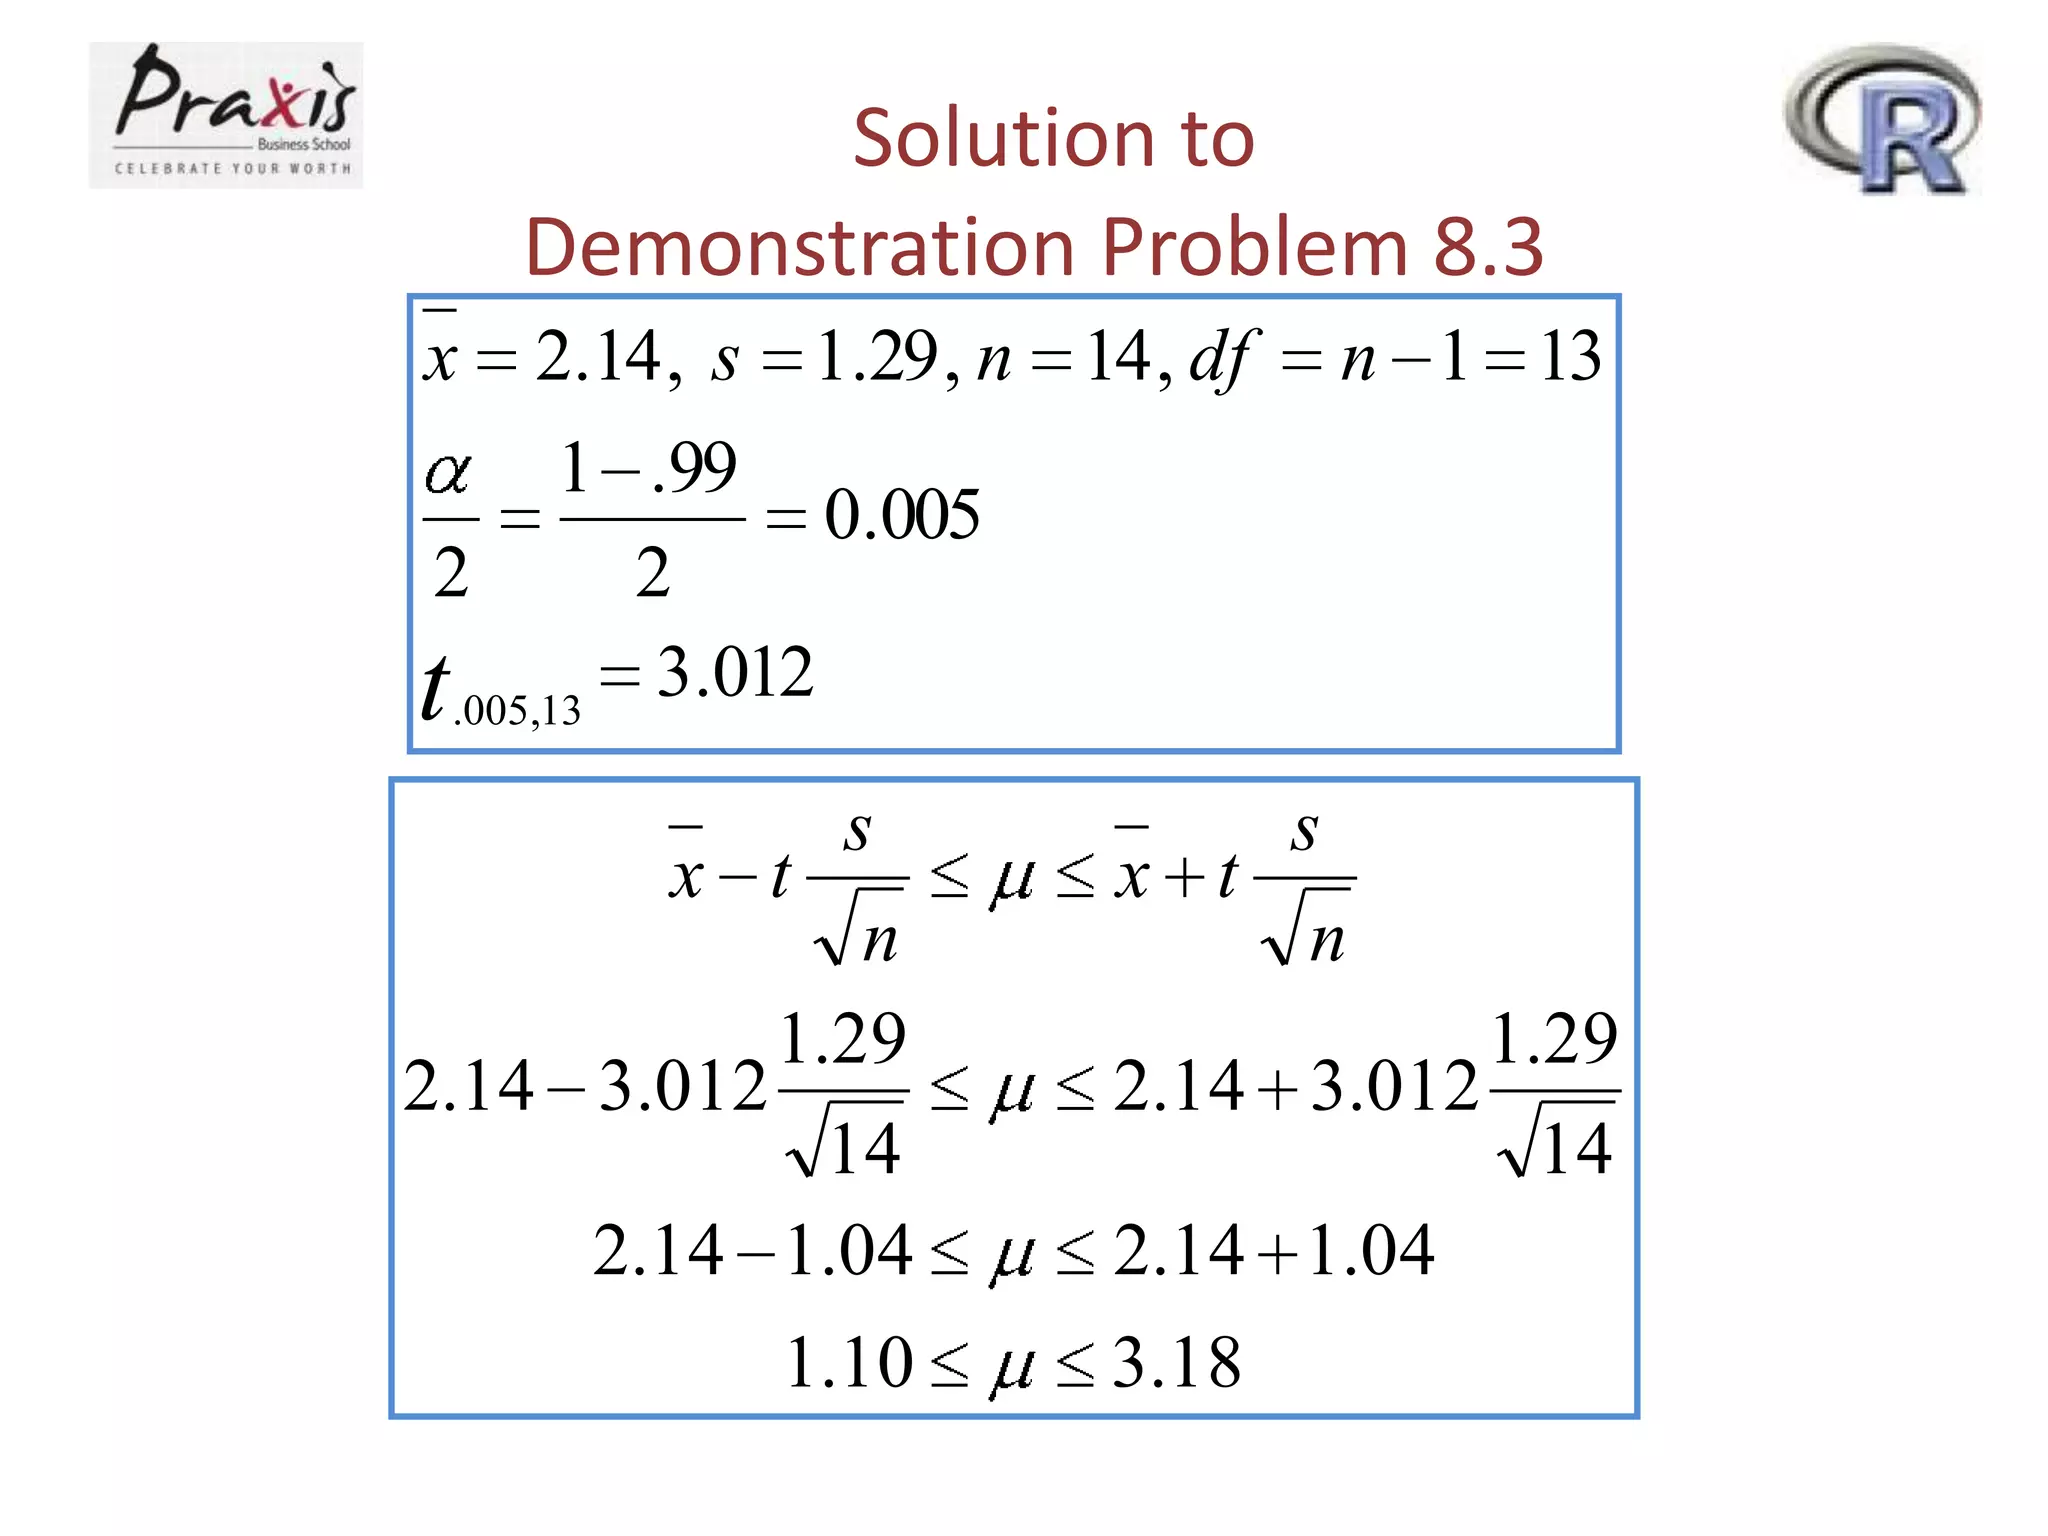
Demonstration Problem 8.3
•The owner of a large equipment rental company wants to make
a rather quick estimate of the average number of days a piece
of ditch digging equipment is rented out per person per time.
The company has records of all rentals, but the amount of time
required to conduct an audit of all accounts would be
prohibitive. The owner decides to take a random sample of
rental invoices. Fourteen different rentals of ditch diggers are
selected randomly from the files, yielding the following data.
She uses these data to construct a 99% confidence interval to
estimate the average number of days that a ditch digger is
rented and assumes that the number of days per rental is
normally distributed in the population.
• Data: 3 1 3 2 5 1 2 1 4 2 1 3 1 1
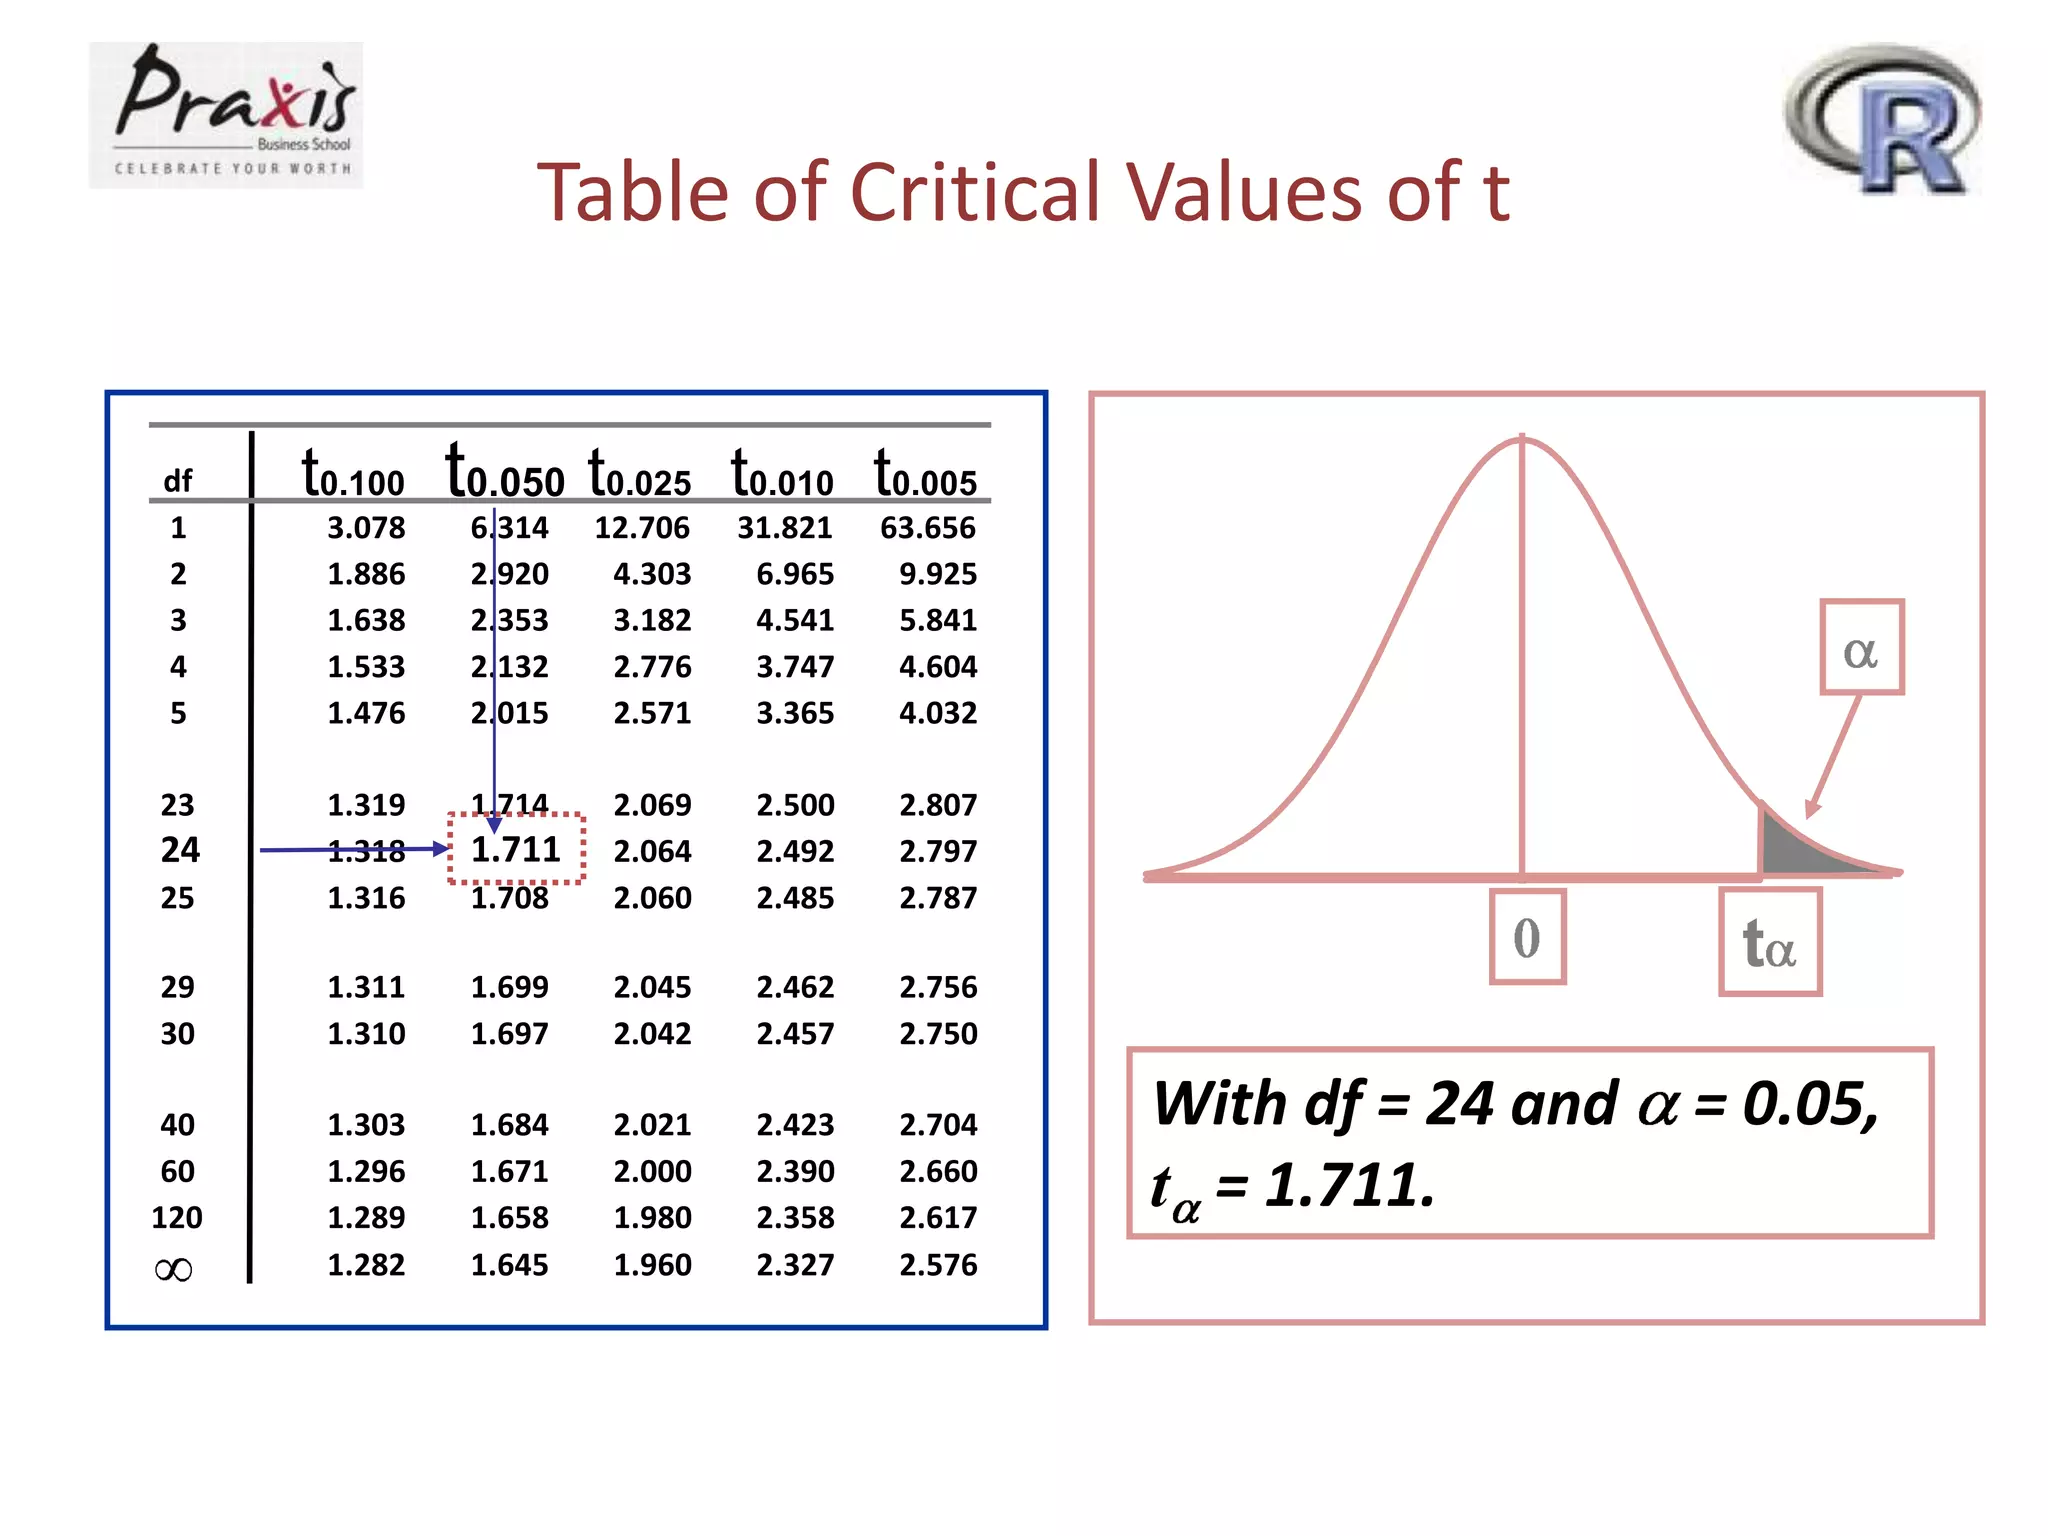
26.
Solution to
Demonstration Problem8.3
x
2.14 , s 1.29 , n 14 , df
n 1 13
1 .99
0.005
2
2
t .005,13 3.012
s
x t
n
1.29
2.14 3.012
14
2.14 1.04
1.10
s
x t
n
1.29
2.14 3.012
14
2.14 1.04
3.18
27.
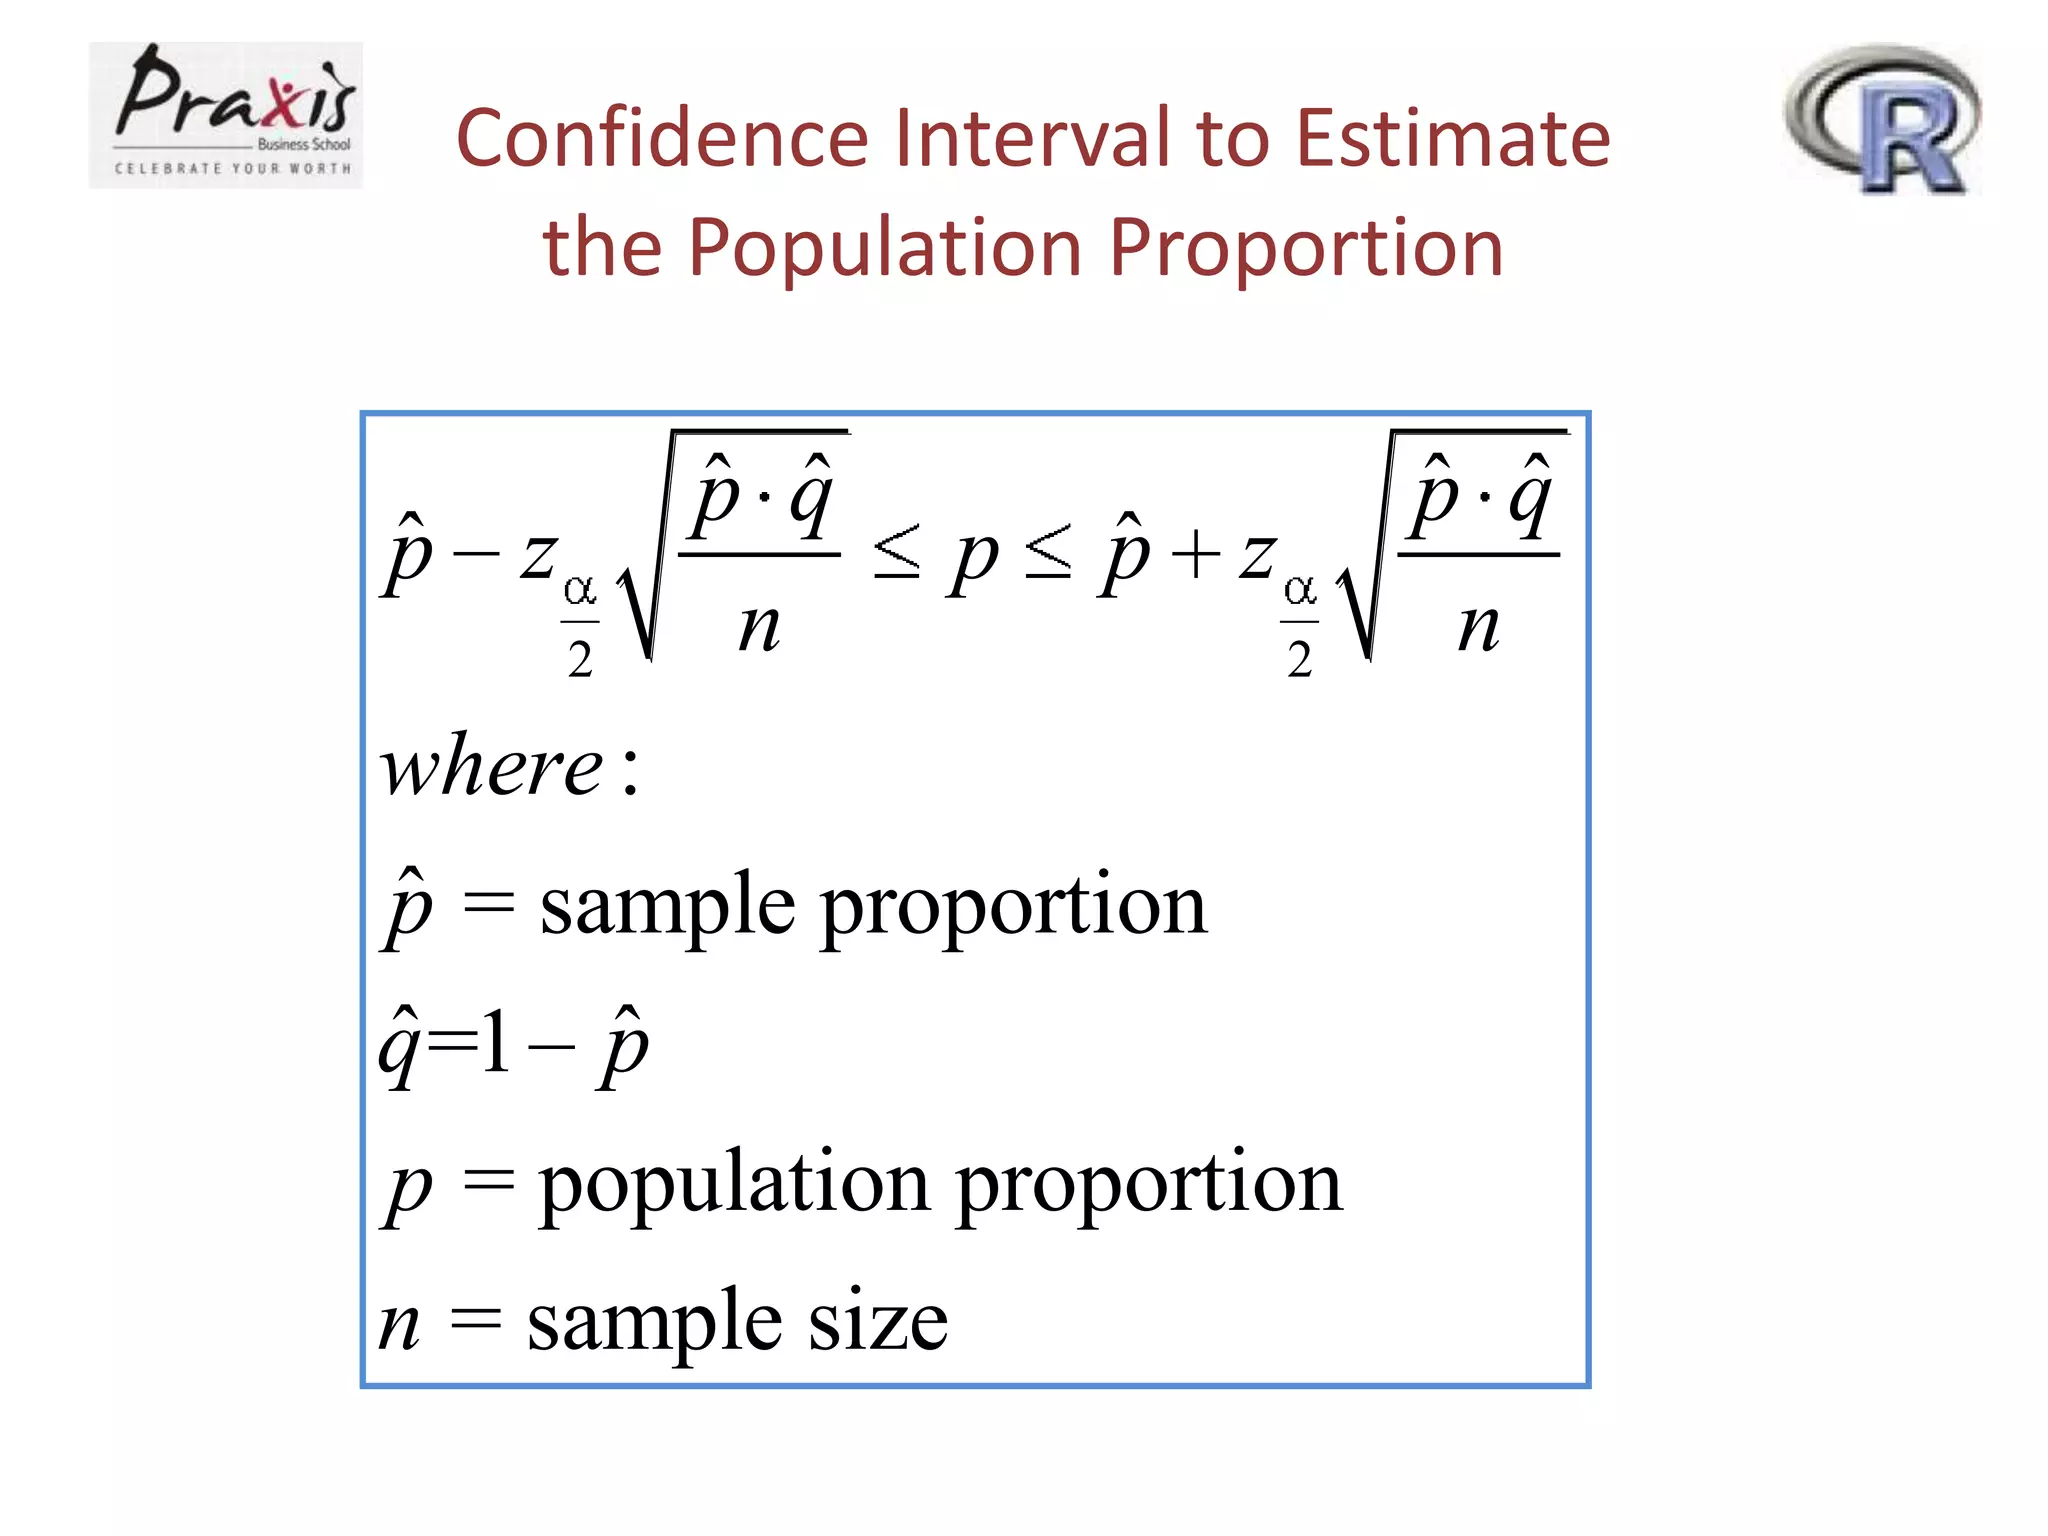
Confidence Interval toEstimate
the Population Proportion
ˆ
p z
2
ˆ ˆ
p q
n
p
ˆ
p z
2
where :
ˆ
p = sample proportion
ˆ
ˆ
q =1 p
p = population proportion
n = sample size
ˆ ˆ
p q
n
28.
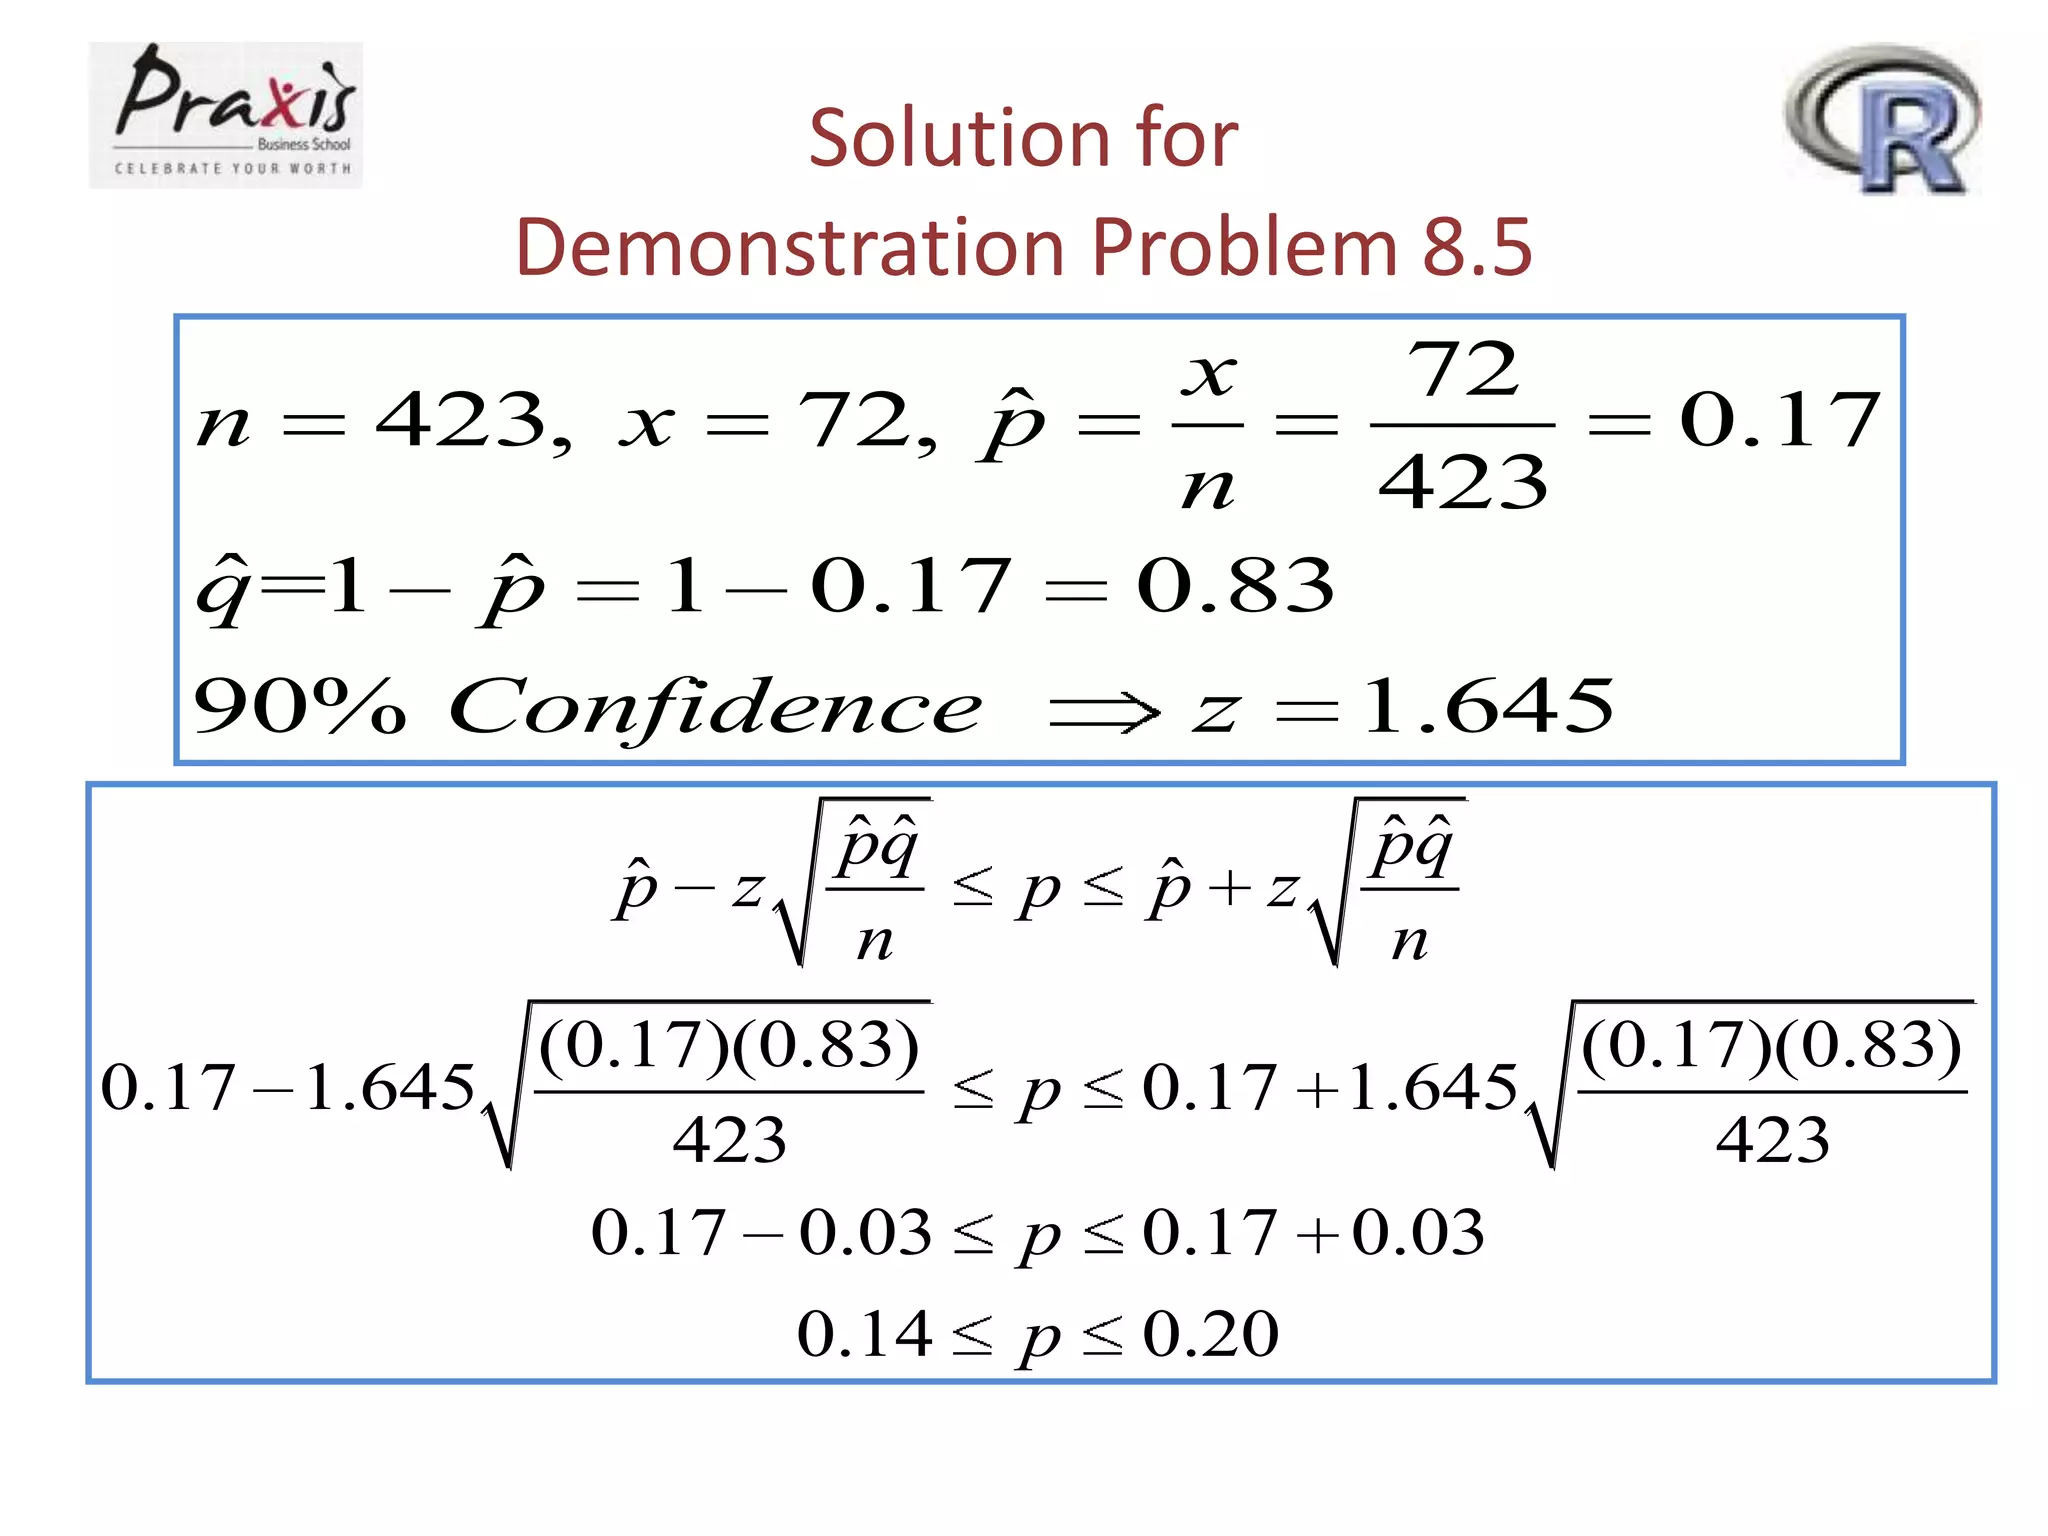
Demonstration Problem 8.5
Aclothing company produces men’s jeans. The jeans
are made and sold with either a regular cut or a boot
cut. In an effort to estimate the proportion of their
men’s jeans market in Oklahoma City that prefers
boot-cut jeans, the analyst takes a random sample
of 423 jeans sales from the company’s two Oklahoma
City retail outlets. Only 72 of the sales were for
boot-cut jeans. Construct a 90% confidence interval to
estimate the proportion of the population in
Oklahoma City who prefer boot-cut jeans.
29.
Solution for
Demonstration Problem8.5
n
ˆ
72, p
423, x
ˆ
ˆ
q =1 p 1 0.17
90% Confidence
ˆ
p
z
ˆˆ
pq
n
(0.17)(0.83)
0.17 1.645
423
0.17 0.03
0.14
p
p
p
p
x
72
0.17
n
423
0.83
z 1.645
ˆ
p
z
ˆˆ
pq
n
(0.17)(0.83)
0.17 1.645
423
0.17 0.03
0.20
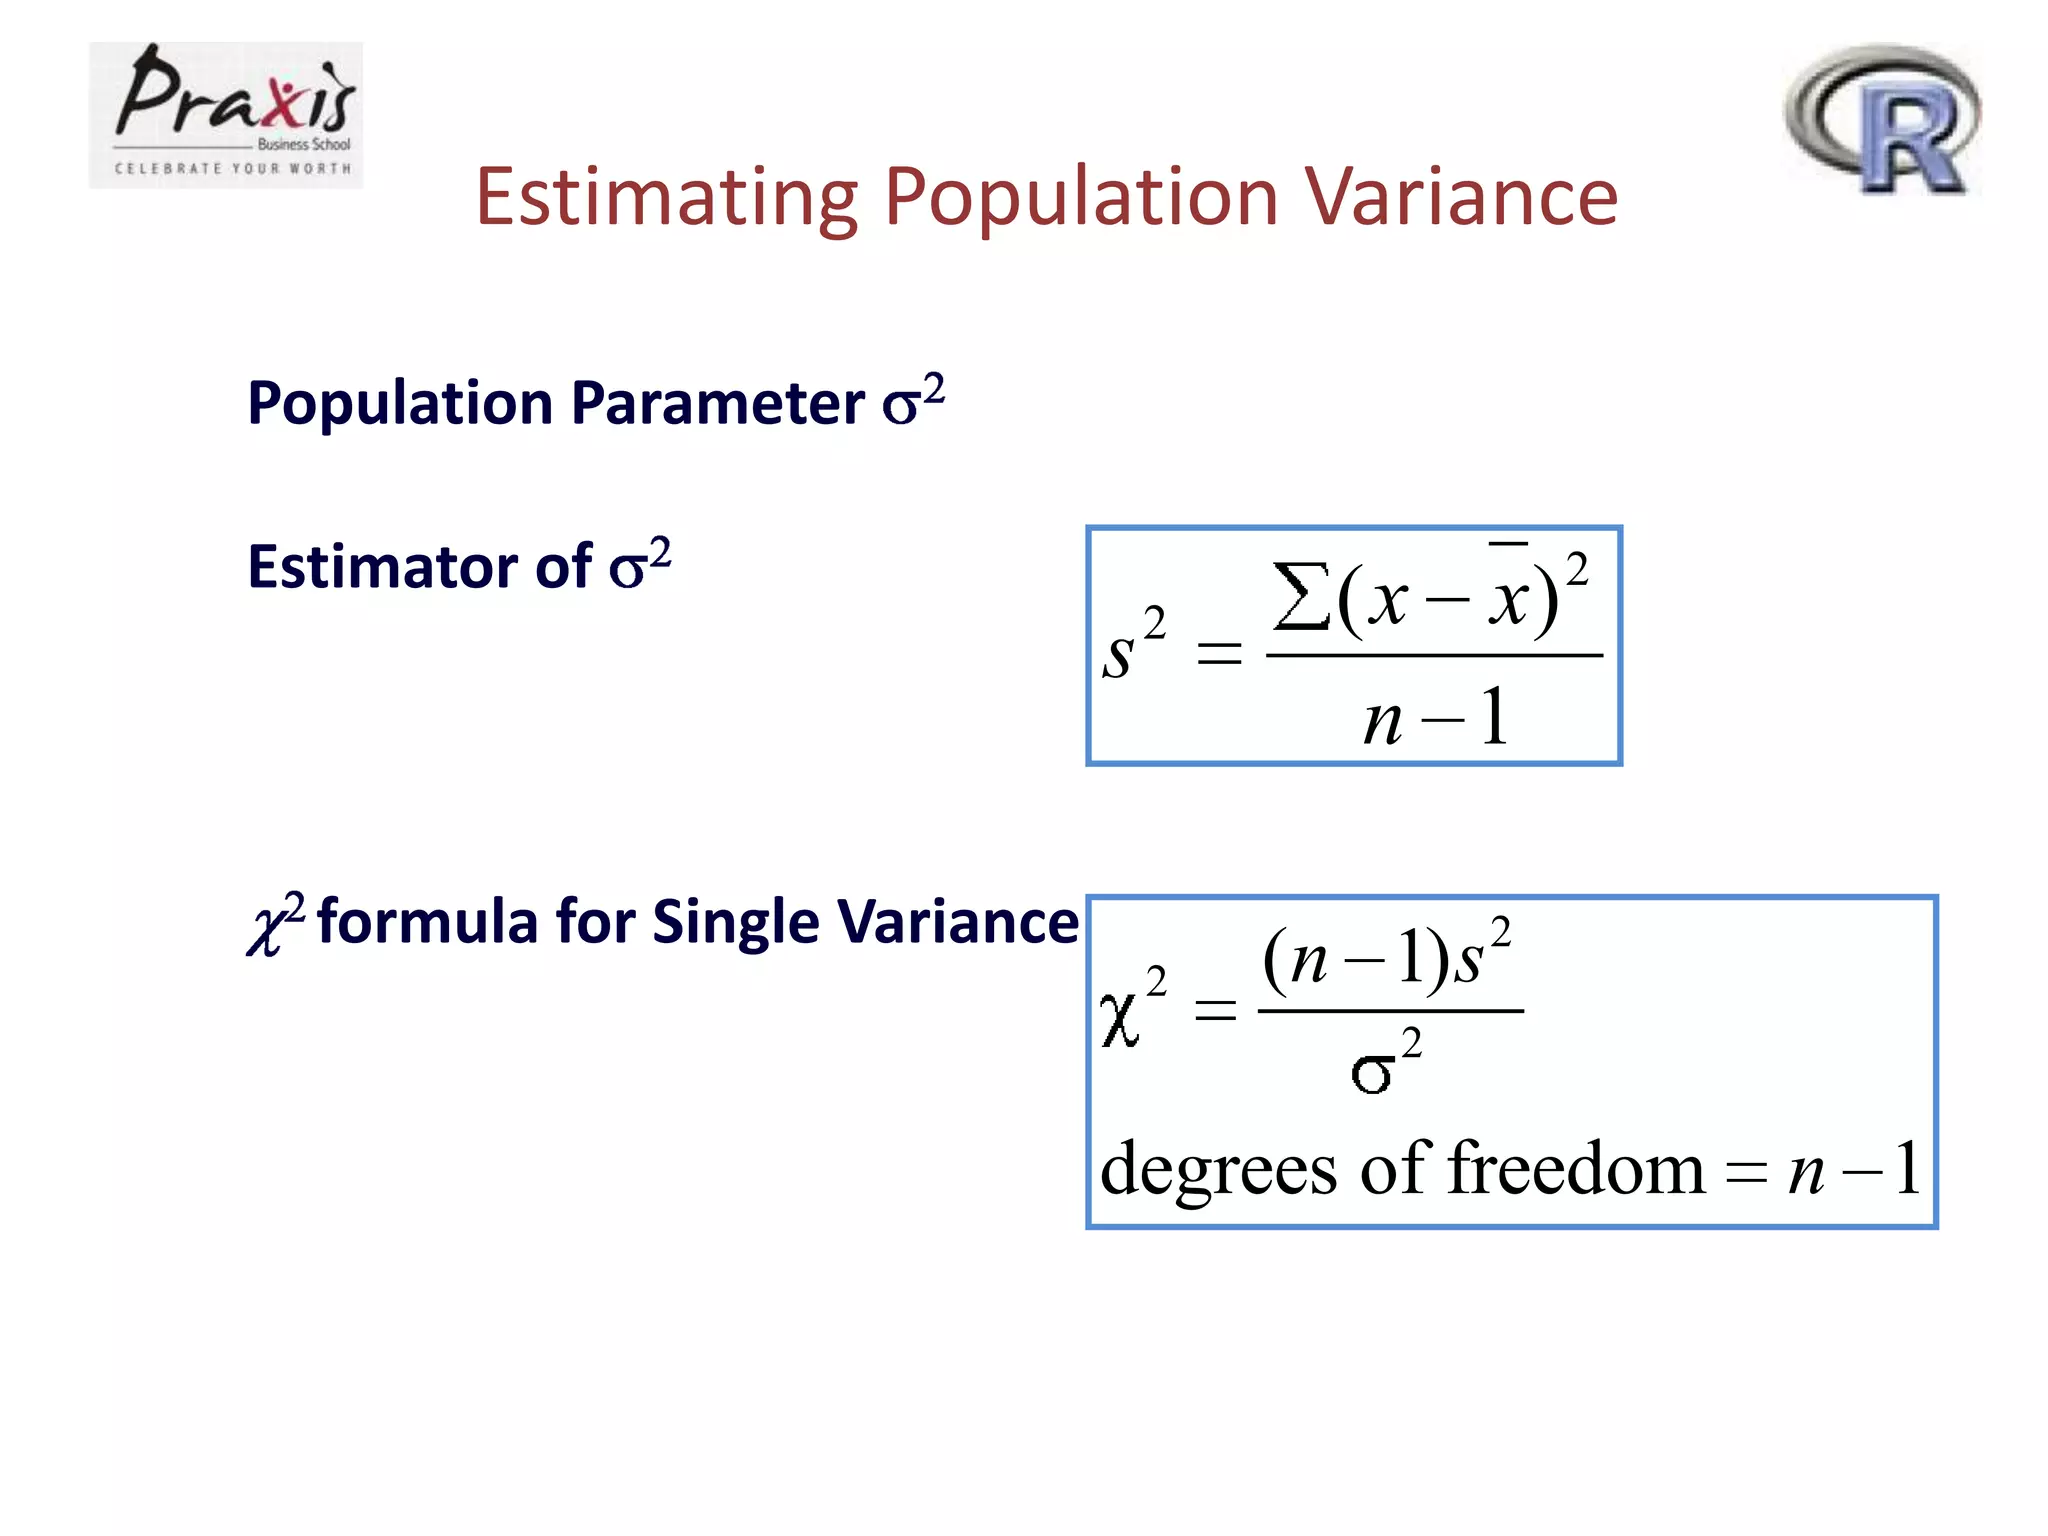
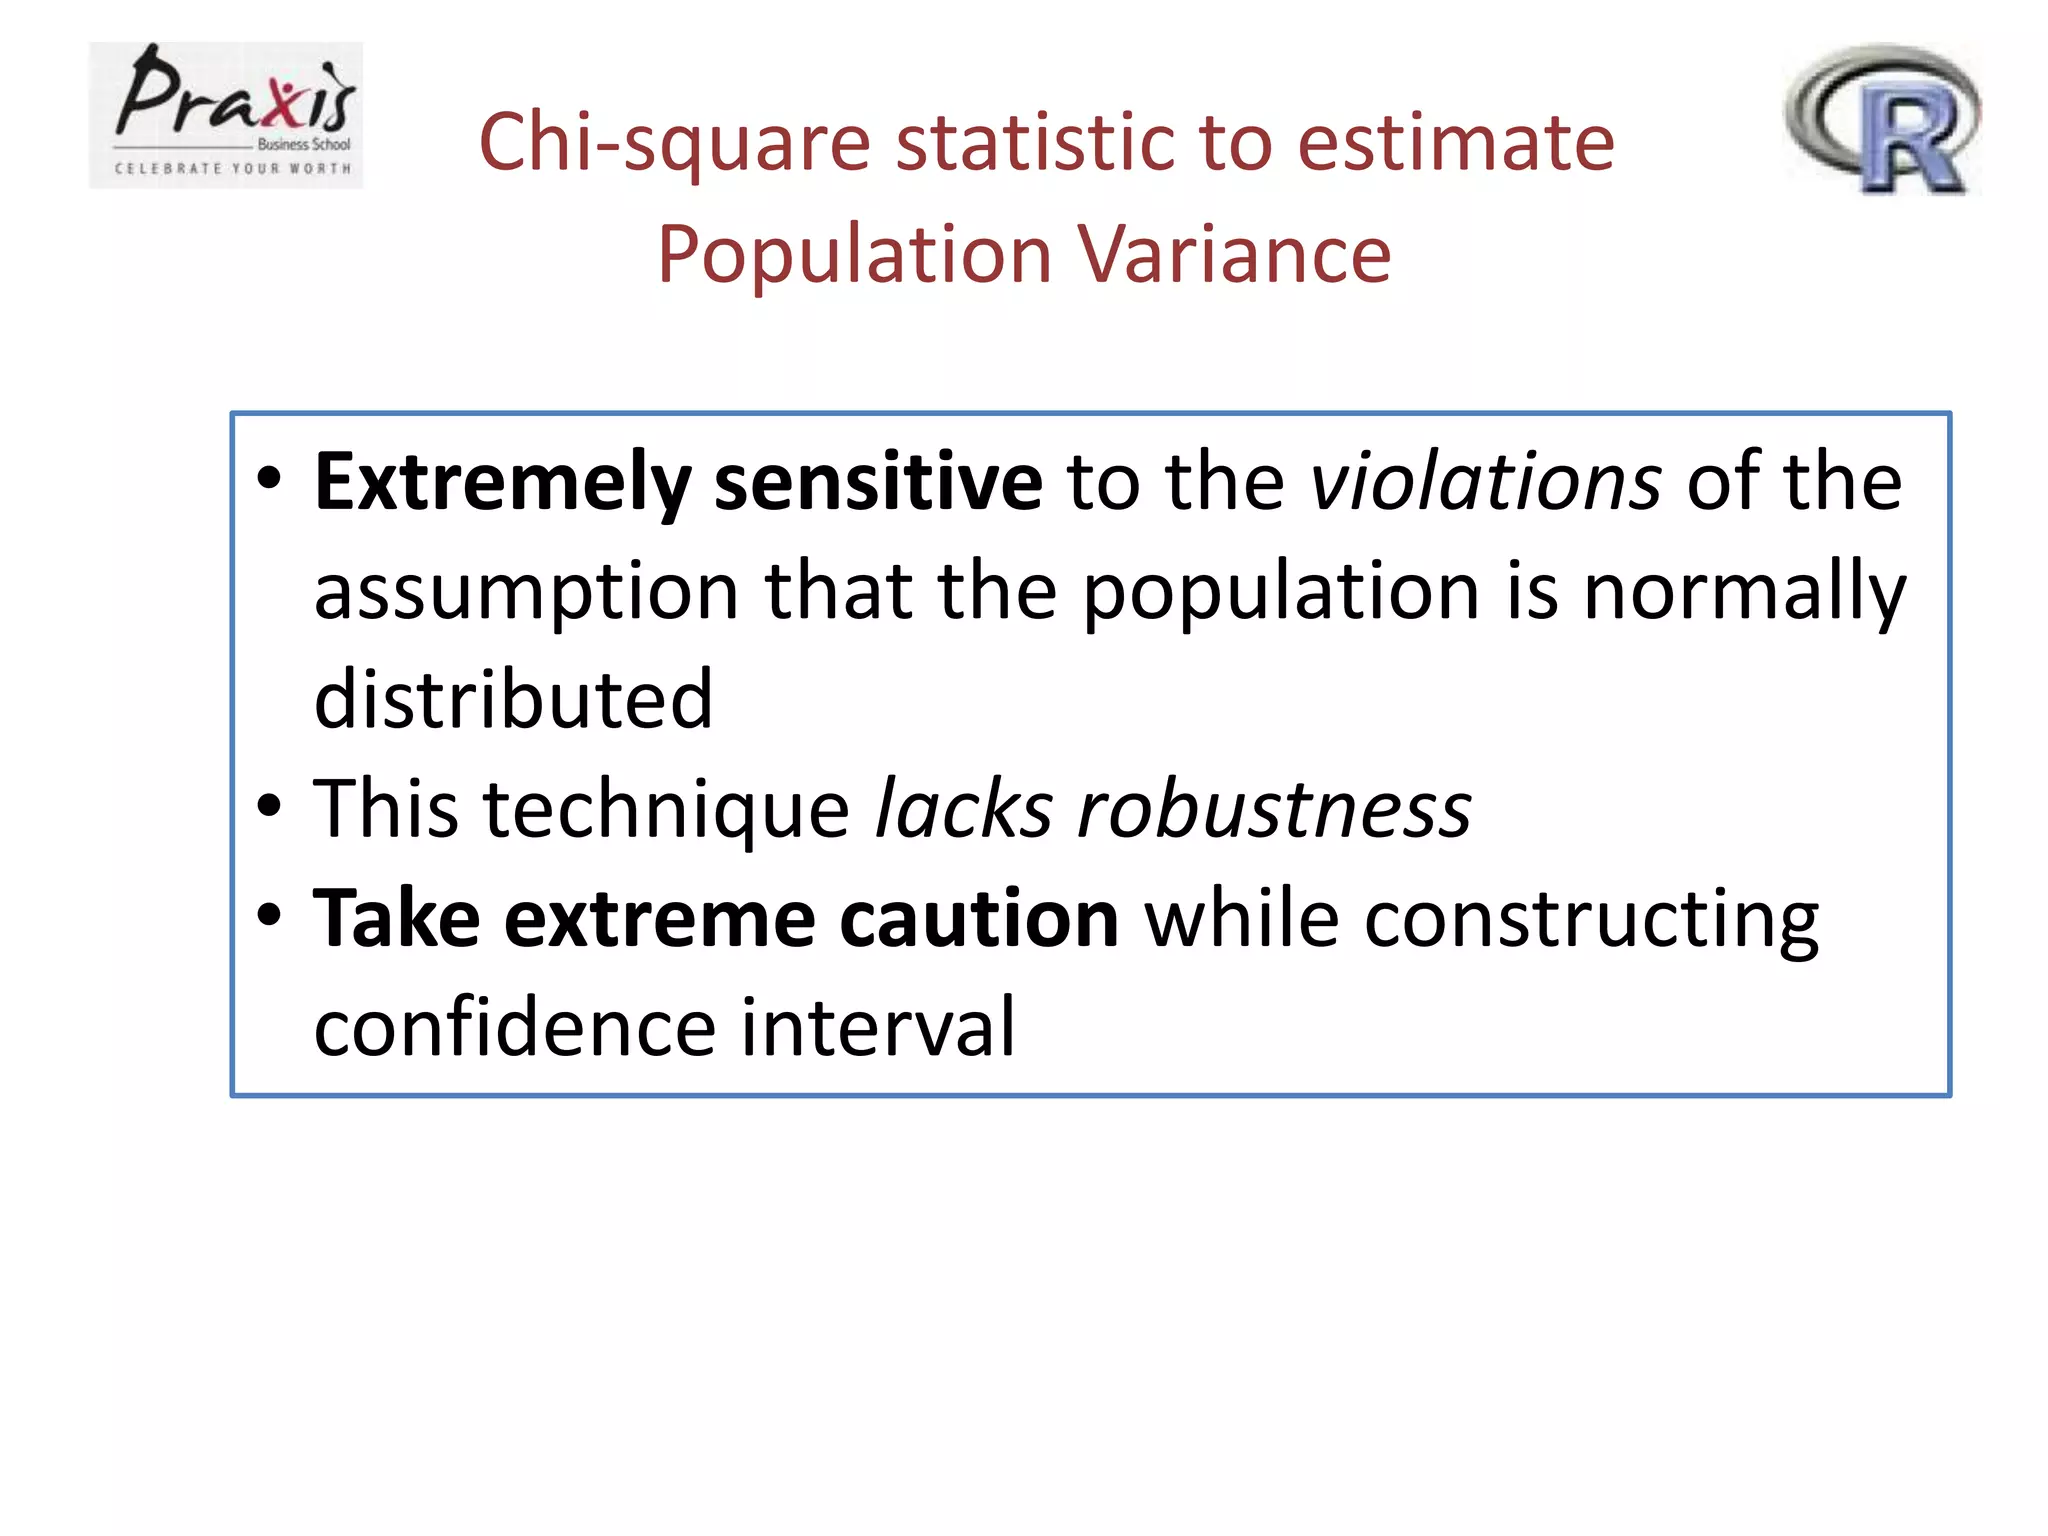
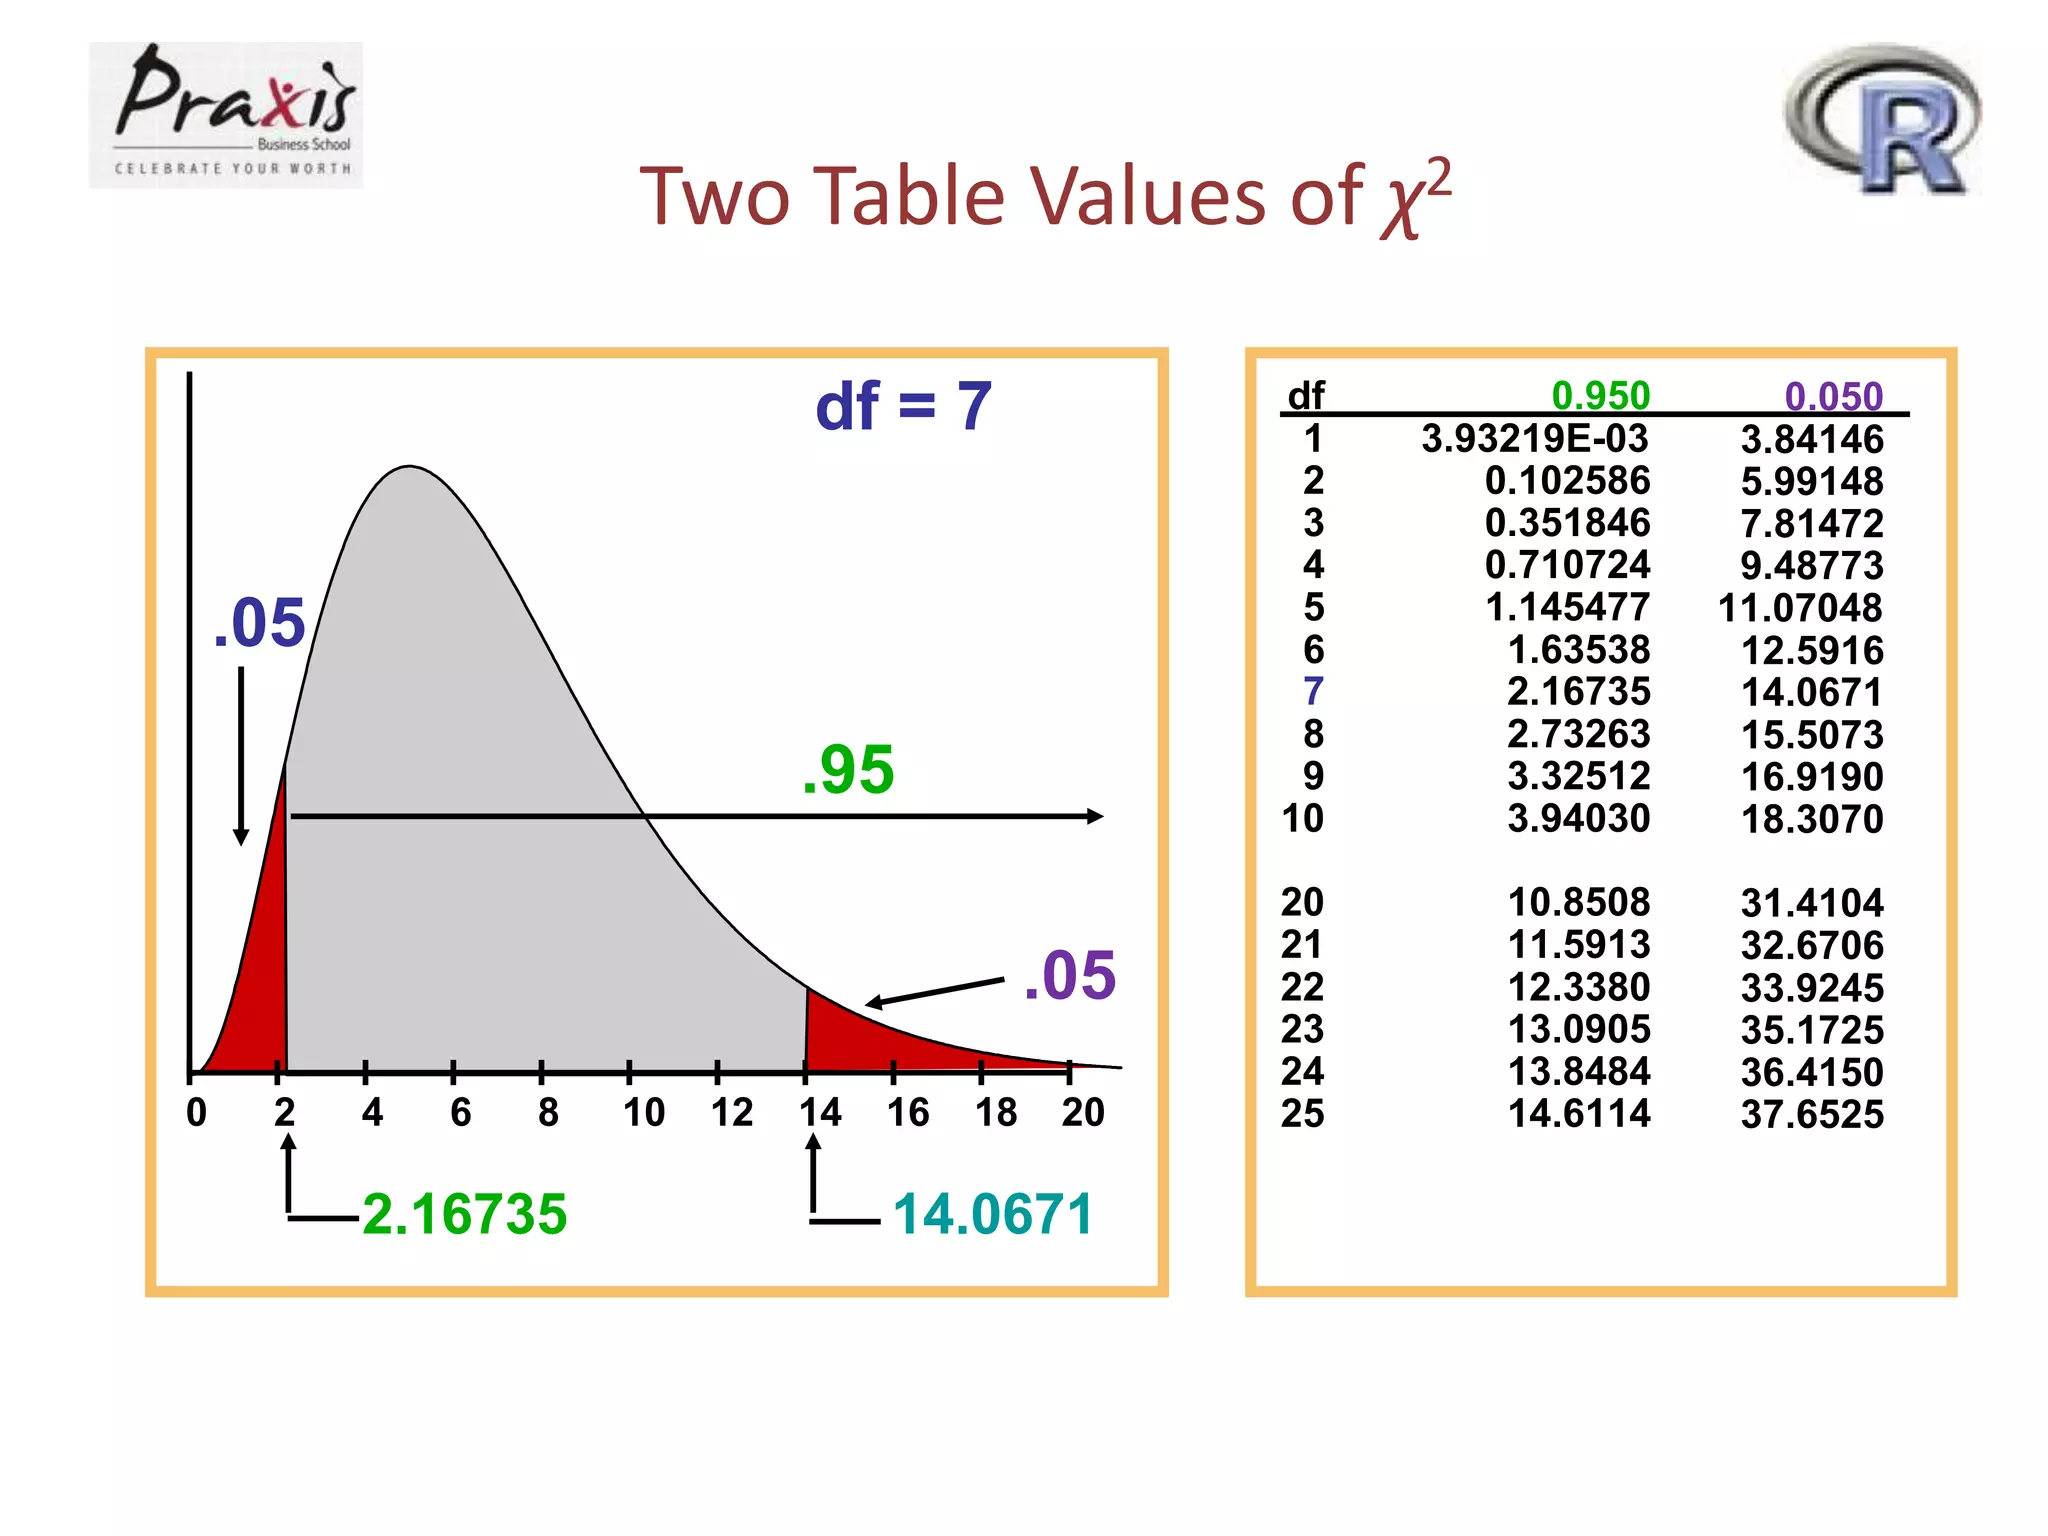
Chi-square statistic toestimate
Population Variance
• Extremely sensitive to the violations of the
assumption that the population is normally
distributed
• This technique lacks robustness
• Take extreme caution while constructing
confidence interval