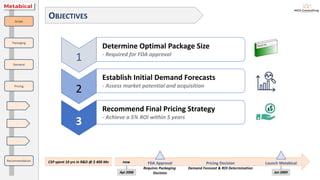
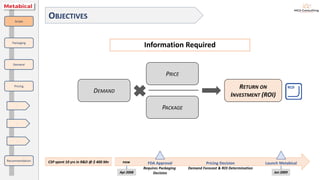
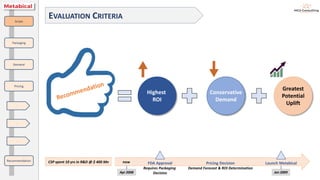
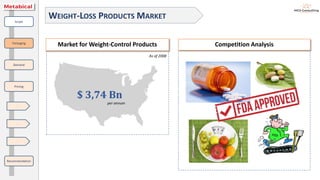
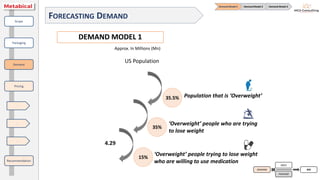
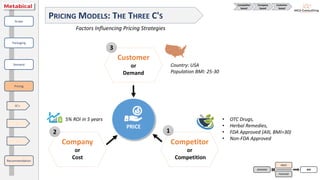
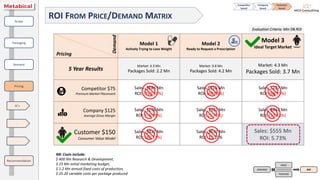
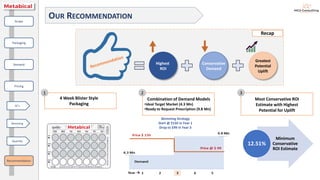
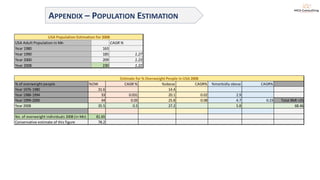
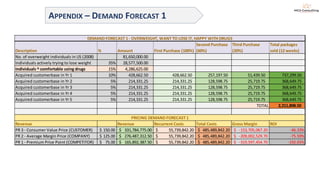
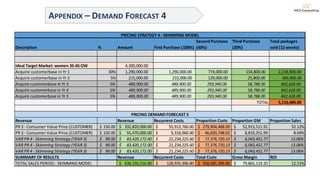
SlideShare a Scribd company logo
Pricing, Packaging and Demand Forecasting
for a New Weight-Loss Drug
CSP’s Market Share Opportunity
New
Product
Opportunity
0 %
Increased
Market
Share
?? %
IDENTIFIED MARKET OPPORTUNITYScope
Packaging
Demand
Pricing
Recommendation
-
-
-
$ 3,74 Bn
per annum
Market for Weight-Control Products
As of 2008
• > 65% of 230 Mn (~158 Mn) adult American population is considered overweight,
obese or severely obese
• CSP’s identified market segment: ~81.65 Mn (35.5%) overweight Americans
TARGETING IDENTIFIED MARKET SEGMENTScope
Packaging
Demand
Pricing
Recommendation
-
-
-
51.5
61.05
71.06
81.65
23.47
39.04
53.92
62.51
5.37
9.82
13.27
1980 1990 2000 2008
Overview of Overweight, Obese, & Severely Obese Population (Mn) in USA
Overweight
(BMI 25-30)*
Obese
(BMI 30-40)*
Severely Obese
(BMI >40)*
Population Index
2008
PRODUCT DESCRIPTION - METABICAL
First ‘Food & Drug
Administration (FDA)’
approved prescription
drug for overweight
population
To be launched by
Cambridge Science
Pharmaceuticals (CSP)
after 10 years in RnD
To be launched in
North American market
within 9 months –
by January 2009
Clinically proven
weight-loss
drugs targeted at
overweight adults
(BMI 25-30)
Strong endorsement by
medical community
-> survey respondents
show curiosity
Scope
Packaging
Demand
Pricing
Recommendation
-
-
-
12-week treatment
plan - to consume one
pill at same time
everyday
OBJECTIVESScope
Packaging
Demand
Pricing
Recommendation
-
-
-
CSP spent 10 yrs in R&D @ $ 400 Mn FDA Approval
Requires Packaging
Decision
Launch Metabical
Apr 2008 Jan 2009
now Pricing Decision
Demand Forecast & ROI Determination
Determine Optimal Package Size
- Required for FDA approval
Recommend Final Pricing Strategy
- Achieve a 5% ROI within 5 years
Establish Initial Demand Forecasts
- Assess market potential and acquisition
1
2
3
Information Required
OBJECTIVES
RETURN ON
INVESTMENT (ROI)
DEMAND
PACKAGE
PRICE
Scope
Packaging
Demand
Pricing
Recommendation
-
-
-
CSP spent 10 yrs in R&D @ $ 400 Mn FDA Approval
Requires Packaging
Decision
Launch Metabical
Apr 2008 Jan 2009
now Pricing Decision
Demand Forecast & ROI Determination
EVALUATION CRITERIAScope
Packaging
Demand
Pricing
Recommendation
-
-
-
CSP spent 10 yrs in R&D @ $ 400 Mn FDA Approval
Requires Packaging
Decision
Launch Metabical
Apr 2008 Jan 2009
now Pricing Decision
Demand Forecast & ROI Determination
Conservative
Demand
Highest
ROI
Greatest
Potential
Uplift
WEIGHT-LOSS PRODUCTS MARKET
Scope
Packaging
Demand
Pricing
Recommendation
-
-
-
$ 3,74 Bn
per annum
Market for Weight-Control Products
As of 2008
Competition Analysis
Days of the
Week
Blister
Style
Insurance
Implications
No
Subsidies
Package Size 12 Weeks 4 Weeks
PACKAGING
Scope
Packaging
Demand
Pricing
Recommendation
-
-
-
ROIDEMAND
PACKAGE
PRICE
DEMAND MODEL 1
FORECASTING DEMANDScope
Packaging
Demand
Pricing
Recommendation
-
-
-
Demand Model 1 Demand Model 2 Demand Model 3
ROIDEMAND
PACKAGE
PRICE
Approx. In Millions (Mn)
4.29
Population that is ‘Overweight’
‘Overweight’ people who are trying
to lose weight
‘Overweight’ people trying to lose weight
who are willing to use medication
US Population
35.5%
35%
15%
DEMAND MODEL 2
FORECASTING DEMANDScope
Packaging
Demand
Pricing
Recommendation
-
-
-
Demand Model 1 Demand Model 2 Demand Model 3
ROIDEMAND
PACKAGE
PRICE
Approx. In Millions (Mn)
9.8
Population that is ‘Overweight’
‘Overweight’ people who would seek an
appointment if a prescription drug were
available
US Population
35.5%
12%
Market Description Market Potential
Demand Scenario 1
‘Overweight’ people trying to lose weight who
are willing to use medication to help
4.29 million
Recap
DEMAND MODEL 3
FORECASTING DEMANDScope
Packaging
Demand
Pricing
Recommendation
-
-
-
Demand Model 1 Demand Model 2 Demand Model 3
ROIDEMAND
PACKAGE
PRICE
Approx. In Millions (Mn)
4.3
CSP Research determined population size of
ideal target market: overweight females,
age 35-65, college educated, health-
conscious & visited the doctor more often
US Population
35.5%
Market Description Market Potential
Demand Scenario 1
‘Overweight’ people trying to lose weight who
are willing to use medication to help
4.29 million
Demand Scenario 2
‘Overweight’ people who would seek an
appointment if a prescription drug were available
9.8 million
Recap
FORECASTING DEMAND: SNAPSHOTScope
Packaging
Demand
Pricing
Recommendation
-
-
-
Demand Model 1 Demand Model 2 Demand Model 3
ROIDEMAND
PACKAGE
PRICE
Market Description Market Potential
Demand Scenario 1
‘Overweight’ people trying to lose weight who are willing
to use medication to help
4.29 million
Demand Scenario 2
‘Overweight’ people who would seek an appointment if a
prescription drug were available
9.8 million
Demand Scenario 3
CSP Research determined population size of ideal target
market: overweight females, age 35-65, college educated,
health-conscious & visited the doctor more often
4.3 million
PRICING MODELSScope
Packaging
Demand
Pricing
Recommendation
-
-
-
ROIDEMAND
PACKAGE
PRICE
Recall
Packaging
Demand
Price
Modelling
5% ROI within 5 years
Factors Influencing Pricing Strategies
PRICING MODELS: THE THREE C'SScope
Packaging
Demand
Pricing
Recommendation
3C’s
-
-
ROIDEMAND
PACKAGE
PRICE
PRICE
Competitor
or
Competition
1
3
Customer
or
Demand
2
Company
or
Cost
5% ROI in 5 years
Country: USA
Population BMI: 25-30
• OTC Drugs,
• Herbal Remedies,
• FDA Approved (Alli, BMI>30)
• Non-FDA Approved
Competitor
based
Company
based
Customer
based
Factors Influencing Pricing Strategies
PRICING MODELS: THE THREE C'S
$75
Scope
Packaging
Demand
Pricing
Recommendation
3C’s
-
-
ROIDEMAND
PACKAGE
PRICE
Competition
1
3
Demand-based
2
Cost-based OTC Weight-loss
Drugs: $63-$100
Premium** Benchmark to Direct Competition
Alli – Cost Per 28 Days (4 weeks) * $ 48.72
Metabical – Proposed Price 28 Days (4 weeks) $ 75
Gross Margin (%) > 50 %
Competitor
based
Company
based
Customer
based
Competition-based Strategy
* Alli – closest comparable (non-prescription) drug
** FDA approved prescription strength medication
Factors Influencing Pricing Strategies
PRICING MODELS: THE THREE C'S
$125
Scope
Packaging
Demand
Pricing
Recommendation
3C’s
-
-
ROIDEMAND
PACKAGE
PRICE
Competition
1
3
Demand-based
2
Cost-based
Competitor
based
Company
based
Customer
based
CSP’s avg. Gross
Margin = 70%
Benchmark to CSP’s other Drug Margins
Other Drug Gross Margins ~ 70 %
Metabical – Proposed Price 28 Days (4 weeks) $ 125
Cost-based Strategy
Factors Influencing Pricing Strategies
PRICING MODELS: THE THREE C'S
$150
Scope
Packaging
Demand
Pricing
Recommendation
3C’s
-
-
ROIDEMAND
PACKAGE
PRICE
Competition
1
3
Demand-based
2
Cost-based
Ideal Target Customer
value offer
Competitor
based
Company
based
Customer
based
Benchmark to Value delivered to Customers
Overweight Individuals Additional Annual
Out-of-Pocket Expenses on Healthcare *
$ 450
Metabical – Proposed Price 28 Days (4 weeks) $ 150
Metabical’s Complete 12-week Treatment $ 450
Demand-based Strategy
* CSP’s Research (Outcomes Research Group)
ROI FROM PRICE/DEMAND MATRIXScope
Packaging
Demand
Pricing
Recommendation
3C’s
-
-
Competitor
based
Company
based
Customer
based
Model 1
Actively Trying to Lose
Weight
Model 2
Ready to Request a
Prescription
Model 3
Ideal Target Market
Initial Market 4.3 million 9.8 million 4.3 million
Market
Acquisition*
First Year: 10%
Years 2,3,4,5: 5%
Total @ Year 5: 30%
First Year: 30%
Years 2,3,4,5: 5%
Total @ Year 5: 50%
Repurchasing
Behaviour**
First 4 weeks: 100%
Second 4 Weeks: 60%
Third 4 Weeks: 12%
Total Sales 2.2 million packages 4.2 million packages 3.7 million packages
Demand
Pricing
ROIDEMAND
PACKAGE
PRICE
* Penetration estimates are based on CSP historical experience. Customers are conservatively
assumed not to "repeat" a treatment subscription within the five year period.
** Based on data from test trials during R&D phase
ROI FROM PRICE/DEMAND MATRIX
NB: Costs include:
$ 400 Mn Research & Development,
$ 23 Mn initial marketing budget,
$ 1.2 Mn annual fixed costs of production,
$ 25.20 variable costs per package produced
Scope
Packaging
Demand
Pricing
Recommendation
3C’s
-
-
Competitor
based
Company
based
Customer
based
ROIDEMAND
PACKAGE
PRICE
Model 1
Actively Trying to Lose
Weight
Model 2
Ready to Request a
Prescription
Model 3
Ideal Target Market
5 Year Results
Market: 4.3 Mn
Packages Sold: 2.2 Mn
Market: 9.8 Mn
Packages Sold: 4.2 Mn
Market: 4.3 Mn
Packages Sold: 3.7 Mn
Competitor $75
Premium Market Placement
Sales: $166 Mn
ROI: (192.65%)
Sales $316 Mn
ROI: (69.60%)
Sales: $227 Mn
ROI: (88.55%)
Company $125
Average Gross Margin
Sales: $276 Mn
ROI: (75.59%)
Sales: $527 Mn
ROI: (1.76%)
Sales: $462 Mn
ROI: (13.13%)
Customer $150
Consumer Value Model
Sales: $332 Mn
ROI: (46.33%)
Sales: $632 Mn
ROI: 15.20%
Sales: $555 Mn
ROI: 5.73%
Demand
Pricing
Evaluation Criteria: Min 5% ROI
ROI FROM PRICE/DEMAND MATRIX
NB: Costs include:
$ 400 Mn Research & Development,
$ 23 Mn initial marketing budget,
$ 1.2 Mn annual fixed costs of production,
$ 25.20 variable costs per package produced
Scope
Packaging
Demand
Pricing
Recommendation
3C’s
-
-
Competitor
based
Company
based
Customer
based
ROIDEMAND
PACKAGE
PRICE
Model 1
Actively Trying to Lose Weight
Model 2
Ready to Request a Prescription
Model 3
Ideal Target Market
5 Year Results
Market: 4.3 Mn
Packages Sold: 2.2 Mn
Market: 9.8 Mn
Packages Sold: 4.2 Mn
Market: 4.3 Mn
Packages Sold: 3.7 Mn
Competitor $75
Premium Market Placement
Sales: $166 Mn
ROI: (192.65%)
Sales $316 Mn
ROI: (69.60%)
Sales: $227 Mn
ROI: (88.55%)
Company $125
Average Gross Margin
Sales: $276 Mn
ROI: (75.59%)
Sales: $527 Mn
ROI: (1.76%)
Sales: $462 Mn
ROI: (13.13%)
Customer $150
Consumer Value Model
Sales: $332 Mn
ROI: (46.33%)
Sales: $632 Mn
ROI: 15.20%
Sales: $555 Mn
ROI: 5.73%
Demand
Pricing
Evaluation Criteria: Min 5% ROI
Customer
based
Skimming
Strategy
-
PRICING MODELS: SKIMMING STRATEGYScope
Packaging
Demand
Pricing
Recommendation
3C’s
Skimming
-
ROIDEMAND
PACKAGE
PRICE
Leverage on the
buyers’ willingness
to pay
PRICING MODELS: SKIMMING STRATEGY
Year 1 Price $150
Market
4.3 Mn
Penetration
30%
Year 2 Price $150
Market
4.3 Mn
Penetration
5%
Year
3-5
Drop price
to $99
Market
9.8 Mn
Penetration
5%
Scope
Packaging
Demand
Pricing
Recommendation
3C’s
Skimming
-
Customer
based
Skimming
Strategy
-
ROIDEMAND
PACKAGE
PRICE
Skimming Strategy
PRICING MODELS: SKIMMING STRATEGY
Skimming
Revenue
Base Model
Revenue
Scope
Packaging
Demand
Pricing
Recommendation
3C’s
Skimming
-
Customer
based
Skimming
Strategy
-
ROIDEMAND
PACKAGE
PRICE
Determine ROI
Skimming Model
12.51%
Base Model
5.73%
PRICING MODELS: QUANTITY STRATEGYScope
Packaging
Demand
Pricing
Recommendation
3C’s
Skimming
Quantity
Customer
based
Skimming
Strategy
Quantity
Differentiator
ROIDEMAND
PACKAGE
PRICE
Price
Differentiation
Demographic
Geographical
Temporal
Benefit-based
Quantity-based
Bundling
What is Quantity-based Price Differentiation?
Offer identical or similar products to different
customers or segments at different prices
• The avg. price per unit varies depending on
the quantity purchased
– i.e., customers benefit from volume discounts
• Customer loyalty is directly proportional to the
discounts offered
PRICING MODELS: QUANTITY STRATEGY
Third
Month
(12%)
Second
Month
(60%)
First
Month
(100%)
Buys Starter
Pack $150
Buys Double
Pack $225
Buys Single
Pack $150
Buys Single
Pack $150
%? %?
Scope
Packaging
Demand
Pricing
Recommendation
3C’s
Skimming
Quantity
Customer
based
Skimming
Strategy
Quantity
Differentiator
ROIDEMAND
PACKAGE
PRICE
To Model Impact on ROI
Uptake of
Quantity Offer
Year 1 Price $150
Market
4.3 Mn
Penetration
30%
Year 2-5 Price $150
Market
4.3 Mn
Penetration
5%
(each year)
ROI 5.73% over
5years
Quantity Strategy
Recall Repeat Purchase Behaviour Model
PRICING MODELS: QUANTITY STRATEGYScope
Packaging
Demand
Pricing
Recommendation
3C’s
Skimming
Quantity
Customer
based
Skimming
Strategy
Quantity
Differentiator
ROIDEMAND
PACKAGE
PRICE
Determine ROI
Max. Uptake
10.41%
No Uptake
5.73%
ROI FROM PRICE/DEMAND MATRIXScope
Packaging
Demand
Pricing
Recommendation
3C’s
Skimming
Quantity
Customer
based
Skimming
Strategy
Quantity
Differentiator
ROIDEMAND
PACKAGE
PRICEEvaluation
Criteria
Conservative
Model
Highest ROI
Greatest Uplift
Potential
Model 3
Ideal Target Market
Skimming
Strategy
Quantity
Differentiation Strategy
5 Year Results
Initial Market: 4.3 Mn
Packages Sold: 3.7 Mn Packages Sold: 5.1 Mn Packages Sold: 3.8-4.5 Mn
Market Penetration
Strategy
Ideal Target Market
Reduce Price in Year 3
to attract additional
customers "ready to request a
prescription"
Offer Qty Discount
to capture greater repeat
purchases
Price per 4-week Pack:
$150
Consumer Value Model
ROI: 5.73% ROI: 12.51% ROI: 5.73-10.41%
Demand
Pricing
ROI FROM PRICE/DEMAND MATRIXScope
Packaging
Demand
Pricing
Recommendation
3C’s
Skimming
Quantity
ROIDEMAND
PACKAGE
PRICEEvaluation
Criteria
Conservative
Model
Highest ROI
Greatest Uplift
Potential
Model 3
Ideal Target Market
Skimming
Strategy
Quantity
Differentiation Strategy
5 Year Results
Initial Market: 4.3 Mn
Packages Sold: 3.7 Mn Packages Sold: 5.1 Mn Packages Sold: 3.8-4.5 Mn
Market Penetration
Strategy
Ideal Target Market
Reduce Price in Year 3
to attract additional
customers "ready to request
a prescription"
Offer Qty Discount
to capture greater repeat purchases
Price per 4-week Pack:
$150
Consumer Value Model
ROI: 5.73% ROI: 12.51% ROI: 5.73-10.41%
Demand
Pricing
Customer
based
Skimming
Strategy
Quantity
Differentiator
OUR RECOMMENDATION
Minimum
Conservative
ROI Estimate
12.51%
Combination of Demand Models
•Ideal Target Market (4.3 Mn)
•Ready to Request Prescription (9.8 Mn)
4 Week Blister Style
Packaging
Most Conservative ROI
Estimate with Highest
Potential for Uplift
Scope
Packaging
Demand
Pricing
Recommendation
3C’s
Skimming
Quantity
Conservative
Demand
Highest
ROI
Greatest
Potential
Uplift
Skimming Strategy
Start @ $150 in Year 1
Drop to $99 in Year 3
1 2 3
Recap
Pricing, Packaging and Demand
Forecasting for a New Weight-Loss Drug
APPENDIX – SURVEY RESULTS
Sample (Men & Women) 2000 100.00%
Not satisfied with current weight 1400 70.00%
Actively trying to lose weight 700 35.00%
Comfortable using weightloss drugs 105 5.25%
Seek prescription from healthcare provider 240 12.00%
CSP Survey Results
APPENDIX – POPULATION ESTIMATION
USA Adult Population in Mn CAGR %
Year 1980 163
Year 1990 185 1.27
Year 2000 209 1.23
Year 2008 230 1.22
USA Population Estimation for 2008
% of overweight people %OW CAGR % %obese CAGR% %morbidly obese CAGR%
Year 1976-1980 31.6 14.4
Year 1988-1994 33 0.031 20.1 0.02 2.9
Year 1999-2000 34 0.05 25.8 0.08 4.7 0.23 Total BMI >25
Year 2008 35.5 0.5 27.2 5.8 68.46
No. of overweight individuals 2008 (in Mn) 81.65
Conservative estimate of this figure 78.2
Estimate for % Overweight People in USA 2008
APPENDIX – DEMAND FORECAST 1
Description % Amount First Purchase (100%)
Second Purchase
(60%)
Third Purchase
(20%)
Total packages
sold (12 weeks)
No. of overweight individuals in US (2008) 81,650,000.00
Individuals actively trying to lose weight 35% 28,577,500.00
Individuals ^ comfortable using drugs 15% 4,286,625.00
Acquired customerbase in Yr 1 10% 428,662.50 428,662.50 257,197.50 51,439.50 737,299.50
Acquired customerbase in Yr 2 5% 214,331.25 214,331.25 128,598.75 25,719.75 368,649.75
Acquired customerbase in Yr 3 5% 214,331.25 214,331.25 128,598.75 25,719.75 368,649.75
Acquired customerbase in Yr 4 5% 214,331.25 214,331.25 128,598.75 25,719.75 368,649.75
Acquired customerbase in Yr 5 5% 214,331.25 214,331.25 128,598.75 25,719.75 368,649.75
TOTAL 2,211,898.50
Revenue Revenue Recurrent Costs Total Costs Gross Margin ROI
PR 3 - Consumer Value Price (CUSTOMER) 150.00$ 331,784,775.00$ 55,739,842.20$ 485,489,842.20$ -153,705,067.20$ -46.33%
PR 2 - Average Margin Price (COMPANY) 125.00$ 276,487,312.50$ 55,739,842.20$ 485,489,842.20$ -209,002,529.70$ -75.59%
PR 1 - Premium Price Point (COMPETITOR) 75.00$ 165,892,387.50$ 55,739,842.20$ 485,489,842.20$ -319,597,454.70$ -192.65%
DEMAND FORECAST 1 - OVERWEIGHT, WANT TO LOSE IT, HAPPY WITH DRUGS
PRICING DEMAND FORECAST 1
APPENDIX – DEMAND FORECAST 2
Description % Amount First Purchase (100%)
Second Purchase
(60%)
Third Purchase
(20%)
Total packages
sold (12 weeks)
No. of overweight individuals in 2008 81,650,000.00
Respondents ready to seek prescription 12% 9,798,000.00
Acquire customerbase in Yr 1 10% 979,800.00 979,800.00 587,880.00 117,576.00 1,685,256.00
Acquire customerbase in Yr 2 5% 489,900.00 489,900.00 293,940.00 58,788.00 842,628.00
Acquire customerbase in Yr 3 5% 489,900.00 489,900.00 293,940.00 58,788.00 842,628.00
Acquire customerbase in Yr 4 5% 489,900.00 489,900.00 293,940.00 58,788.00 842,628.00
Acquire customerbase in Yr 5 5% 489,900.00 489,900.00 293,940.00 58,788.00 842,628.00
TOTAL 4,213,140.00
Revenue Revenue Recurrent Costs Total Costs Gross Margin ROI
PR 3 - Consumer Value Price (CUSTOMER) 150.00$ 631,971,000.00$ 106,171,128.00$ 535,921,128.00$ 96,049,872.00$ 15.20%
PR 2 - Average Margin Price (COMPANY) 125.00$ 526,642,500.00$ 106,171,128.00$ 535,921,128.00$ -9,278,628.00$ -1.76%
PR 1 - Premium Price Point (COMPETITOR) 75.00$ 315,985,500.00$ 106,171,128.00$ 535,921,128.00$ -219,935,628.00$ -69.60%
DEMAND FORECAST 2 - OVERWEIGHT, WOULD SEEK PRESCRIPTION
PRICING DEMAND FORECAST 2
APPENDIX – DEMAND FORECAST 3
Description % Amount First Purchase (100%)
Second Purchase
(60%)
Third Purchase
(20%)
Total packages
sold (12 weeks)
Ideal Target Market: women 35-65 OW 4,300,000.00
Acquire customerbase in Yr 1 30% 1,290,000.00 1,290,000.00 774,000.00 154,800.00 2,218,800.00
Acquire customerbase in Yr 2 5% 215,000.00 215,000.00 129,000.00 25,800.00 369,800.00
Acquire customerbase in Yr 3 5% 215,000.00 215,000.00 129,000.00 25,800.00 369,800.00
Acquire customerbase in Yr 4 5% 215,000.00 215,000.00 129,000.00 25,800.00 369,800.00
Acquire customerbase in Yr 5 5% 215,000.00 215,000.00 129,000.00 25,800.00 369,800.00
TOTAL 3,698,000.00
Revenue Revenue Recurrent Costs Total Costs Gross Margin ROI
PR 3 - Consumer Value Price (CUSTOMER) 150.00$ 554,700,000.00$ 93,189,600.00$ 522,939,600.00$ 31,760,400.00$ 5.73%
PR 2 - Average Margin Price (COMPANY) 125.00$ 462,250,000.00$ 93,189,600.00$ 522,939,600.00$ -60,689,600.00$ -13.13%
PR 1 - Premium Price Point (COMPETITOR) 75.00$ 277,350,000.00$ 93,189,600.00$ 522,939,600.00$ -245,589,600.00$ -88.55%
PRICING DEMAND FORECAST 3
DEMAND FORECAST 3 - IDEAL TARGET MARKET
APPENDIX – DEMAND FORECAST 4
Description % Amount First Purchase (100%)
Second Purchase
(60%)
Third Purchase
(20%)
Total packages
sold (12 weeks)
Ideal Target Market: women 35-65 OW 4,300,000.00
Acquire customerbase in Yr 1 30% 1,290,000.00 1,290,000.00 774,000.00 154,800.00 2,218,800.00
Acquire customerbase in Yr 2 5% 215,000.00 215,000.00 129,000.00 25,800.00 369,800.00
Acquire customerbase in Yr 3 5% 489,900.00 489,900.00 293,940.00 58,788.00 842,628.00
Acquire customerbase in Yr 4 5% 489,900.00 489,900.00 293,940.00 58,788.00 842,628.00
Acquire customerbase in Yr 5 5% 489,900.00 489,900.00 293,940.00 58,788.00 842,628.00
TOTAL 5,116,484.00
Revenue Revenue Recurrent Costs Proportion Costs Proportion GM Proportion Sales
PR 3 - Consumer Value Price (CUSTOMER) 150.00$ 332,820,000.00$ 55,913,760.00$ 279,904,488.09$ 52,915,511.91$ 52.12%
PR 3 - Consumer Value Price (CUSTOMER) 150.00$ 55,470,000.00$ 9,318,960.00$ 46,650,748.01$ 8,819,251.99$ 8.69%
VAR PR 4 - Skimming Strategy (YEAR 3) 99.00$ 83,420,172.00$ 21,234,225.60$ 77,376,720.23$ 6,043,451.77$ 13.06%
SUMMARY OF RESULTS Revenue Recurrent Costs Total Costs Gross Margin ROI
TOTAL SALES PERIOD - SKIMMING MODEL 638,550,516.00$ 128,935,396.80$ 558,685,396.80$ 79,865,119.20$ 12.51%
PRICING STRATEGY 4 - SKIMMING MODEL
PRICING DEMAND FORECAST 3
APPENDIX – DEMAND FORECAST 5
Description % Amount Buy pack 1 (100%) Buy pack 2&3 Buy pack 2 only Buy pack 3 (20%) TOTAL Doubles TOTAL Singles
VAR: Uptake VAR: Uptake
Ideal Target Market: women 35-65 OW 4,300,000.00 50.00% 10.00%
Acquire customerbase in Yr 1 30% 1,290,000.00 1,290,000.00 645,000.00 129,000.00 25,800.00 645,000.00 1,444,800.00
Acquire customerbase in Yr 2 5% 215,000.00 215,000.00 107,500.00 21,500.00 4,300.00 107,500.00 240,800.00
Acquire customerbase in Yr 3 5% 215,000.00 215,000.00 107,500.00 21,500.00 4,300.00 107,500.00 240,800.00
Acquire customerbase in Yr 4 5% 215,000.00 215,000.00 107,500.00 21,500.00 4,300.00 107,500.00 240,800.00
Acquire customerbase in Yr 5 5% 215,000.00 215,000.00 107,500.00 21,500.00 4,300.00 107,500.00 240,800.00
TOTAL 1,075,000.00 2,408,000.00
Revenue Revenue Recurrent Costs Proportion Costs Proportion GM Proportion Sales
TOTAL SALES PERIOD - SKIMMING MODEL 603,075,000.00$ 114,861,600.00$ 544,611,600.00$ 58,463,400.00$ 9.69%
PRICING STRATEGY 5 - QTY DIFFERENTIATION MODEL
PRICING DEMAND FORECAST 3
FIXED VARIABLE DESCRIPTION AMOUNT UNIT
PR 1 - Premium Price Point (COMPETITOR) 75.00$ per package
PR 2 - Average Margin Price (COMPANY) 125.00$ per package
PR 3 - Consumer Value Price (CUSTOMER) 150.00$ per package
VAR PR 4 - Skimming Strategy (YEAR 3) 99.00$ per package
VAR PR 5 - Qty Diff Strategy (DBL OFFER) 225.00$ per double package
Variable Costs 25.20$ per package
R&D Cost 400,000,000.00$ million sunk costs
Marketing Cost 23,000,000.00$ million total estimate
Fixed Annual Cost 1,350,000.00$ million per year
TOTAL COSTS (5yr) 429,750,000.00$ million over 5 yrs
APPENDIX – FIXED VARIABLE PRICING

More Related Content

What's hot

Virgin mobiles pricing for the very first time
Virgin mobiles  pricing for the very first timeVirgin mobiles  pricing for the very first time
Virgin mobiles pricing for the very first time
Swapnil Soni
 

What's hot (20)

Atlantic Computers: A Bundle of Pricing Options
Atlantic Computers: A Bundle of Pricing OptionsAtlantic Computers: A Bundle of Pricing Options
Atlantic Computers: A Bundle of Pricing Options
 
Crescent Pure Case Study Solution
Crescent Pure Case Study SolutionCrescent Pure Case Study Solution
Crescent Pure Case Study Solution
 
The Fashion Channel - A case Analysis
The Fashion Channel - A case AnalysisThe Fashion Channel - A case Analysis
The Fashion Channel - A case Analysis
 
Metabical Case Study Analysis
Metabical Case Study AnalysisMetabical Case Study Analysis
Metabical Case Study Analysis
 
The Fashion Channel
The Fashion ChannelThe Fashion Channel
The Fashion Channel
 
Cola Wars Continue: Coke and Pepsi in 2010
Cola Wars Continue: Coke and Pepsi in 2010Cola Wars Continue: Coke and Pepsi in 2010
Cola Wars Continue: Coke and Pepsi in 2010
 
Virgin mobiles pricing for the very first time
Virgin mobiles  pricing for the very first timeVirgin mobiles  pricing for the very first time
Virgin mobiles pricing for the very first time
 
Classic knitwear and Guardian: A Perfect Fit?
Classic knitwear and Guardian: A Perfect Fit?Classic knitwear and Guardian: A Perfect Fit?
Classic knitwear and Guardian: A Perfect Fit?
 
TruEarth Healthy Food
TruEarth Healthy FoodTruEarth Healthy Food
TruEarth Healthy Food
 
Metabical
MetabicalMetabical
Metabical
 
Metabical case study
Metabical case studyMetabical case study
Metabical case study
 
Culinarian Cookware case study analysis
Culinarian Cookware case study analysisCulinarian Cookware case study analysis
Culinarian Cookware case study analysis
 
ATLANTIC COMPUTER: A BUNDLE OF PRICING OPTIONS
ATLANTIC COMPUTER: A BUNDLE OF PRICING OPTIONS ATLANTIC COMPUTER: A BUNDLE OF PRICING OPTIONS
ATLANTIC COMPUTER: A BUNDLE OF PRICING OPTIONS
 
Case Study : Eco7-Launching a New Motor Oil
Case Study : Eco7-Launching a New Motor OilCase Study : Eco7-Launching a New Motor Oil
Case Study : Eco7-Launching a New Motor Oil
 
Clique Pens - Case Study Solution by Kamal Allazov (Essay type)
Clique Pens - Case Study Solution by Kamal Allazov (Essay type)Clique Pens - Case Study Solution by Kamal Allazov (Essay type)
Clique Pens - Case Study Solution by Kamal Allazov (Essay type)
 
Mountain dew
Mountain dewMountain dew
Mountain dew
 
Aqualisa Quartz - Simply A Better Shower (HBR Case Study)
Aqualisa Quartz - Simply A Better Shower (HBR Case Study)Aqualisa Quartz - Simply A Better Shower (HBR Case Study)
Aqualisa Quartz - Simply A Better Shower (HBR Case Study)
 
Mountain Man Brewing Company: Case Analysis
Mountain Man Brewing Company: Case AnalysisMountain Man Brewing Company: Case Analysis
Mountain Man Brewing Company: Case Analysis
 
Tru earth case study
Tru earth case studyTru earth case study
Tru earth case study
 
Showrooming at best buy
Showrooming at best buyShowrooming at best buy
Showrooming at best buy
 

Similar to Metabical - Marketing Case Study

J&j presentation athena
J&j presentation athenaJ&j presentation athena
J&j presentation athena
Bryan Griffith
 
Material in slides 2-14 of this overview adapted from Prin
Material in slides 2-14 of this overview adapted from PrinMaterial in slides 2-14 of this overview adapted from Prin
Material in slides 2-14 of this overview adapted from Prin
AbramMartino96
 
Material in slides 2-14 of this overview adapted from Prin
Material in slides 2-14 of this overview adapted from PrinMaterial in slides 2-14 of this overview adapted from Prin
Material in slides 2-14 of this overview adapted from Prin
AbramMartino96
 

Similar to Metabical - Marketing Case Study (20)

Launching Krispy Natural: Cracking the Product Management Code.
Launching Krispy Natural: Cracking the Product Management Code.Launching Krispy Natural: Cracking the Product Management Code.
Launching Krispy Natural: Cracking the Product Management Code.
 
Krispy Natural
Krispy NaturalKrispy Natural
Krispy Natural
 
Nature view farm_case_study
Nature view farm_case_studyNature view farm_case_study
Nature view farm_case_study
 
Nature view
Nature viewNature view
Nature view
 
Launching Krispy Natural: Cracking the Product Management Code
Launching Krispy Natural: Cracking the Product Management CodeLaunching Krispy Natural: Cracking the Product Management Code
Launching Krispy Natural: Cracking the Product Management Code
 
Krispy natural Case Study by Shivam Agarwal
Krispy natural Case Study by Shivam AgarwalKrispy natural Case Study by Shivam Agarwal
Krispy natural Case Study by Shivam Agarwal
 
Krispynaturalhbrcasestudy sanjali maheshwari
Krispynaturalhbrcasestudy sanjali maheshwariKrispynaturalhbrcasestudy sanjali maheshwari
Krispynaturalhbrcasestudy sanjali maheshwari
 
Natureview Farm Case Study
Natureview Farm Case StudyNatureview Farm Case Study
Natureview Farm Case Study
 
Harvard business review:Natureview Farm
Harvard business review:Natureview FarmHarvard business review:Natureview Farm
Harvard business review:Natureview Farm
 
Natureview
NatureviewNatureview
Natureview
 
Natureview Farm Harvard Case Analysis
Natureview Farm Harvard Case AnalysisNatureview Farm Harvard Case Analysis
Natureview Farm Harvard Case Analysis
 
Launching krispy natural case study.
Launching krispy natural case study.Launching krispy natural case study.
Launching krispy natural case study.
 
Introduction to the pharmaceutical market and practice
Introduction to the pharmaceutical market and practiceIntroduction to the pharmaceutical market and practice
Introduction to the pharmaceutical market and practice
 
J&j presentation athena
J&j presentation athenaJ&j presentation athena
J&j presentation athena
 
Assignment2
Assignment2Assignment2
Assignment2
 
Launching Krispy Natural: Cracking the Product Management Code
Launching Krispy Natural: Cracking the Product Management CodeLaunching Krispy Natural: Cracking the Product Management Code
Launching Krispy Natural: Cracking the Product Management Code
 
Launching Krispy Natural: Cracking the Product Management Code
Launching Krispy Natural: Cracking the Product Management CodeLaunching Krispy Natural: Cracking the Product Management Code
Launching Krispy Natural: Cracking the Product Management Code
 
Type II Diabetes Case Study.pptx
Type II Diabetes Case Study.pptxType II Diabetes Case Study.pptx
Type II Diabetes Case Study.pptx
 
Material in slides 2-14 of this overview adapted from Prin
Material in slides 2-14 of this overview adapted from PrinMaterial in slides 2-14 of this overview adapted from Prin
Material in slides 2-14 of this overview adapted from Prin
 
Material in slides 2-14 of this overview adapted from Prin
Material in slides 2-14 of this overview adapted from PrinMaterial in slides 2-14 of this overview adapted from Prin
Material in slides 2-14 of this overview adapted from Prin
 

Recently uploaded

20221005110010_633d63baa84f6_learn___week_3_ch._5.pdf
20221005110010_633d63baa84f6_learn___week_3_ch._5.pdf20221005110010_633d63baa84f6_learn___week_3_ch._5.pdf
20221005110010_633d63baa84f6_learn___week_3_ch._5.pdf
levuag
 
Liquid Staking: An Overview for Beginners in 2024
Liquid Staking: An Overview for Beginners in 2024Liquid Staking: An Overview for Beginners in 2024
Liquid Staking: An Overview for Beginners in 2024
nehapardhi711
 

Recently uploaded (20)

TikTok: The Cultural Revolution in 10 minutes!
TikTok: The Cultural Revolution in 10 minutes! TikTok: The Cultural Revolution in 10 minutes!
TikTok: The Cultural Revolution in 10 minutes!
 
All Over Conclusion Digital Marketing / Digital Marketing Benefits
All Over Conclusion Digital Marketing / Digital Marketing BenefitsAll Over Conclusion Digital Marketing / Digital Marketing Benefits
All Over Conclusion Digital Marketing / Digital Marketing Benefits
 
Unleashing Digital Marketing's Potential: Faith Cheltenham's Insights
Unleashing Digital Marketing's Potential: Faith Cheltenham's InsightsUnleashing Digital Marketing's Potential: Faith Cheltenham's Insights
Unleashing Digital Marketing's Potential: Faith Cheltenham's Insights
 
The_Canvas_of_Creative_Mastery_Newsletter_May_2024_Version
The_Canvas_of_Creative_Mastery_Newsletter_May_2024_VersionThe_Canvas_of_Creative_Mastery_Newsletter_May_2024_Version
The_Canvas_of_Creative_Mastery_Newsletter_May_2024_Version
 
Mastering Topical Authority for SEO Success
Mastering Topical Authority for SEO SuccessMastering Topical Authority for SEO Success
Mastering Topical Authority for SEO Success
 
Top 3 Ways to Align Sales and Marketing Teams for Rapid Growth
Top 3 Ways to Align Sales and Marketing Teams for Rapid GrowthTop 3 Ways to Align Sales and Marketing Teams for Rapid Growth
Top 3 Ways to Align Sales and Marketing Teams for Rapid Growth
 
BrightonSEO - Search Engine Omnipresence_ Why SEOs need to look beyond Google
BrightonSEO - Search Engine Omnipresence_ Why SEOs need to look beyond GoogleBrightonSEO - Search Engine Omnipresence_ Why SEOs need to look beyond Google
BrightonSEO - Search Engine Omnipresence_ Why SEOs need to look beyond Google
 
DSOM Dehradun-Mastering-Off & on Page-SEO
DSOM Dehradun-Mastering-Off & on Page-SEODSOM Dehradun-Mastering-Off & on Page-SEO
DSOM Dehradun-Mastering-Off & on Page-SEO
 
Media Wall Street | Best Branding And Marketing Agency In Chandigarh
Media Wall Street | Best Branding And Marketing Agency In ChandigarhMedia Wall Street | Best Branding And Marketing Agency In Chandigarh
Media Wall Street | Best Branding And Marketing Agency In Chandigarh
 
The Rise of AI in Digital Marketing in 2024
The Rise of AI in Digital Marketing in 2024The Rise of AI in Digital Marketing in 2024
The Rise of AI in Digital Marketing in 2024
 
20221005110010_633d63baa84f6_learn___week_3_ch._5.pdf
20221005110010_633d63baa84f6_learn___week_3_ch._5.pdf20221005110010_633d63baa84f6_learn___week_3_ch._5.pdf
20221005110010_633d63baa84f6_learn___week_3_ch._5.pdf
 
Awesome Free Global Opportunity Online Mining Crypto Currency On Your Mobile...
Awesome Free Global  Opportunity Online Mining Crypto Currency On Your Mobile...Awesome Free Global  Opportunity Online Mining Crypto Currency On Your Mobile...
Awesome Free Global Opportunity Online Mining Crypto Currency On Your Mobile...
 
How Your Platform Can Achieve a 90% Demo-to-Customer CVR
How Your Platform Can Achieve a 90% Demo-to-Customer CVRHow Your Platform Can Achieve a 90% Demo-to-Customer CVR
How Your Platform Can Achieve a 90% Demo-to-Customer CVR
 
A quick journey across brands, industries and people.
A quick journey across brands, industries and people.A quick journey across brands, industries and people.
A quick journey across brands, industries and people.
 
A chronological journey of jobs and responsibilities.
A chronological journey of jobs and responsibilities.A chronological journey of jobs and responsibilities.
A chronological journey of jobs and responsibilities.
 
Digital Marketing Training In Bangalore
Digital Marketing Training In BangaloreDigital Marketing Training In Bangalore
Digital Marketing Training In Bangalore
 
Metropolis of Dreams metaverse virtual city
Metropolis of Dreams metaverse virtual cityMetropolis of Dreams metaverse virtual city
Metropolis of Dreams metaverse virtual city
 
Liquid Staking: An Overview for Beginners in 2024
Liquid Staking: An Overview for Beginners in 2024Liquid Staking: An Overview for Beginners in 2024
Liquid Staking: An Overview for Beginners in 2024
 
Social Media Paid Ads Performance Report.pdf
Social Media Paid Ads Performance Report.pdfSocial Media Paid Ads Performance Report.pdf
Social Media Paid Ads Performance Report.pdf
 
SAUDI ARABIA MARKET OVERVIEW-PARTICLE BOARD.docx.pdf
SAUDI ARABIA MARKET OVERVIEW-PARTICLE BOARD.docx.pdfSAUDI ARABIA MARKET OVERVIEW-PARTICLE BOARD.docx.pdf
SAUDI ARABIA MARKET OVERVIEW-PARTICLE BOARD.docx.pdf
 

Metabical - Marketing Case Study

  • 1. Pricing, Packaging and Demand Forecasting for a New Weight-Loss Drug
  • 2. CSP’s Market Share Opportunity New Product Opportunity 0 % Increased Market Share ?? % IDENTIFIED MARKET OPPORTUNITYScope Packaging Demand Pricing Recommendation - - - $ 3,74 Bn per annum Market for Weight-Control Products As of 2008
  • 3. • > 65% of 230 Mn (~158 Mn) adult American population is considered overweight, obese or severely obese • CSP’s identified market segment: ~81.65 Mn (35.5%) overweight Americans TARGETING IDENTIFIED MARKET SEGMENTScope Packaging Demand Pricing Recommendation - - - 51.5 61.05 71.06 81.65 23.47 39.04 53.92 62.51 5.37 9.82 13.27 1980 1990 2000 2008 Overview of Overweight, Obese, & Severely Obese Population (Mn) in USA Overweight (BMI 25-30)* Obese (BMI 30-40)* Severely Obese (BMI >40)* Population Index 2008
  • 4. PRODUCT DESCRIPTION - METABICAL First ‘Food & Drug Administration (FDA)’ approved prescription drug for overweight population To be launched by Cambridge Science Pharmaceuticals (CSP) after 10 years in RnD To be launched in North American market within 9 months – by January 2009 Clinically proven weight-loss drugs targeted at overweight adults (BMI 25-30) Strong endorsement by medical community -> survey respondents show curiosity Scope Packaging Demand Pricing Recommendation - - - 12-week treatment plan - to consume one pill at same time everyday
  • 5. OBJECTIVESScope Packaging Demand Pricing Recommendation - - - CSP spent 10 yrs in R&D @ $ 400 Mn FDA Approval Requires Packaging Decision Launch Metabical Apr 2008 Jan 2009 now Pricing Decision Demand Forecast & ROI Determination Determine Optimal Package Size - Required for FDA approval Recommend Final Pricing Strategy - Achieve a 5% ROI within 5 years Establish Initial Demand Forecasts - Assess market potential and acquisition 1 2 3
  • 6. Information Required OBJECTIVES RETURN ON INVESTMENT (ROI) DEMAND PACKAGE PRICE Scope Packaging Demand Pricing Recommendation - - - CSP spent 10 yrs in R&D @ $ 400 Mn FDA Approval Requires Packaging Decision Launch Metabical Apr 2008 Jan 2009 now Pricing Decision Demand Forecast & ROI Determination
  • 7. EVALUATION CRITERIAScope Packaging Demand Pricing Recommendation - - - CSP spent 10 yrs in R&D @ $ 400 Mn FDA Approval Requires Packaging Decision Launch Metabical Apr 2008 Jan 2009 now Pricing Decision Demand Forecast & ROI Determination Conservative Demand Highest ROI Greatest Potential Uplift
  • 8. WEIGHT-LOSS PRODUCTS MARKET Scope Packaging Demand Pricing Recommendation - - - $ 3,74 Bn per annum Market for Weight-Control Products As of 2008 Competition Analysis
  • 9. Days of the Week Blister Style Insurance Implications No Subsidies Package Size 12 Weeks 4 Weeks PACKAGING Scope Packaging Demand Pricing Recommendation - - - ROIDEMAND PACKAGE PRICE
  • 10. DEMAND MODEL 1 FORECASTING DEMANDScope Packaging Demand Pricing Recommendation - - - Demand Model 1 Demand Model 2 Demand Model 3 ROIDEMAND PACKAGE PRICE Approx. In Millions (Mn) 4.29 Population that is ‘Overweight’ ‘Overweight’ people who are trying to lose weight ‘Overweight’ people trying to lose weight who are willing to use medication US Population 35.5% 35% 15%
  • 11. DEMAND MODEL 2 FORECASTING DEMANDScope Packaging Demand Pricing Recommendation - - - Demand Model 1 Demand Model 2 Demand Model 3 ROIDEMAND PACKAGE PRICE Approx. In Millions (Mn) 9.8 Population that is ‘Overweight’ ‘Overweight’ people who would seek an appointment if a prescription drug were available US Population 35.5% 12% Market Description Market Potential Demand Scenario 1 ‘Overweight’ people trying to lose weight who are willing to use medication to help 4.29 million Recap
  • 12. DEMAND MODEL 3 FORECASTING DEMANDScope Packaging Demand Pricing Recommendation - - - Demand Model 1 Demand Model 2 Demand Model 3 ROIDEMAND PACKAGE PRICE Approx. In Millions (Mn) 4.3 CSP Research determined population size of ideal target market: overweight females, age 35-65, college educated, health- conscious & visited the doctor more often US Population 35.5% Market Description Market Potential Demand Scenario 1 ‘Overweight’ people trying to lose weight who are willing to use medication to help 4.29 million Demand Scenario 2 ‘Overweight’ people who would seek an appointment if a prescription drug were available 9.8 million Recap
  • 13. FORECASTING DEMAND: SNAPSHOTScope Packaging Demand Pricing Recommendation - - - Demand Model 1 Demand Model 2 Demand Model 3 ROIDEMAND PACKAGE PRICE Market Description Market Potential Demand Scenario 1 ‘Overweight’ people trying to lose weight who are willing to use medication to help 4.29 million Demand Scenario 2 ‘Overweight’ people who would seek an appointment if a prescription drug were available 9.8 million Demand Scenario 3 CSP Research determined population size of ideal target market: overweight females, age 35-65, college educated, health-conscious & visited the doctor more often 4.3 million
  • 15. Factors Influencing Pricing Strategies PRICING MODELS: THE THREE C'SScope Packaging Demand Pricing Recommendation 3C’s - - ROIDEMAND PACKAGE PRICE PRICE Competitor or Competition 1 3 Customer or Demand 2 Company or Cost 5% ROI in 5 years Country: USA Population BMI: 25-30 • OTC Drugs, • Herbal Remedies, • FDA Approved (Alli, BMI>30) • Non-FDA Approved Competitor based Company based Customer based
  • 16. Factors Influencing Pricing Strategies PRICING MODELS: THE THREE C'S $75 Scope Packaging Demand Pricing Recommendation 3C’s - - ROIDEMAND PACKAGE PRICE Competition 1 3 Demand-based 2 Cost-based OTC Weight-loss Drugs: $63-$100 Premium** Benchmark to Direct Competition Alli – Cost Per 28 Days (4 weeks) * $ 48.72 Metabical – Proposed Price 28 Days (4 weeks) $ 75 Gross Margin (%) > 50 % Competitor based Company based Customer based Competition-based Strategy * Alli – closest comparable (non-prescription) drug ** FDA approved prescription strength medication
  • 17. Factors Influencing Pricing Strategies PRICING MODELS: THE THREE C'S $125 Scope Packaging Demand Pricing Recommendation 3C’s - - ROIDEMAND PACKAGE PRICE Competition 1 3 Demand-based 2 Cost-based Competitor based Company based Customer based CSP’s avg. Gross Margin = 70% Benchmark to CSP’s other Drug Margins Other Drug Gross Margins ~ 70 % Metabical – Proposed Price 28 Days (4 weeks) $ 125 Cost-based Strategy
  • 18. Factors Influencing Pricing Strategies PRICING MODELS: THE THREE C'S $150 Scope Packaging Demand Pricing Recommendation 3C’s - - ROIDEMAND PACKAGE PRICE Competition 1 3 Demand-based 2 Cost-based Ideal Target Customer value offer Competitor based Company based Customer based Benchmark to Value delivered to Customers Overweight Individuals Additional Annual Out-of-Pocket Expenses on Healthcare * $ 450 Metabical – Proposed Price 28 Days (4 weeks) $ 150 Metabical’s Complete 12-week Treatment $ 450 Demand-based Strategy * CSP’s Research (Outcomes Research Group)
  • 19. ROI FROM PRICE/DEMAND MATRIXScope Packaging Demand Pricing Recommendation 3C’s - - Competitor based Company based Customer based Model 1 Actively Trying to Lose Weight Model 2 Ready to Request a Prescription Model 3 Ideal Target Market Initial Market 4.3 million 9.8 million 4.3 million Market Acquisition* First Year: 10% Years 2,3,4,5: 5% Total @ Year 5: 30% First Year: 30% Years 2,3,4,5: 5% Total @ Year 5: 50% Repurchasing Behaviour** First 4 weeks: 100% Second 4 Weeks: 60% Third 4 Weeks: 12% Total Sales 2.2 million packages 4.2 million packages 3.7 million packages Demand Pricing ROIDEMAND PACKAGE PRICE * Penetration estimates are based on CSP historical experience. Customers are conservatively assumed not to "repeat" a treatment subscription within the five year period. ** Based on data from test trials during R&D phase
  • 20. ROI FROM PRICE/DEMAND MATRIX NB: Costs include: $ 400 Mn Research & Development, $ 23 Mn initial marketing budget, $ 1.2 Mn annual fixed costs of production, $ 25.20 variable costs per package produced Scope Packaging Demand Pricing Recommendation 3C’s - - Competitor based Company based Customer based ROIDEMAND PACKAGE PRICE Model 1 Actively Trying to Lose Weight Model 2 Ready to Request a Prescription Model 3 Ideal Target Market 5 Year Results Market: 4.3 Mn Packages Sold: 2.2 Mn Market: 9.8 Mn Packages Sold: 4.2 Mn Market: 4.3 Mn Packages Sold: 3.7 Mn Competitor $75 Premium Market Placement Sales: $166 Mn ROI: (192.65%) Sales $316 Mn ROI: (69.60%) Sales: $227 Mn ROI: (88.55%) Company $125 Average Gross Margin Sales: $276 Mn ROI: (75.59%) Sales: $527 Mn ROI: (1.76%) Sales: $462 Mn ROI: (13.13%) Customer $150 Consumer Value Model Sales: $332 Mn ROI: (46.33%) Sales: $632 Mn ROI: 15.20% Sales: $555 Mn ROI: 5.73% Demand Pricing Evaluation Criteria: Min 5% ROI
  • 21. ROI FROM PRICE/DEMAND MATRIX NB: Costs include: $ 400 Mn Research & Development, $ 23 Mn initial marketing budget, $ 1.2 Mn annual fixed costs of production, $ 25.20 variable costs per package produced Scope Packaging Demand Pricing Recommendation 3C’s - - Competitor based Company based Customer based ROIDEMAND PACKAGE PRICE Model 1 Actively Trying to Lose Weight Model 2 Ready to Request a Prescription Model 3 Ideal Target Market 5 Year Results Market: 4.3 Mn Packages Sold: 2.2 Mn Market: 9.8 Mn Packages Sold: 4.2 Mn Market: 4.3 Mn Packages Sold: 3.7 Mn Competitor $75 Premium Market Placement Sales: $166 Mn ROI: (192.65%) Sales $316 Mn ROI: (69.60%) Sales: $227 Mn ROI: (88.55%) Company $125 Average Gross Margin Sales: $276 Mn ROI: (75.59%) Sales: $527 Mn ROI: (1.76%) Sales: $462 Mn ROI: (13.13%) Customer $150 Consumer Value Model Sales: $332 Mn ROI: (46.33%) Sales: $632 Mn ROI: 15.20% Sales: $555 Mn ROI: 5.73% Demand Pricing Evaluation Criteria: Min 5% ROI
  • 22. Customer based Skimming Strategy - PRICING MODELS: SKIMMING STRATEGYScope Packaging Demand Pricing Recommendation 3C’s Skimming - ROIDEMAND PACKAGE PRICE Leverage on the buyers’ willingness to pay
  • 23. PRICING MODELS: SKIMMING STRATEGY Year 1 Price $150 Market 4.3 Mn Penetration 30% Year 2 Price $150 Market 4.3 Mn Penetration 5% Year 3-5 Drop price to $99 Market 9.8 Mn Penetration 5% Scope Packaging Demand Pricing Recommendation 3C’s Skimming - Customer based Skimming Strategy - ROIDEMAND PACKAGE PRICE Skimming Strategy
  • 24. PRICING MODELS: SKIMMING STRATEGY Skimming Revenue Base Model Revenue Scope Packaging Demand Pricing Recommendation 3C’s Skimming - Customer based Skimming Strategy - ROIDEMAND PACKAGE PRICE Determine ROI Skimming Model 12.51% Base Model 5.73%
  • 25. PRICING MODELS: QUANTITY STRATEGYScope Packaging Demand Pricing Recommendation 3C’s Skimming Quantity Customer based Skimming Strategy Quantity Differentiator ROIDEMAND PACKAGE PRICE Price Differentiation Demographic Geographical Temporal Benefit-based Quantity-based Bundling What is Quantity-based Price Differentiation? Offer identical or similar products to different customers or segments at different prices • The avg. price per unit varies depending on the quantity purchased – i.e., customers benefit from volume discounts • Customer loyalty is directly proportional to the discounts offered
  • 26. PRICING MODELS: QUANTITY STRATEGY Third Month (12%) Second Month (60%) First Month (100%) Buys Starter Pack $150 Buys Double Pack $225 Buys Single Pack $150 Buys Single Pack $150 %? %? Scope Packaging Demand Pricing Recommendation 3C’s Skimming Quantity Customer based Skimming Strategy Quantity Differentiator ROIDEMAND PACKAGE PRICE To Model Impact on ROI Uptake of Quantity Offer Year 1 Price $150 Market 4.3 Mn Penetration 30% Year 2-5 Price $150 Market 4.3 Mn Penetration 5% (each year) ROI 5.73% over 5years Quantity Strategy Recall Repeat Purchase Behaviour Model
  • 27. PRICING MODELS: QUANTITY STRATEGYScope Packaging Demand Pricing Recommendation 3C’s Skimming Quantity Customer based Skimming Strategy Quantity Differentiator ROIDEMAND PACKAGE PRICE Determine ROI Max. Uptake 10.41% No Uptake 5.73%
  • 28. ROI FROM PRICE/DEMAND MATRIXScope Packaging Demand Pricing Recommendation 3C’s Skimming Quantity Customer based Skimming Strategy Quantity Differentiator ROIDEMAND PACKAGE PRICEEvaluation Criteria Conservative Model Highest ROI Greatest Uplift Potential Model 3 Ideal Target Market Skimming Strategy Quantity Differentiation Strategy 5 Year Results Initial Market: 4.3 Mn Packages Sold: 3.7 Mn Packages Sold: 5.1 Mn Packages Sold: 3.8-4.5 Mn Market Penetration Strategy Ideal Target Market Reduce Price in Year 3 to attract additional customers "ready to request a prescription" Offer Qty Discount to capture greater repeat purchases Price per 4-week Pack: $150 Consumer Value Model ROI: 5.73% ROI: 12.51% ROI: 5.73-10.41% Demand Pricing
  • 29. ROI FROM PRICE/DEMAND MATRIXScope Packaging Demand Pricing Recommendation 3C’s Skimming Quantity ROIDEMAND PACKAGE PRICEEvaluation Criteria Conservative Model Highest ROI Greatest Uplift Potential Model 3 Ideal Target Market Skimming Strategy Quantity Differentiation Strategy 5 Year Results Initial Market: 4.3 Mn Packages Sold: 3.7 Mn Packages Sold: 5.1 Mn Packages Sold: 3.8-4.5 Mn Market Penetration Strategy Ideal Target Market Reduce Price in Year 3 to attract additional customers "ready to request a prescription" Offer Qty Discount to capture greater repeat purchases Price per 4-week Pack: $150 Consumer Value Model ROI: 5.73% ROI: 12.51% ROI: 5.73-10.41% Demand Pricing Customer based Skimming Strategy Quantity Differentiator
  • 30. OUR RECOMMENDATION Minimum Conservative ROI Estimate 12.51% Combination of Demand Models •Ideal Target Market (4.3 Mn) •Ready to Request Prescription (9.8 Mn) 4 Week Blister Style Packaging Most Conservative ROI Estimate with Highest Potential for Uplift Scope Packaging Demand Pricing Recommendation 3C’s Skimming Quantity Conservative Demand Highest ROI Greatest Potential Uplift Skimming Strategy Start @ $150 in Year 1 Drop to $99 in Year 3 1 2 3 Recap
  • 31. Pricing, Packaging and Demand Forecasting for a New Weight-Loss Drug
  • 32. APPENDIX – SURVEY RESULTS Sample (Men & Women) 2000 100.00% Not satisfied with current weight 1400 70.00% Actively trying to lose weight 700 35.00% Comfortable using weightloss drugs 105 5.25% Seek prescription from healthcare provider 240 12.00% CSP Survey Results
  • 33. APPENDIX – POPULATION ESTIMATION USA Adult Population in Mn CAGR % Year 1980 163 Year 1990 185 1.27 Year 2000 209 1.23 Year 2008 230 1.22 USA Population Estimation for 2008 % of overweight people %OW CAGR % %obese CAGR% %morbidly obese CAGR% Year 1976-1980 31.6 14.4 Year 1988-1994 33 0.031 20.1 0.02 2.9 Year 1999-2000 34 0.05 25.8 0.08 4.7 0.23 Total BMI >25 Year 2008 35.5 0.5 27.2 5.8 68.46 No. of overweight individuals 2008 (in Mn) 81.65 Conservative estimate of this figure 78.2 Estimate for % Overweight People in USA 2008
  • 34. APPENDIX – DEMAND FORECAST 1 Description % Amount First Purchase (100%) Second Purchase (60%) Third Purchase (20%) Total packages sold (12 weeks) No. of overweight individuals in US (2008) 81,650,000.00 Individuals actively trying to lose weight 35% 28,577,500.00 Individuals ^ comfortable using drugs 15% 4,286,625.00 Acquired customerbase in Yr 1 10% 428,662.50 428,662.50 257,197.50 51,439.50 737,299.50 Acquired customerbase in Yr 2 5% 214,331.25 214,331.25 128,598.75 25,719.75 368,649.75 Acquired customerbase in Yr 3 5% 214,331.25 214,331.25 128,598.75 25,719.75 368,649.75 Acquired customerbase in Yr 4 5% 214,331.25 214,331.25 128,598.75 25,719.75 368,649.75 Acquired customerbase in Yr 5 5% 214,331.25 214,331.25 128,598.75 25,719.75 368,649.75 TOTAL 2,211,898.50 Revenue Revenue Recurrent Costs Total Costs Gross Margin ROI PR 3 - Consumer Value Price (CUSTOMER) 150.00$ 331,784,775.00$ 55,739,842.20$ 485,489,842.20$ -153,705,067.20$ -46.33% PR 2 - Average Margin Price (COMPANY) 125.00$ 276,487,312.50$ 55,739,842.20$ 485,489,842.20$ -209,002,529.70$ -75.59% PR 1 - Premium Price Point (COMPETITOR) 75.00$ 165,892,387.50$ 55,739,842.20$ 485,489,842.20$ -319,597,454.70$ -192.65% DEMAND FORECAST 1 - OVERWEIGHT, WANT TO LOSE IT, HAPPY WITH DRUGS PRICING DEMAND FORECAST 1
  • 35. APPENDIX – DEMAND FORECAST 2 Description % Amount First Purchase (100%) Second Purchase (60%) Third Purchase (20%) Total packages sold (12 weeks) No. of overweight individuals in 2008 81,650,000.00 Respondents ready to seek prescription 12% 9,798,000.00 Acquire customerbase in Yr 1 10% 979,800.00 979,800.00 587,880.00 117,576.00 1,685,256.00 Acquire customerbase in Yr 2 5% 489,900.00 489,900.00 293,940.00 58,788.00 842,628.00 Acquire customerbase in Yr 3 5% 489,900.00 489,900.00 293,940.00 58,788.00 842,628.00 Acquire customerbase in Yr 4 5% 489,900.00 489,900.00 293,940.00 58,788.00 842,628.00 Acquire customerbase in Yr 5 5% 489,900.00 489,900.00 293,940.00 58,788.00 842,628.00 TOTAL 4,213,140.00 Revenue Revenue Recurrent Costs Total Costs Gross Margin ROI PR 3 - Consumer Value Price (CUSTOMER) 150.00$ 631,971,000.00$ 106,171,128.00$ 535,921,128.00$ 96,049,872.00$ 15.20% PR 2 - Average Margin Price (COMPANY) 125.00$ 526,642,500.00$ 106,171,128.00$ 535,921,128.00$ -9,278,628.00$ -1.76% PR 1 - Premium Price Point (COMPETITOR) 75.00$ 315,985,500.00$ 106,171,128.00$ 535,921,128.00$ -219,935,628.00$ -69.60% DEMAND FORECAST 2 - OVERWEIGHT, WOULD SEEK PRESCRIPTION PRICING DEMAND FORECAST 2
  • 36. APPENDIX – DEMAND FORECAST 3 Description % Amount First Purchase (100%) Second Purchase (60%) Third Purchase (20%) Total packages sold (12 weeks) Ideal Target Market: women 35-65 OW 4,300,000.00 Acquire customerbase in Yr 1 30% 1,290,000.00 1,290,000.00 774,000.00 154,800.00 2,218,800.00 Acquire customerbase in Yr 2 5% 215,000.00 215,000.00 129,000.00 25,800.00 369,800.00 Acquire customerbase in Yr 3 5% 215,000.00 215,000.00 129,000.00 25,800.00 369,800.00 Acquire customerbase in Yr 4 5% 215,000.00 215,000.00 129,000.00 25,800.00 369,800.00 Acquire customerbase in Yr 5 5% 215,000.00 215,000.00 129,000.00 25,800.00 369,800.00 TOTAL 3,698,000.00 Revenue Revenue Recurrent Costs Total Costs Gross Margin ROI PR 3 - Consumer Value Price (CUSTOMER) 150.00$ 554,700,000.00$ 93,189,600.00$ 522,939,600.00$ 31,760,400.00$ 5.73% PR 2 - Average Margin Price (COMPANY) 125.00$ 462,250,000.00$ 93,189,600.00$ 522,939,600.00$ -60,689,600.00$ -13.13% PR 1 - Premium Price Point (COMPETITOR) 75.00$ 277,350,000.00$ 93,189,600.00$ 522,939,600.00$ -245,589,600.00$ -88.55% PRICING DEMAND FORECAST 3 DEMAND FORECAST 3 - IDEAL TARGET MARKET
  • 37. APPENDIX – DEMAND FORECAST 4 Description % Amount First Purchase (100%) Second Purchase (60%) Third Purchase (20%) Total packages sold (12 weeks) Ideal Target Market: women 35-65 OW 4,300,000.00 Acquire customerbase in Yr 1 30% 1,290,000.00 1,290,000.00 774,000.00 154,800.00 2,218,800.00 Acquire customerbase in Yr 2 5% 215,000.00 215,000.00 129,000.00 25,800.00 369,800.00 Acquire customerbase in Yr 3 5% 489,900.00 489,900.00 293,940.00 58,788.00 842,628.00 Acquire customerbase in Yr 4 5% 489,900.00 489,900.00 293,940.00 58,788.00 842,628.00 Acquire customerbase in Yr 5 5% 489,900.00 489,900.00 293,940.00 58,788.00 842,628.00 TOTAL 5,116,484.00 Revenue Revenue Recurrent Costs Proportion Costs Proportion GM Proportion Sales PR 3 - Consumer Value Price (CUSTOMER) 150.00$ 332,820,000.00$ 55,913,760.00$ 279,904,488.09$ 52,915,511.91$ 52.12% PR 3 - Consumer Value Price (CUSTOMER) 150.00$ 55,470,000.00$ 9,318,960.00$ 46,650,748.01$ 8,819,251.99$ 8.69% VAR PR 4 - Skimming Strategy (YEAR 3) 99.00$ 83,420,172.00$ 21,234,225.60$ 77,376,720.23$ 6,043,451.77$ 13.06% VAR PR 4 - Skimming Strategy (YEAR 3) 99.00$ 83,420,172.00$ 21,234,225.60$ 77,376,720.23$ 6,043,451.77$ 13.06% VAR PR 4 - Skimming Strategy (YEAR 3) 99.00$ 83,420,172.00$ 21,234,225.60$ 77,376,720.23$ 6,043,451.77$ 13.06% SUMMARY OF RESULTS Revenue Recurrent Costs Total Costs Gross Margin ROI TOTAL SALES PERIOD - SKIMMING MODEL 638,550,516.00$ 128,935,396.80$ 558,685,396.80$ 79,865,119.20$ 12.51% PRICING STRATEGY 4 - SKIMMING MODEL PRICING DEMAND FORECAST 3
  • 38. APPENDIX – DEMAND FORECAST 5 Description % Amount Buy pack 1 (100%) Buy pack 2&3 Buy pack 2 only Buy pack 3 (20%) TOTAL Doubles TOTAL Singles VAR: Uptake VAR: Uptake Ideal Target Market: women 35-65 OW 4,300,000.00 50.00% 10.00% Acquire customerbase in Yr 1 30% 1,290,000.00 1,290,000.00 645,000.00 129,000.00 25,800.00 645,000.00 1,444,800.00 Acquire customerbase in Yr 2 5% 215,000.00 215,000.00 107,500.00 21,500.00 4,300.00 107,500.00 240,800.00 Acquire customerbase in Yr 3 5% 215,000.00 215,000.00 107,500.00 21,500.00 4,300.00 107,500.00 240,800.00 Acquire customerbase in Yr 4 5% 215,000.00 215,000.00 107,500.00 21,500.00 4,300.00 107,500.00 240,800.00 Acquire customerbase in Yr 5 5% 215,000.00 215,000.00 107,500.00 21,500.00 4,300.00 107,500.00 240,800.00 TOTAL 1,075,000.00 2,408,000.00 Revenue Revenue Recurrent Costs Proportion Costs Proportion GM Proportion Sales TOTAL SALES PERIOD - SKIMMING MODEL 603,075,000.00$ 114,861,600.00$ 544,611,600.00$ 58,463,400.00$ 9.69% PRICING STRATEGY 5 - QTY DIFFERENTIATION MODEL PRICING DEMAND FORECAST 3
  • 39. FIXED VARIABLE DESCRIPTION AMOUNT UNIT PR 1 - Premium Price Point (COMPETITOR) 75.00$ per package PR 2 - Average Margin Price (COMPANY) 125.00$ per package PR 3 - Consumer Value Price (CUSTOMER) 150.00$ per package VAR PR 4 - Skimming Strategy (YEAR 3) 99.00$ per package VAR PR 5 - Qty Diff Strategy (DBL OFFER) 225.00$ per double package Variable Costs 25.20$ per package R&D Cost 400,000,000.00$ million sunk costs Marketing Cost 23,000,000.00$ million total estimate Fixed Annual Cost 1,350,000.00$ million per year TOTAL COSTS (5yr) 429,750,000.00$ million over 5 yrs APPENDIX – FIXED VARIABLE PRICING