Downloaded 1,670 times


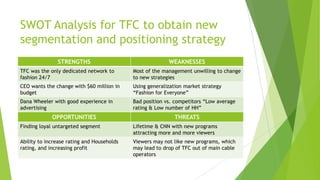
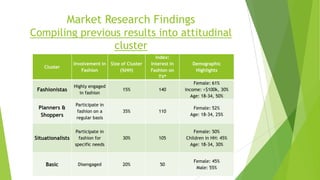
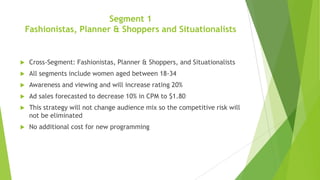
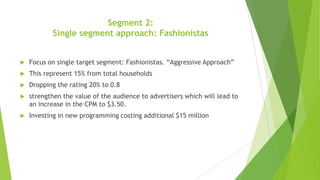
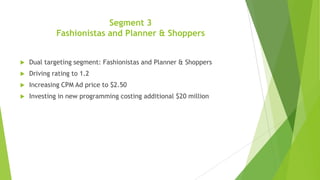
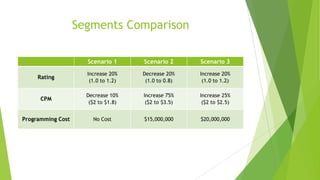

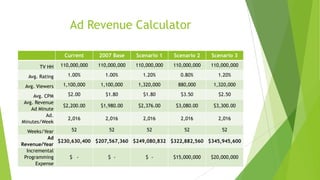
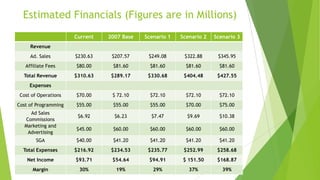
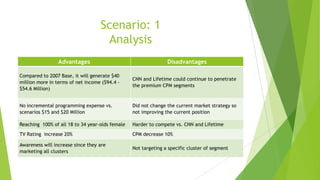
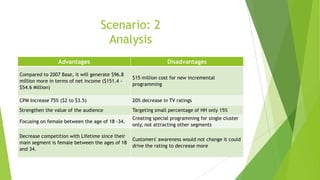
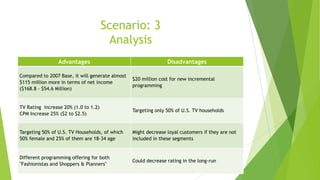


Dana Wheeler is preparing recommendations for The Fashion Channel's new segmentation and positioning strategy to strengthen its competitive position against main rivals Lifetime and CNN. Three scenarios are suggested: 1) Targeting multiple segments including Fashionistas, Planners & Shoppers and Situationalists with a 20% rating increase but 10% CPM decrease. 2) Targeting just Fashionistas with a 20% rating decrease but 75% CPM increase and $15M in new programming. 3) Targeting Fashionistas and Planners & Shoppers with a 20% rating increase and 25% CPM increase requiring $20M in new programming. Scenario 3 is estimated to generate the highest net income of $168.8M


