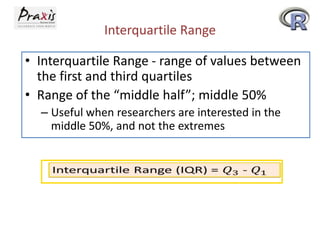
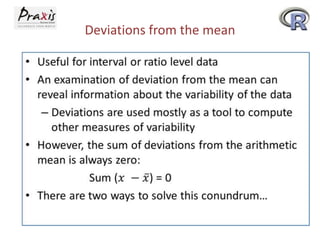
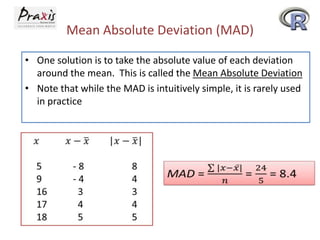
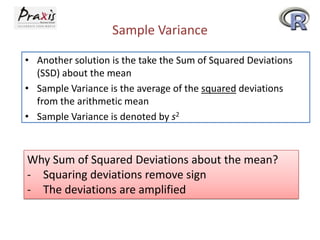
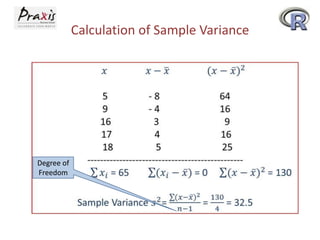
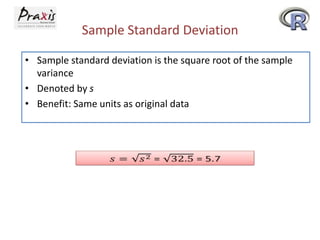
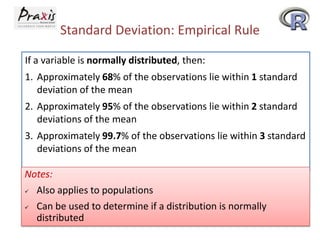
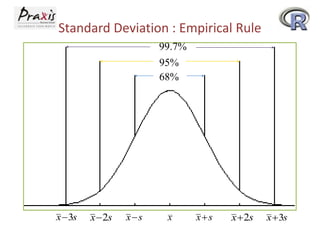
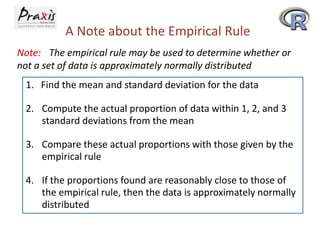
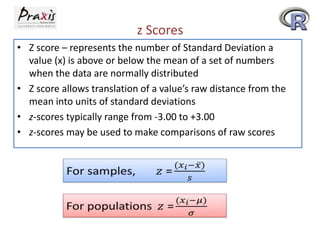
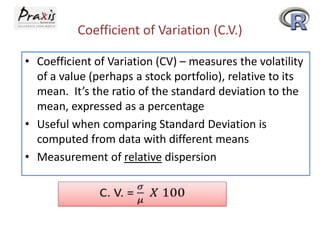
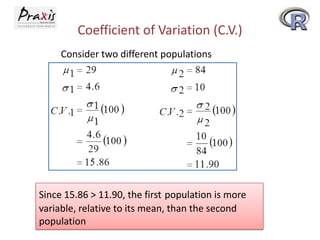
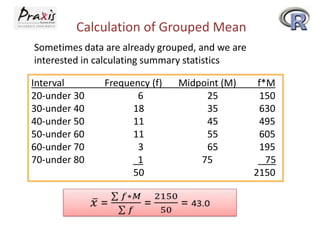
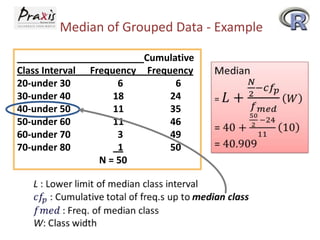
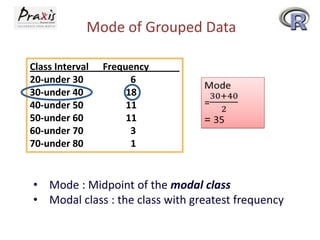
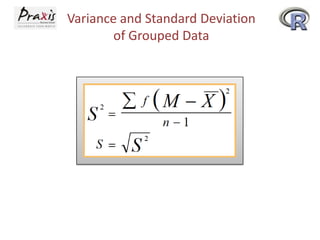
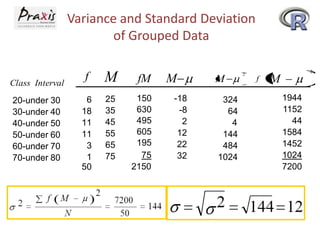
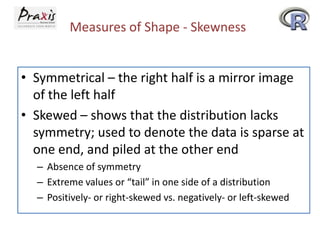
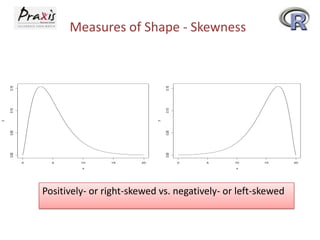
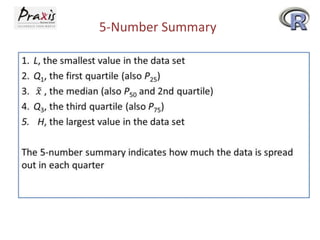
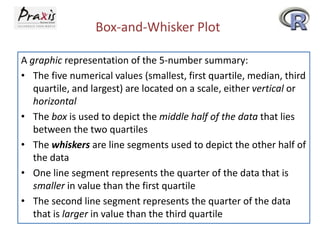
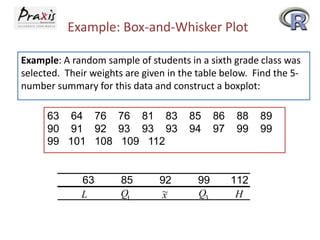
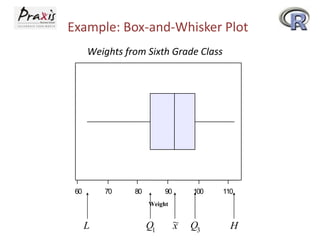
SlideShare a Scribd company logo
1 of 26
Measures of Variability:
Ungrouped Data
• Measures of Variability - tools that describe
the spread or the dispersion of a set of data.
– Provides more meaningful data when used
• with measures of central tendency
• in comparison to other groups
Measures of Spread or Dispersion:
Ungrouped Data
• Common Measures of Variability
–Range
–Inter-quartile Range
–Mean Absolute Deviation
–Variance and Standard Deviation
–Coefficient of Variation
Range
• The difference between the largest and the
smallest values in a set of data
– Advantage – easy to compute
– Disadvantage – is affected by extreme values
Interquartile Range
• Interquartile Range - range of values between
the first and third quartiles
• Range of the “middle half”; middle 50%
– Useful when researchers are interested in the
middle 50%, and not the extremes
Deviations from the mean
Mean Absolute Deviation (MAD)
• One solution is to take the absolute value of each deviation
around the mean. This is called the Mean Absolute Deviation
• Note that while the MAD is intuitively simple, it is rarely used
in practice
Sample Variance
• Another solution is the take the Sum of Squared Deviations
(SSD) about the mean
• Sample Variance is the average of the squared deviations
from the arithmetic mean
• Sample Variance is denoted by s2

Why Sum of Squared Deviations about the mean?
- Squaring deviations remove sign
- The deviations are amplified
Calculation of Sample Variance

Degree of
Freedom
Sample Standard Deviation
• Sample standard deviation is the square root of the sample
variance
• Denoted by s
• Benefit: Same units as original data
Standard Deviation: Empirical Rule
If a variable is normally distributed, then:
1. Approximately 68% of the observations lie within 1 standard
deviation of the mean
2. Approximately 95% of the observations lie within 2 standard
deviations of the mean
3. Approximately 99.7% of the observations lie within 3 standard
deviations of the mean
Notes:
 Also applies to populations


Can be used to determine if a distribution is normally
distributed
Standard Deviation : Empirical Rule
99.7%
95%
68%

x 3s

x 2s

x s

x

x s

x 2s

x 3s
A Note about the Empirical Rule
Note: The empirical rule may be used to determine whether or
not a set of data is approximately normally distributed
1. Find the mean and standard deviation for the data
2. Compute the actual proportion of data within 1, 2, and 3
standard deviations from the mean
3. Compare these actual proportions with those given by the
empirical rule
4. If the proportions found are reasonably close to those of
the empirical rule, then the data is approximately normally
distributed
z Scores
• Z score – represents the number of Standard Deviation a
value (x) is above or below the mean of a set of numbers
when the data are normally distributed
• Z score allows translation of a value’s raw distance from the
mean into units of standard deviations
• z-scores typically range from -3.00 to +3.00
• z-scores may be used to make comparisons of raw scores
Coefficient of Variation (C.V.)
• Coefficient of Variation (CV) – measures the volatility
of a value (perhaps a stock portfolio), relative to its
mean. It’s the ratio of the standard deviation to the
mean, expressed as a percentage
• Useful when comparing Standard Deviation is
computed from data with different means
• Measurement of relative dispersion
Coefficient of Variation (C.V.)
Consider two different populations

Since 15.86 > 11.90, the first population is more
variable, relative to its mean, than the second
population
Calculation of Grouped Mean
Sometimes data are already grouped, and we are
interested in calculating summary statistics
Interval
20-under 30
30-under 40
40-under 50
50-under 60
60-under 70
70-under 80

Frequency (f)
6
18
11
11
3
1
50

Midpoint (M)
25
35
45
55
65
75

f*M
150
630
495
605
195
75
2150
Median of Grouped Data - Example
Class Interval
20-under 30
30-under 40
40-under 50
50-under 60
60-under 70
70-under 80

Cumulative
Frequency Frequency
6
6
18
24
11
35
11
46
3
49
1
50
N = 50
Mode of Grouped Data
Class Interval
20-under 30
30-under 40
40-under 50
50-under 60
60-under 70
70-under 80

Frequency
6
18
11
11
3
1

• Mode : Midpoint of the modal class
• Modal class : the class with greatest frequency
Variance and Standard Deviation
of Grouped Data
Variance and Standard Deviation
of Grouped Data
Class Interval

20-under 30
30-under 40
40-under 50
50-under 60
60-under 70
70-under 80

f

M

fM

6
18
11
11
3
1
50

25
35
45
55
65
75

150
630
495
605
195
75
2150

M
-18
-8
2
12
22
32

M
324
64
4
144
484
1024

2

2

f

M
1944
1152
44
1584
1452
1024
7200
Measures of Shape - Skewness
• Symmetrical – the right half is a mirror image
of the left half
• Skewed – shows that the distribution lacks
symmetry; used to denote the data is sparse at
one end, and piled at the other end
– Absence of symmetry
– Extreme values or “tail” in one side of a distribution
– Positively- or right-skewed vs. negatively- or left-skewed
0.00

0.00

0.05

0.05

y

y

0.10

0.10

0.15

0.15

Measures of Shape - Skewness

0

5

10
x

15

20

0

5

10

15

x

Positively- or right-skewed vs. negatively- or left-skewed

20
5-Number Summary
Box-and-Whisker Plot
A graphic representation of the 5-number summary:
• The five numerical values (smallest, first quartile, median, third
quartile, and largest) are located on a scale, either vertical or
horizontal
• The box is used to depict the middle half of the data that lies
between the two quartiles
• The whiskers are line segments used to depict the other half of
the data
• One line segment represents the quarter of the data that is
smaller in value than the first quartile
• The second line segment represents the quarter of the data
that is larger in value than the third quartile
Example: Box-and-Whisker Plot
Example: A random sample of students in a sixth grade class was
selected. Their weights are given in the table below. Find the 5number summary for this data and construct a boxplot:
63 64 76 76 81 83
90 91 92 93 93 93
99 101 108 109 112

63
L

85
Q1

92
~
x

85
94

99
Q3

86
97

88
99

112
H

89
99
Example: Box-and-Whisker Plot
Weights from Sixth Grade Class

60

70

80

90

100

110

Weight

L

Q1

~
x

Q3

H

More Related Content

What's hot

CCNA Routing Fundamentals - EIGRP, OSPF and RIP
CCNA  Routing Fundamentals -  EIGRP, OSPF and RIPCCNA  Routing Fundamentals -  EIGRP, OSPF and RIP
CCNA Routing Fundamentals - EIGRP, OSPF and RIPsushmil123
 
Analog and Digital Transmission
Analog and Digital TransmissionAnalog and Digital Transmission
Analog and Digital TransmissionAnushiya Ram
 
High-Level Synthesis with GAUT
High-Level Synthesis with GAUTHigh-Level Synthesis with GAUT
High-Level Synthesis with GAUTAdaCore
 
Magnitude Comparator and types of MC
Magnitude Comparator and types of MCMagnitude Comparator and types of MC
Magnitude Comparator and types of MCEasy n Inspire L
 
Fpga implementation of utmi with usb 2.O
Fpga implementation of  utmi  with usb 2.O Fpga implementation of  utmi  with usb 2.O
Fpga implementation of utmi with usb 2.O Mathew George
 
Fsk modulation and demodulation
Fsk modulation and demodulationFsk modulation and demodulation
Fsk modulation and demodulationMafaz Ahmed
 
Education school network audio system
Education school network audio systemEducation school network audio system
Education school network audio systemSimon Lin
 
Microprocessor Presentation
Microprocessor PresentationMicroprocessor Presentation
Microprocessor Presentationalaminmasum1
 
Programmable Peripheral Interface 8255
 Programmable Peripheral Interface   8255 Programmable Peripheral Interface   8255
Programmable Peripheral Interface 8255Dr.P.Parandaman
 
Real Time Clock Interfacing with FPGA
Real Time Clock Interfacing with FPGAReal Time Clock Interfacing with FPGA
Real Time Clock Interfacing with FPGAMafaz Ahmed
 
PROGRAMMABLE KEYBOARD AND DISPLAY INTERFACE(8279).pptx
PROGRAMMABLE KEYBOARD AND DISPLAY INTERFACE(8279).pptxPROGRAMMABLE KEYBOARD AND DISPLAY INTERFACE(8279).pptx
PROGRAMMABLE KEYBOARD AND DISPLAY INTERFACE(8279).pptxSanjayV73
 
Presentation on 8086 microprocessor
Presentation on 8086 microprocessorPresentation on 8086 microprocessor
Presentation on 8086 microprocessorDiponkor Bala
 
Session 6 sv_randomization
Session 6 sv_randomizationSession 6 sv_randomization
Session 6 sv_randomizationNirav Desai
 
Baseband transmission
Baseband transmissionBaseband transmission
Baseband transmissionPunk Pankaj
 
Memory ECC - The Comprehensive of SEC-DED.
Memory ECC - The Comprehensive of SEC-DED. Memory ECC - The Comprehensive of SEC-DED.
Memory ECC - The Comprehensive of SEC-DED. Sk Cheah
 

What's hot (20)

80386-1.pptx
80386-1.pptx80386-1.pptx
80386-1.pptx
 
8051 interrupts
8051 interrupts8051 interrupts
8051 interrupts
 
CCNA Routing Fundamentals - EIGRP, OSPF and RIP
CCNA  Routing Fundamentals -  EIGRP, OSPF and RIPCCNA  Routing Fundamentals -  EIGRP, OSPF and RIP
CCNA Routing Fundamentals - EIGRP, OSPF and RIP
 
Analog and Digital Transmission
Analog and Digital TransmissionAnalog and Digital Transmission
Analog and Digital Transmission
 
High-Level Synthesis with GAUT
High-Level Synthesis with GAUTHigh-Level Synthesis with GAUT
High-Level Synthesis with GAUT
 
Magnitude Comparator and types of MC
Magnitude Comparator and types of MCMagnitude Comparator and types of MC
Magnitude Comparator and types of MC
 
Fpga implementation of utmi with usb 2.O
Fpga implementation of  utmi  with usb 2.O Fpga implementation of  utmi  with usb 2.O
Fpga implementation of utmi with usb 2.O
 
Fsk modulation and demodulation
Fsk modulation and demodulationFsk modulation and demodulation
Fsk modulation and demodulation
 
Education school network audio system
Education school network audio systemEducation school network audio system
Education school network audio system
 
Microprocessor Presentation
Microprocessor PresentationMicroprocessor Presentation
Microprocessor Presentation
 
Programmable Peripheral Interface 8255
 Programmable Peripheral Interface   8255 Programmable Peripheral Interface   8255
Programmable Peripheral Interface 8255
 
Real Time Clock Interfacing with FPGA
Real Time Clock Interfacing with FPGAReal Time Clock Interfacing with FPGA
Real Time Clock Interfacing with FPGA
 
SOC/ASIC Bus Standards
SOC/ASIC Bus StandardsSOC/ASIC Bus Standards
SOC/ASIC Bus Standards
 
PROGRAMMABLE KEYBOARD AND DISPLAY INTERFACE(8279).pptx
PROGRAMMABLE KEYBOARD AND DISPLAY INTERFACE(8279).pptxPROGRAMMABLE KEYBOARD AND DISPLAY INTERFACE(8279).pptx
PROGRAMMABLE KEYBOARD AND DISPLAY INTERFACE(8279).pptx
 
Presentation on 8086 microprocessor
Presentation on 8086 microprocessorPresentation on 8086 microprocessor
Presentation on 8086 microprocessor
 
Session 6 sv_randomization
Session 6 sv_randomizationSession 6 sv_randomization
Session 6 sv_randomization
 
Baseband transmission
Baseband transmissionBaseband transmission
Baseband transmission
 
Memory ECC - The Comprehensive of SEC-DED.
Memory ECC - The Comprehensive of SEC-DED. Memory ECC - The Comprehensive of SEC-DED.
Memory ECC - The Comprehensive of SEC-DED.
 
Group 7 combinational logic
Group 7 combinational logicGroup 7 combinational logic
Group 7 combinational logic
 
Axi
AxiAxi
Axi
 

Viewers also liked

Chapter 03
Chapter 03Chapter 03
Chapter 03bmcfad01
 
Mean, Median, Mode: Measures of Central Tendency
Mean, Median, Mode: Measures of Central Tendency Mean, Median, Mode: Measures of Central Tendency
Mean, Median, Mode: Measures of Central Tendency Jan Nah
 
3.3 Mean, Median, Mode, Formulas
3.3 Mean, Median, Mode, Formulas3.3 Mean, Median, Mode, Formulas
3.3 Mean, Median, Mode, FormulasJessca Lundin
 
Lesson Plan- Measures of Central tendency of Data
Lesson Plan- Measures of Central tendency of DataLesson Plan- Measures of Central tendency of Data
Lesson Plan- Measures of Central tendency of DataElton John Embodo
 
Statistics
StatisticsStatistics
Statisticspikuoec
 
Measures of central tendency
Measures of central tendencyMeasures of central tendency
Measures of central tendencyChie Pegollo
 
Standard Deviation and Variance
Standard Deviation and VarianceStandard Deviation and Variance
Standard Deviation and VarianceJufil Hombria
 
2 4 measures of center
2 4 measures of center2 4 measures of center
2 4 measures of centerKen Kretsch
 
02 quanttech-mean-variance
02 quanttech-mean-variance02 quanttech-mean-variance
02 quanttech-mean-variancePooja Sakhla
 
Cyberbullying class 97
Cyberbullying class 97Cyberbullying class 97
Cyberbullying class 97herbison
 
Notes Day 6: Bernoulli Trials
Notes Day 6: Bernoulli TrialsNotes Day 6: Bernoulli Trials
Notes Day 6: Bernoulli TrialsKate Nowak
 
Week 2 applying for jobs
Week 2 applying for jobsWeek 2 applying for jobs
Week 2 applying for jobsherbison
 
Chapter 2 notes new book
Chapter 2 notes new bookChapter 2 notes new book
Chapter 2 notes new bookherbison
 
Plumbing night 2 types of plumbing businesses
Plumbing night 2   types of plumbing businessesPlumbing night 2   types of plumbing businesses
Plumbing night 2 types of plumbing businessesherbison
 
Factoring Quadratics
Factoring QuadraticsFactoring Quadratics
Factoring QuadraticsKristen T
 
7.5 graphing square root and cube root functions
7.5 graphing square root and cube root functions7.5 graphing square root and cube root functions
7.5 graphing square root and cube root functionshisema01
 
Plumbing night 1 legal forms of business
Plumbing night 1   legal forms of businessPlumbing night 1   legal forms of business
Plumbing night 1 legal forms of businessherbison
 

Viewers also liked (20)

Chapter 03
Chapter 03Chapter 03
Chapter 03
 
Mean, Median, Mode: Measures of Central Tendency
Mean, Median, Mode: Measures of Central Tendency Mean, Median, Mode: Measures of Central Tendency
Mean, Median, Mode: Measures of Central Tendency
 
Lesson 002
Lesson 002Lesson 002
Lesson 002
 
3.3 Mean, Median, Mode, Formulas
3.3 Mean, Median, Mode, Formulas3.3 Mean, Median, Mode, Formulas
3.3 Mean, Median, Mode, Formulas
 
Lesson Plan- Measures of Central tendency of Data
Lesson Plan- Measures of Central tendency of DataLesson Plan- Measures of Central tendency of Data
Lesson Plan- Measures of Central tendency of Data
 
Statistics
StatisticsStatistics
Statistics
 
Measures of central tendency
Measures of central tendencyMeasures of central tendency
Measures of central tendency
 
Standard Deviation and Variance
Standard Deviation and VarianceStandard Deviation and Variance
Standard Deviation and Variance
 
2 4 measures of center
2 4 measures of center2 4 measures of center
2 4 measures of center
 
02 quanttech-mean-variance
02 quanttech-mean-variance02 quanttech-mean-variance
02 quanttech-mean-variance
 
Summary measures
Summary measuresSummary measures
Summary measures
 
Cyberbullying class 97
Cyberbullying class 97Cyberbullying class 97
Cyberbullying class 97
 
Notes Day 6: Bernoulli Trials
Notes Day 6: Bernoulli TrialsNotes Day 6: Bernoulli Trials
Notes Day 6: Bernoulli Trials
 
Week 2 applying for jobs
Week 2 applying for jobsWeek 2 applying for jobs
Week 2 applying for jobs
 
Chapter 2 notes new book
Chapter 2 notes new bookChapter 2 notes new book
Chapter 2 notes new book
 
Plumbing night 2 types of plumbing businesses
Plumbing night 2   types of plumbing businessesPlumbing night 2   types of plumbing businesses
Plumbing night 2 types of plumbing businesses
 
Factoring Quadratics
Factoring QuadraticsFactoring Quadratics
Factoring Quadratics
 
7.5 graphing square root and cube root functions
7.5 graphing square root and cube root functions7.5 graphing square root and cube root functions
7.5 graphing square root and cube root functions
 
Cartoon
CartoonCartoon
Cartoon
 
Plumbing night 1 legal forms of business
Plumbing night 1   legal forms of businessPlumbing night 1   legal forms of business
Plumbing night 1 legal forms of business
 

Similar to Statr sessions 4 to 6

2. chapter ii(analyz)
2. chapter ii(analyz)2. chapter ii(analyz)
2. chapter ii(analyz)Chhom Karath
 
Statistics for machine learning shifa noorulain
Statistics for machine learning   shifa noorulainStatistics for machine learning   shifa noorulain
Statistics for machine learning shifa noorulainShifaNoorUlAin1
 
descriptive data analysis
 descriptive data analysis descriptive data analysis
descriptive data analysisgnanasarita1
 
Ch5-quantitative-data analysis.pptx
Ch5-quantitative-data analysis.pptxCh5-quantitative-data analysis.pptx
Ch5-quantitative-data analysis.pptxzerihunnana
 
State presentation2
State presentation2State presentation2
State presentation2Lata Bhatta
 
Business statistics
Business statisticsBusiness statistics
Business statisticsRavi Prakash
 
Basic Statistical Descriptions of Data.pptx
Basic Statistical Descriptions of Data.pptxBasic Statistical Descriptions of Data.pptx
Basic Statistical Descriptions of Data.pptxAnusuya123
 
Ch2 Data Description
Ch2 Data DescriptionCh2 Data Description
Ch2 Data DescriptionFarhan Alfin
 
MEASURE-OF-VARIABILITY- for students. Ppt
MEASURE-OF-VARIABILITY- for students. PptMEASURE-OF-VARIABILITY- for students. Ppt
MEASURE-OF-VARIABILITY- for students. PptPrincessjaynoviaKali
 
Stats-Review-Maie-St-John-5-20-2009.ppt
Stats-Review-Maie-St-John-5-20-2009.pptStats-Review-Maie-St-John-5-20-2009.ppt
Stats-Review-Maie-St-John-5-20-2009.pptDiptoKumerSarker1
 
Biostatistics mean median mode unit 1.pptx
Biostatistics mean median mode unit 1.pptxBiostatistics mean median mode unit 1.pptx
Biostatistics mean median mode unit 1.pptxSailajaReddyGunnam
 
Measures of dispersion
Measures of dispersionMeasures of dispersion
Measures of dispersionMayuri Joshi
 

Similar to Statr sessions 4 to 6 (20)

2. chapter ii(analyz)
2. chapter ii(analyz)2. chapter ii(analyz)
2. chapter ii(analyz)
 
Descriptive statistics -review(2)
Descriptive statistics -review(2)Descriptive statistics -review(2)
Descriptive statistics -review(2)
 
Statistics for machine learning shifa noorulain
Statistics for machine learning   shifa noorulainStatistics for machine learning   shifa noorulain
Statistics for machine learning shifa noorulain
 
descriptive data analysis
 descriptive data analysis descriptive data analysis
descriptive data analysis
 
Ch5-quantitative-data analysis.pptx
Ch5-quantitative-data analysis.pptxCh5-quantitative-data analysis.pptx
Ch5-quantitative-data analysis.pptx
 
determinatiion of
determinatiion of determinatiion of
determinatiion of
 
State presentation2
State presentation2State presentation2
State presentation2
 
Basic statisctis -Anandh Shankar
Basic statisctis -Anandh ShankarBasic statisctis -Anandh Shankar
Basic statisctis -Anandh Shankar
 
Business statistics
Business statisticsBusiness statistics
Business statistics
 
Res701 research methodology lecture 7 8-devaprakasam
Res701 research methodology lecture 7 8-devaprakasamRes701 research methodology lecture 7 8-devaprakasam
Res701 research methodology lecture 7 8-devaprakasam
 
Basic Statistical Descriptions of Data.pptx
Basic Statistical Descriptions of Data.pptxBasic Statistical Descriptions of Data.pptx
Basic Statistical Descriptions of Data.pptx
 
Statistics
StatisticsStatistics
Statistics
 
Ch2 Data Description
Ch2 Data DescriptionCh2 Data Description
Ch2 Data Description
 
R training4
R training4R training4
R training4
 
MEASURE-OF-VARIABILITY- for students. Ppt
MEASURE-OF-VARIABILITY- for students. PptMEASURE-OF-VARIABILITY- for students. Ppt
MEASURE-OF-VARIABILITY- for students. Ppt
 
SUMMARY MEASURES.pdf
SUMMARY MEASURES.pdfSUMMARY MEASURES.pdf
SUMMARY MEASURES.pdf
 
Stats-Review-Maie-St-John-5-20-2009.ppt
Stats-Review-Maie-St-John-5-20-2009.pptStats-Review-Maie-St-John-5-20-2009.ppt
Stats-Review-Maie-St-John-5-20-2009.ppt
 
Descriptive Analysis.pptx
Descriptive Analysis.pptxDescriptive Analysis.pptx
Descriptive Analysis.pptx
 
Biostatistics mean median mode unit 1.pptx
Biostatistics mean median mode unit 1.pptxBiostatistics mean median mode unit 1.pptx
Biostatistics mean median mode unit 1.pptx
 
Measures of dispersion
Measures of dispersionMeasures of dispersion
Measures of dispersion
 

More from Ruru Chowdhury

The One With The Wizards and Dragons. Prelims
The One With The Wizards and Dragons. PrelimsThe One With The Wizards and Dragons. Prelims
The One With The Wizards and Dragons. PrelimsRuru Chowdhury
 
The One With The Wizards and Dragons. Finals
The One With The Wizards and Dragons. FinalsThe One With The Wizards and Dragons. Finals
The One With The Wizards and Dragons. FinalsRuru Chowdhury
 
Statr session 25 and 26
Statr session 25 and 26Statr session 25 and 26
Statr session 25 and 26Ruru Chowdhury
 
Statr session 23 and 24
Statr session 23 and 24Statr session 23 and 24
Statr session 23 and 24Ruru Chowdhury
 
Statr session 21 and 22
Statr session 21 and 22Statr session 21 and 22
Statr session 21 and 22Ruru Chowdhury
 
Statr session 19 and 20
Statr session 19 and 20Statr session 19 and 20
Statr session 19 and 20Ruru Chowdhury
 
Statr session 17 and 18
Statr session 17 and 18Statr session 17 and 18
Statr session 17 and 18Ruru Chowdhury
 
Statr session 17 and 18 (ASTR)
Statr session 17 and 18 (ASTR)Statr session 17 and 18 (ASTR)
Statr session 17 and 18 (ASTR)Ruru Chowdhury
 
Statr session 15 and 16
Statr session 15 and 16Statr session 15 and 16
Statr session 15 and 16Ruru Chowdhury
 
Statr session14, Jan 11
Statr session14, Jan 11Statr session14, Jan 11
Statr session14, Jan 11Ruru Chowdhury
 
JM Statr session 13, Jan 11
JM Statr session 13, Jan 11JM Statr session 13, Jan 11
JM Statr session 13, Jan 11Ruru Chowdhury
 
Statr sessions 11 to 12
Statr sessions 11 to 12Statr sessions 11 to 12
Statr sessions 11 to 12Ruru Chowdhury
 
Nosql part1 8th December
Nosql part1 8th December Nosql part1 8th December
Nosql part1 8th December Ruru Chowdhury
 
Statr sessions 9 to 10
Statr sessions 9 to 10Statr sessions 9 to 10
Statr sessions 9 to 10Ruru Chowdhury
 

More from Ruru Chowdhury (20)

The One With The Wizards and Dragons. Prelims
The One With The Wizards and Dragons. PrelimsThe One With The Wizards and Dragons. Prelims
The One With The Wizards and Dragons. Prelims
 
The One With The Wizards and Dragons. Finals
The One With The Wizards and Dragons. FinalsThe One With The Wizards and Dragons. Finals
The One With The Wizards and Dragons. Finals
 
Statr session 25 and 26
Statr session 25 and 26Statr session 25 and 26
Statr session 25 and 26
 
Statr session 23 and 24
Statr session 23 and 24Statr session 23 and 24
Statr session 23 and 24
 
Statr session 21 and 22
Statr session 21 and 22Statr session 21 and 22
Statr session 21 and 22
 
Statr session 19 and 20
Statr session 19 and 20Statr session 19 and 20
Statr session 19 and 20
 
Statr session 17 and 18
Statr session 17 and 18Statr session 17 and 18
Statr session 17 and 18
 
Statr session 17 and 18 (ASTR)
Statr session 17 and 18 (ASTR)Statr session 17 and 18 (ASTR)
Statr session 17 and 18 (ASTR)
 
Statr session 15 and 16
Statr session 15 and 16Statr session 15 and 16
Statr session 15 and 16
 
Statr session14, Jan 11
Statr session14, Jan 11Statr session14, Jan 11
Statr session14, Jan 11
 
JM Statr session 13, Jan 11
JM Statr session 13, Jan 11JM Statr session 13, Jan 11
JM Statr session 13, Jan 11
 
Statr sessions 11 to 12
Statr sessions 11 to 12Statr sessions 11 to 12
Statr sessions 11 to 12
 
Nosql part3
Nosql part3Nosql part3
Nosql part3
 
Nosql part1 8th December
Nosql part1 8th December Nosql part1 8th December
Nosql part1 8th December
 
Nosql part 2
Nosql part 2Nosql part 2
Nosql part 2
 
Statr sessions 9 to 10
Statr sessions 9 to 10Statr sessions 9 to 10
Statr sessions 9 to 10
 
R part iii
R part iiiR part iii
R part iii
 
R part II
R part IIR part II
R part II
 
Statr sessions 7 to 8
Statr sessions 7 to 8Statr sessions 7 to 8
Statr sessions 7 to 8
 
R part I
R part IR part I
R part I
 

Recently uploaded

The basics of sentences session 2pptx copy.pptx
The basics of sentences session 2pptx copy.pptxThe basics of sentences session 2pptx copy.pptx
The basics of sentences session 2pptx copy.pptxheathfieldcps1
 
Software Engineering Methodologies (overview)
Software Engineering Methodologies (overview)Software Engineering Methodologies (overview)
Software Engineering Methodologies (overview)eniolaolutunde
 
CARE OF CHILD IN INCUBATOR..........pptx
CARE OF CHILD IN INCUBATOR..........pptxCARE OF CHILD IN INCUBATOR..........pptx
CARE OF CHILD IN INCUBATOR..........pptxGaneshChakor2
 
Call Girls in Dwarka Mor Delhi Contact Us 9654467111
Call Girls in Dwarka Mor Delhi Contact Us 9654467111Call Girls in Dwarka Mor Delhi Contact Us 9654467111
Call Girls in Dwarka Mor Delhi Contact Us 9654467111Sapana Sha
 
Introduction to ArtificiaI Intelligence in Higher Education
Introduction to ArtificiaI Intelligence in Higher EducationIntroduction to ArtificiaI Intelligence in Higher Education
Introduction to ArtificiaI Intelligence in Higher Educationpboyjonauth
 
Grant Readiness 101 TechSoup and Remy Consulting
Grant Readiness 101 TechSoup and Remy ConsultingGrant Readiness 101 TechSoup and Remy Consulting
Grant Readiness 101 TechSoup and Remy ConsultingTechSoup
 
Micromeritics - Fundamental and Derived Properties of Powders
Micromeritics - Fundamental and Derived Properties of PowdersMicromeritics - Fundamental and Derived Properties of Powders
Micromeritics - Fundamental and Derived Properties of PowdersChitralekhaTherkar
 
BASLIQ CURRENT LOOKBOOK LOOKBOOK(1) (1).pdf
BASLIQ CURRENT LOOKBOOK  LOOKBOOK(1) (1).pdfBASLIQ CURRENT LOOKBOOK  LOOKBOOK(1) (1).pdf
BASLIQ CURRENT LOOKBOOK LOOKBOOK(1) (1).pdfSoniaTolstoy
 
Arihant handbook biology for class 11 .pdf
Arihant handbook biology for class 11 .pdfArihant handbook biology for class 11 .pdf
Arihant handbook biology for class 11 .pdfchloefrazer622
 
Kisan Call Centre - To harness potential of ICT in Agriculture by answer farm...
Kisan Call Centre - To harness potential of ICT in Agriculture by answer farm...Kisan Call Centre - To harness potential of ICT in Agriculture by answer farm...
Kisan Call Centre - To harness potential of ICT in Agriculture by answer farm...Krashi Coaching
 
“Oh GOSH! Reflecting on Hackteria's Collaborative Practices in a Global Do-It...
“Oh GOSH! Reflecting on Hackteria's Collaborative Practices in a Global Do-It...“Oh GOSH! Reflecting on Hackteria's Collaborative Practices in a Global Do-It...
“Oh GOSH! Reflecting on Hackteria's Collaborative Practices in a Global Do-It...Marc Dusseiller Dusjagr
 
Concept of Vouching. B.Com(Hons) /B.Compdf
Concept of Vouching. B.Com(Hons) /B.CompdfConcept of Vouching. B.Com(Hons) /B.Compdf
Concept of Vouching. B.Com(Hons) /B.CompdfUmakantAnnand
 
SOCIAL AND HISTORICAL CONTEXT - LFTVD.pptx
SOCIAL AND HISTORICAL CONTEXT - LFTVD.pptxSOCIAL AND HISTORICAL CONTEXT - LFTVD.pptx
SOCIAL AND HISTORICAL CONTEXT - LFTVD.pptxiammrhaywood
 
MENTAL STATUS EXAMINATION format.docx
MENTAL     STATUS EXAMINATION format.docxMENTAL     STATUS EXAMINATION format.docx
MENTAL STATUS EXAMINATION format.docxPoojaSen20
 
Introduction to AI in Higher Education_draft.pptx
Introduction to AI in Higher Education_draft.pptxIntroduction to AI in Higher Education_draft.pptx
Introduction to AI in Higher Education_draft.pptxpboyjonauth
 
A Critique of the Proposed National Education Policy Reform
A Critique of the Proposed National Education Policy ReformA Critique of the Proposed National Education Policy Reform
A Critique of the Proposed National Education Policy ReformChameera Dedduwage
 
mini mental status format.docx
mini    mental       status     format.docxmini    mental       status     format.docx
mini mental status format.docxPoojaSen20
 
Science 7 - LAND and SEA BREEZE and its Characteristics
Science 7 - LAND and SEA BREEZE and its CharacteristicsScience 7 - LAND and SEA BREEZE and its Characteristics
Science 7 - LAND and SEA BREEZE and its CharacteristicsKarinaGenton
 
Sanyam Choudhary Chemistry practical.pdf
Sanyam Choudhary Chemistry practical.pdfSanyam Choudhary Chemistry practical.pdf
Sanyam Choudhary Chemistry practical.pdfsanyamsingh5019
 

Recently uploaded (20)

The basics of sentences session 2pptx copy.pptx
The basics of sentences session 2pptx copy.pptxThe basics of sentences session 2pptx copy.pptx
The basics of sentences session 2pptx copy.pptx
 
Software Engineering Methodologies (overview)
Software Engineering Methodologies (overview)Software Engineering Methodologies (overview)
Software Engineering Methodologies (overview)
 
CARE OF CHILD IN INCUBATOR..........pptx
CARE OF CHILD IN INCUBATOR..........pptxCARE OF CHILD IN INCUBATOR..........pptx
CARE OF CHILD IN INCUBATOR..........pptx
 
Call Girls in Dwarka Mor Delhi Contact Us 9654467111
Call Girls in Dwarka Mor Delhi Contact Us 9654467111Call Girls in Dwarka Mor Delhi Contact Us 9654467111
Call Girls in Dwarka Mor Delhi Contact Us 9654467111
 
Introduction to ArtificiaI Intelligence in Higher Education
Introduction to ArtificiaI Intelligence in Higher EducationIntroduction to ArtificiaI Intelligence in Higher Education
Introduction to ArtificiaI Intelligence in Higher Education
 
Grant Readiness 101 TechSoup and Remy Consulting
Grant Readiness 101 TechSoup and Remy ConsultingGrant Readiness 101 TechSoup and Remy Consulting
Grant Readiness 101 TechSoup and Remy Consulting
 
Micromeritics - Fundamental and Derived Properties of Powders
Micromeritics - Fundamental and Derived Properties of PowdersMicromeritics - Fundamental and Derived Properties of Powders
Micromeritics - Fundamental and Derived Properties of Powders
 
BASLIQ CURRENT LOOKBOOK LOOKBOOK(1) (1).pdf
BASLIQ CURRENT LOOKBOOK  LOOKBOOK(1) (1).pdfBASLIQ CURRENT LOOKBOOK  LOOKBOOK(1) (1).pdf
BASLIQ CURRENT LOOKBOOK LOOKBOOK(1) (1).pdf
 
Arihant handbook biology for class 11 .pdf
Arihant handbook biology for class 11 .pdfArihant handbook biology for class 11 .pdf
Arihant handbook biology for class 11 .pdf
 
Kisan Call Centre - To harness potential of ICT in Agriculture by answer farm...
Kisan Call Centre - To harness potential of ICT in Agriculture by answer farm...Kisan Call Centre - To harness potential of ICT in Agriculture by answer farm...
Kisan Call Centre - To harness potential of ICT in Agriculture by answer farm...
 
“Oh GOSH! Reflecting on Hackteria's Collaborative Practices in a Global Do-It...
“Oh GOSH! Reflecting on Hackteria's Collaborative Practices in a Global Do-It...“Oh GOSH! Reflecting on Hackteria's Collaborative Practices in a Global Do-It...
“Oh GOSH! Reflecting on Hackteria's Collaborative Practices in a Global Do-It...
 
Concept of Vouching. B.Com(Hons) /B.Compdf
Concept of Vouching. B.Com(Hons) /B.CompdfConcept of Vouching. B.Com(Hons) /B.Compdf
Concept of Vouching. B.Com(Hons) /B.Compdf
 
SOCIAL AND HISTORICAL CONTEXT - LFTVD.pptx
SOCIAL AND HISTORICAL CONTEXT - LFTVD.pptxSOCIAL AND HISTORICAL CONTEXT - LFTVD.pptx
SOCIAL AND HISTORICAL CONTEXT - LFTVD.pptx
 
MENTAL STATUS EXAMINATION format.docx
MENTAL     STATUS EXAMINATION format.docxMENTAL     STATUS EXAMINATION format.docx
MENTAL STATUS EXAMINATION format.docx
 
Introduction to AI in Higher Education_draft.pptx
Introduction to AI in Higher Education_draft.pptxIntroduction to AI in Higher Education_draft.pptx
Introduction to AI in Higher Education_draft.pptx
 
A Critique of the Proposed National Education Policy Reform
A Critique of the Proposed National Education Policy ReformA Critique of the Proposed National Education Policy Reform
A Critique of the Proposed National Education Policy Reform
 
mini mental status format.docx
mini    mental       status     format.docxmini    mental       status     format.docx
mini mental status format.docx
 
Código Creativo y Arte de Software | Unidad 1
Código Creativo y Arte de Software | Unidad 1Código Creativo y Arte de Software | Unidad 1
Código Creativo y Arte de Software | Unidad 1
 
Science 7 - LAND and SEA BREEZE and its Characteristics
Science 7 - LAND and SEA BREEZE and its CharacteristicsScience 7 - LAND and SEA BREEZE and its Characteristics
Science 7 - LAND and SEA BREEZE and its Characteristics
 
Sanyam Choudhary Chemistry practical.pdf
Sanyam Choudhary Chemistry practical.pdfSanyam Choudhary Chemistry practical.pdf
Sanyam Choudhary Chemistry practical.pdf
 

Statr sessions 4 to 6

  • 1. Measures of Variability: Ungrouped Data • Measures of Variability - tools that describe the spread or the dispersion of a set of data. – Provides more meaningful data when used • with measures of central tendency • in comparison to other groups
  • 2. Measures of Spread or Dispersion: Ungrouped Data • Common Measures of Variability –Range –Inter-quartile Range –Mean Absolute Deviation –Variance and Standard Deviation –Coefficient of Variation
  • 3. Range • The difference between the largest and the smallest values in a set of data – Advantage – easy to compute – Disadvantage – is affected by extreme values
  • 4. Interquartile Range • Interquartile Range - range of values between the first and third quartiles • Range of the “middle half”; middle 50% – Useful when researchers are interested in the middle 50%, and not the extremes
  • 6. Mean Absolute Deviation (MAD) • One solution is to take the absolute value of each deviation around the mean. This is called the Mean Absolute Deviation • Note that while the MAD is intuitively simple, it is rarely used in practice
  • 7. Sample Variance • Another solution is the take the Sum of Squared Deviations (SSD) about the mean • Sample Variance is the average of the squared deviations from the arithmetic mean • Sample Variance is denoted by s2 Why Sum of Squared Deviations about the mean? - Squaring deviations remove sign - The deviations are amplified
  • 8. Calculation of Sample Variance Degree of Freedom
  • 9. Sample Standard Deviation • Sample standard deviation is the square root of the sample variance • Denoted by s • Benefit: Same units as original data
  • 10. Standard Deviation: Empirical Rule If a variable is normally distributed, then: 1. Approximately 68% of the observations lie within 1 standard deviation of the mean 2. Approximately 95% of the observations lie within 2 standard deviations of the mean 3. Approximately 99.7% of the observations lie within 3 standard deviations of the mean Notes:  Also applies to populations  Can be used to determine if a distribution is normally distributed
  • 11. Standard Deviation : Empirical Rule 99.7% 95% 68% x 3s x 2s x s x x s x 2s x 3s
  • 12. A Note about the Empirical Rule Note: The empirical rule may be used to determine whether or not a set of data is approximately normally distributed 1. Find the mean and standard deviation for the data 2. Compute the actual proportion of data within 1, 2, and 3 standard deviations from the mean 3. Compare these actual proportions with those given by the empirical rule 4. If the proportions found are reasonably close to those of the empirical rule, then the data is approximately normally distributed
  • 13. z Scores • Z score – represents the number of Standard Deviation a value (x) is above or below the mean of a set of numbers when the data are normally distributed • Z score allows translation of a value’s raw distance from the mean into units of standard deviations • z-scores typically range from -3.00 to +3.00 • z-scores may be used to make comparisons of raw scores
  • 14. Coefficient of Variation (C.V.) • Coefficient of Variation (CV) – measures the volatility of a value (perhaps a stock portfolio), relative to its mean. It’s the ratio of the standard deviation to the mean, expressed as a percentage • Useful when comparing Standard Deviation is computed from data with different means • Measurement of relative dispersion
  • 15. Coefficient of Variation (C.V.) Consider two different populations Since 15.86 > 11.90, the first population is more variable, relative to its mean, than the second population
  • 16. Calculation of Grouped Mean Sometimes data are already grouped, and we are interested in calculating summary statistics Interval 20-under 30 30-under 40 40-under 50 50-under 60 60-under 70 70-under 80 Frequency (f) 6 18 11 11 3 1 50 Midpoint (M) 25 35 45 55 65 75 f*M 150 630 495 605 195 75 2150
  • 17. Median of Grouped Data - Example Class Interval 20-under 30 30-under 40 40-under 50 50-under 60 60-under 70 70-under 80 Cumulative Frequency Frequency 6 6 18 24 11 35 11 46 3 49 1 50 N = 50
  • 18. Mode of Grouped Data Class Interval 20-under 30 30-under 40 40-under 50 50-under 60 60-under 70 70-under 80 Frequency 6 18 11 11 3 1 • Mode : Midpoint of the modal class • Modal class : the class with greatest frequency
  • 19. Variance and Standard Deviation of Grouped Data
  • 20. Variance and Standard Deviation of Grouped Data Class Interval 20-under 30 30-under 40 40-under 50 50-under 60 60-under 70 70-under 80 f M fM 6 18 11 11 3 1 50 25 35 45 55 65 75 150 630 495 605 195 75 2150 M -18 -8 2 12 22 32 M 324 64 4 144 484 1024 2 2 f M 1944 1152 44 1584 1452 1024 7200
  • 21. Measures of Shape - Skewness • Symmetrical – the right half is a mirror image of the left half • Skewed – shows that the distribution lacks symmetry; used to denote the data is sparse at one end, and piled at the other end – Absence of symmetry – Extreme values or “tail” in one side of a distribution – Positively- or right-skewed vs. negatively- or left-skewed
  • 22. 0.00 0.00 0.05 0.05 y y 0.10 0.10 0.15 0.15 Measures of Shape - Skewness 0 5 10 x 15 20 0 5 10 15 x Positively- or right-skewed vs. negatively- or left-skewed 20
  • 24. Box-and-Whisker Plot A graphic representation of the 5-number summary: • The five numerical values (smallest, first quartile, median, third quartile, and largest) are located on a scale, either vertical or horizontal • The box is used to depict the middle half of the data that lies between the two quartiles • The whiskers are line segments used to depict the other half of the data • One line segment represents the quarter of the data that is smaller in value than the first quartile • The second line segment represents the quarter of the data that is larger in value than the third quartile
  • 25. Example: Box-and-Whisker Plot Example: A random sample of students in a sixth grade class was selected. Their weights are given in the table below. Find the 5number summary for this data and construct a boxplot: 63 64 76 76 81 83 90 91 92 93 93 93 99 101 108 109 112 63 L 85 Q1 92 ~ x 85 94 99 Q3 86 97 88 99 112 H 89 99
  • 26. Example: Box-and-Whisker Plot Weights from Sixth Grade Class 60 70 80 90 100 110 Weight L Q1 ~ x Q3 H