Download to read offline
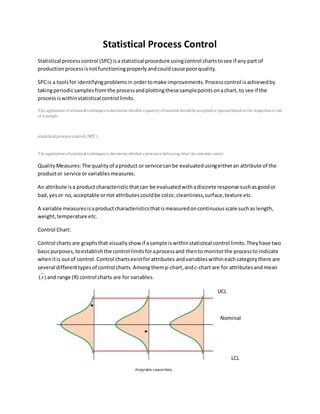

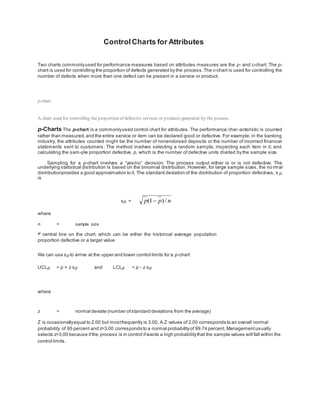
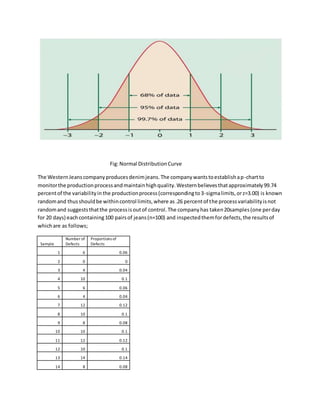
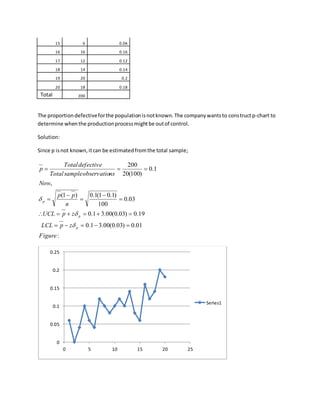
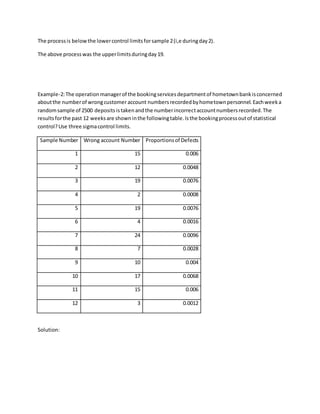
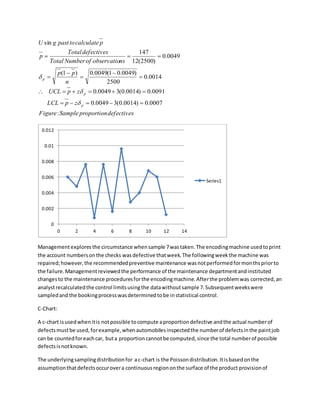
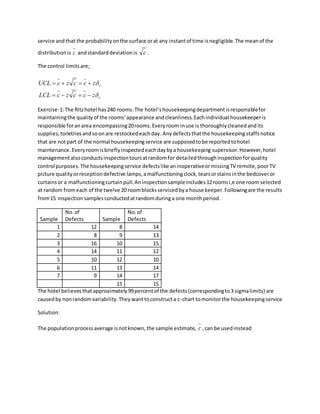
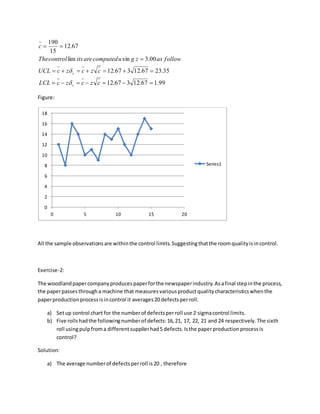
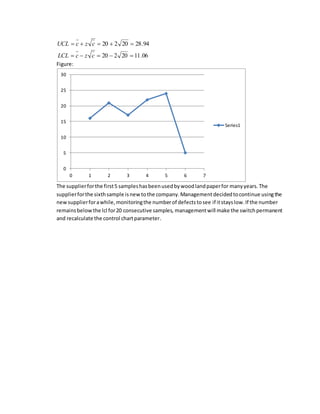

The document discusses statistical process control (SPC) and various quality control charts used to monitor processes and identify sources of variation. It provides information on: 1) SPC uses control charts to monitor key process parameters and determine whether the production process is functioning properly or causing poor quality. 2) Control charts have limits calculated from sample data that indicate whether the process is in or out of statistical control. Different charts exist for attributes and variables. 3) Examples show how to construct p-charts and c-charts from sample data and determine if the process is within control limits based on the samples.


![Chapter9[1]](https://cdn.slidesharecdn.com/ss_thumbnails/chapter91-140613050946-phpapp02-thumbnail.jpg?width=640&height=640&fit=bounds)


![Production & Operation Management Chapter9[1]](https://cdn.slidesharecdn.com/ss_thumbnails/chapter91-140613051446-phpapp02-thumbnail.jpg?width=640&height=640&fit=bounds)