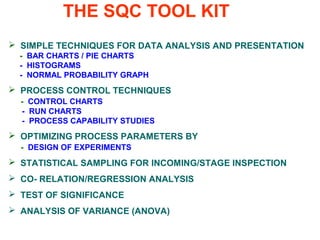
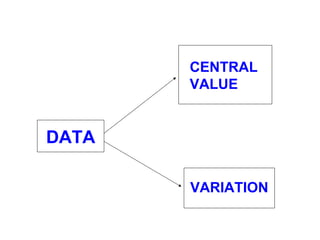
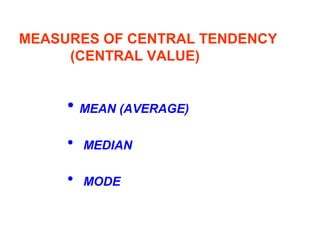
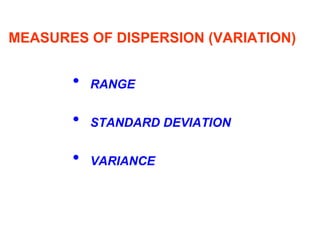
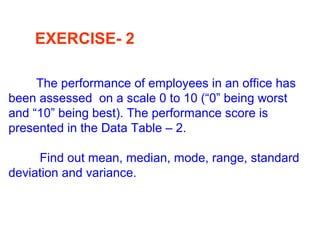
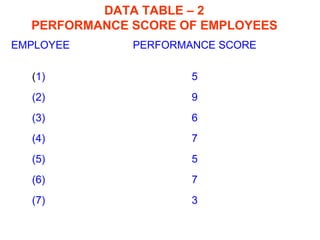
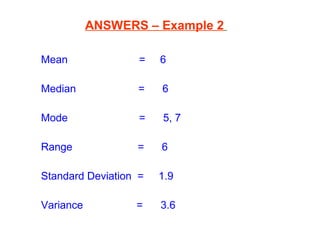
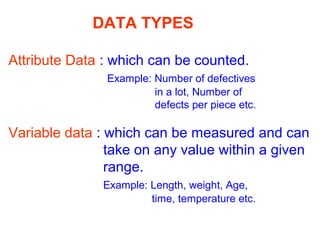
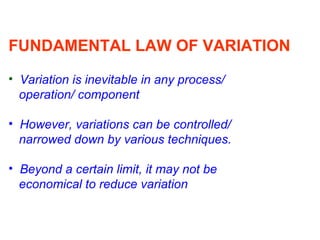
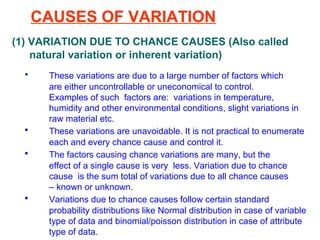
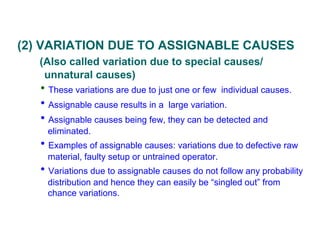
STATISTICAL QUALITY CONTROL
A presentation by
THE SOCIETY
OF
STATISTICAL QUALITY CONTROL ENGINEERS
BHOPAL
WHAT IS SQC ?
Quality Control based upon principles
of statistics is Statistical Quality Control
(SQC)
WHAT IS QUALITY CONTROL?
Quality Control is set of activities directed towards:
(i) Ensuring conformance to specifications at all stages
from procurement to despatch.
(i) Preventing defects.
Thus, Quality Control has the dual responsibilities of
detection as well as prevention.
WHAT IS STATISTICS?
STATISTICS is science of DATA
IT INVOLVES - Collection }
- Analysis } of DATA
- Interpretation }
DATA - Collection of numerical values
ORIGIN OF SQC
Origin of SQC can be traced back to 1920s with the
lead role played by Bell Telephone Laboratories,
USA. In 1924, W.A. Shewhart of Bell Telephone
presented his first control chart, also known as
shewhart chart after his name. This was followed by
publication of first statistical sampling tables by HF
Dodge and HG Romig, also from Bell Telephone
Laboratories.
DEVELOPMENT OF SQC
 Though born in the USA, widespread
application and success of SQC took place
in Japan after world war II.
 W.E. Deming and Joseph Juran – both
Quality consultants from America made
enormous contribution towards spread of
SQC in Japan which finally helped Japan in
achieving leadership in Quality. Later, SQC
spread to other parts of world.
 Today, SQC is the backbone of modern
quality management.
SQC ADVANTAGES
(1) SQC is prevention oriented
(2) SQC is data based and therefore helps in
objective assessment of quality
(3) SQC helps improve process yield by optimizing
the process.
(4) SQC provides a logical method for determining
“capability” of machines/equipment/processes
(5) SQC provides a scientific footing for sampling
inspection.
THE SQC TOOL KIT
 SIMPLE TECHNIQUES FOR DATA ANALYSIS AND PRESENTATION
- BAR CHARTS / PIE CHARTS
- HISTOGRAMS
- NORMAL PROBABILITY GRAPH
 PROCESS CONTROL TECHNIQUES
- CONTROL CHARTS
- RUN CHARTS
- PROCESS CAPABILITY STUDIES
 OPTIMIZING PROCESS PARAMETERS BY
- DESIGN OF EXPERIMENTS
 STATISTICAL SAMPLING FOR INCOMING/STAGE INSPECTION
 CO- RELATION/REGRESSION ANALYSIS
 TEST OF SIGNIFICANCE
 ANALYSIS OF VARIANCE (ANOVA)
STATISTICS
BASICS
DATA
VARIATION
CENTRAL
VALUE
MEASURES OF CENTRAL TENDENCY
(CENTRAL VALUE)
• MEAN (AVERAGE)
• MEDIAN
• MODE
MEASURES OF DISPERSION (VARIATION)
• RANGE
• STANDARD DEVIATION
• VARIANCE
EXAMPLE -1
The table shows weights of 10 samples taken
from a bulk lot of a chemical (volume of each
sample is constant).
FIND OUT MEASURES OF CENTRAL TENDENCY
AND MEASURES OF DISPERSION
DATA TABLE -1
SAMPLE
NUMBER
WEIGHT IN GRAMMES
(1) 6
(2) 2
(3) 6
(4) 3
(5) 6
(6) 9
(7) 3
(8) 4
(9) 5
(10) 6
DETERMINING AVERAGE
AVERAGE = ∑x/n
= 6+2+6+3+6+9+3+4+5+6
10
= 50/10
= 5 gms
DETERMINING MEDIAN
After arranging the values in ascending order, we have:
2, 3, 3, 4, 5, 6, 6, 6, 6, 9 (EVEN “n”)
Median = Middle value if “n” is ODD
= Average of the two middle values if “n” is EVEN
(n = No. of observations)
MEDIAN = (5+6)/2= 5.5 gms
DETERMINING MODE
MODE = Observation occurring most
frequently
= 6
DETERMINING RANGE
Range = Maximum weight – Minimum weight
= 9 – 2
= 7 gms
DETERMINING STANDARD DEVIATION AND VARIANCE
x (x – x) (x – x)²
6 + 1 1
2 - 3 9
6 + 1 1
3 - 2 4
6 + 1 1
9 + 4 16
3 - 2 4
4 - 1 1
5 0 0
6 + 1 1
∑ 50 38
CALCULATION OF STANDARD DEVIATION
AND VARIANCE
STANDARD DEVIATION FOR SAMPLE
“ ” = ∑ (X-X)²/(n-1)
STANDARD DEVIATION FOR POPULATION
“σ” = ∑ (X-X)²/n
STANDARD DEVIATION ( SAMPLE), “ ” = 38/9= 4.2
= 2.05 gms
VARIANCE = (Std. Deviation)² = 4.2
EXERCISE- 2
The performance of employees in an office has
been assessed on a scale 0 to 10 (“0” being worst
and “10” being best). The performance score is
presented in the Data Table – 2.
Find out mean, median, mode, range, standard
deviation and variance.
DATA TABLE – 2
PERFORMANCE SCORE OF EMPLOYEES
EMPLOYEE PERFORMANCE SCORE
(1)
(2)
(3)
(4)
(5)
(6)
(7)
5
9
6
7
5
7
3
ANSWERS – Example 2
Mean = 6
Median = 6
Mode = 5, 7
Range = 6
Standard Deviation = 1.9
Variance = 3.6
SQC BASICS
DATA TYPES
Attribute Data : which can be counted.
Example: Number of defectives
in a lot, Number of
defects per piece etc.
Variable data : which can be measured and can
take on any value within a given
range.
Example: Length, weight, Age,
time, temperature etc.
FUNDAMENTAL LAW OF VARIATION
• Variation is inevitable in any process/
operation/ component
• However, variations can be controlled/
narrowed down by various techniques.
• Beyond a certain limit, it may not be
economical to reduce variation
CAUSES OF VARIATION
(1) VARIATION DUE TO CHANCE CAUSES (Also called
natural variation or inherent variation)
• These variations are due to a large number of factors which
are either uncontrollable or uneconomical to control.
Examples of such factors are: variations in temperature,
humidity and other environmental conditions, slight variations in
raw material etc.
• These variations are unavoidable. It is not practical to enumerate
each and every chance cause and control it.
• The factors causing chance variations are many, but the
effect of a single cause is very less. Variation due to chance
cause is the sum total of variations due to all chance causes
– known or unknown.
• Variations due to chance causes follow certain standard
probability distributions like Normal distribution in case of variable
type of data and binomial/poisson distribution in case of attribute
type of data.
(2) VARIATION DUE TO ASSIGNABLE CAUSES
(Also called variation due to special causes/
unnatural causes)
• These variations are due to just one or few individual causes.
• Assignable cause results in a large variation.
• Assignable causes being few, they can be detected and
eliminated.
• Examples of assignable causes: variations due to defective raw
material, faulty setup or untrained operator.
• Variations due to assignable causes do not follow any probability
distribution and hence they can easily be “singled out” from
chance variations.
A word of caution
SQC techniques should never be seen as end in
themselves. The aim should be to solve the problem and
achieve desired results rather than apply a particular tool /
technique.
The approach should be result oriented rather than tool
oriented.
STATISTICAL QUALITY CONTROL

STATISTICAL QUALITY CONTROL

  • 1.
    STATISTICAL QUALITY CONTROL Apresentation by THE SOCIETY OF STATISTICAL QUALITY CONTROL ENGINEERS BHOPAL
  • 2.
    WHAT IS SQC? Quality Control based upon principles of statistics is Statistical Quality Control (SQC)
  • 3.
    WHAT IS QUALITYCONTROL? Quality Control is set of activities directed towards: (i) Ensuring conformance to specifications at all stages from procurement to despatch. (i) Preventing defects. Thus, Quality Control has the dual responsibilities of detection as well as prevention.
  • 4.
    WHAT IS STATISTICS? STATISTICSis science of DATA IT INVOLVES - Collection } - Analysis } of DATA - Interpretation } DATA - Collection of numerical values
  • 5.
    ORIGIN OF SQC Originof SQC can be traced back to 1920s with the lead role played by Bell Telephone Laboratories, USA. In 1924, W.A. Shewhart of Bell Telephone presented his first control chart, also known as shewhart chart after his name. This was followed by publication of first statistical sampling tables by HF Dodge and HG Romig, also from Bell Telephone Laboratories.
  • 6.
    DEVELOPMENT OF SQC Though born in the USA, widespread application and success of SQC took place in Japan after world war II.  W.E. Deming and Joseph Juran – both Quality consultants from America made enormous contribution towards spread of SQC in Japan which finally helped Japan in achieving leadership in Quality. Later, SQC spread to other parts of world.  Today, SQC is the backbone of modern quality management.
  • 7.
    SQC ADVANTAGES (1) SQCis prevention oriented (2) SQC is data based and therefore helps in objective assessment of quality (3) SQC helps improve process yield by optimizing the process. (4) SQC provides a logical method for determining “capability” of machines/equipment/processes (5) SQC provides a scientific footing for sampling inspection.
  • 8.
    THE SQC TOOLKIT  SIMPLE TECHNIQUES FOR DATA ANALYSIS AND PRESENTATION - BAR CHARTS / PIE CHARTS - HISTOGRAMS - NORMAL PROBABILITY GRAPH  PROCESS CONTROL TECHNIQUES - CONTROL CHARTS - RUN CHARTS - PROCESS CAPABILITY STUDIES  OPTIMIZING PROCESS PARAMETERS BY - DESIGN OF EXPERIMENTS  STATISTICAL SAMPLING FOR INCOMING/STAGE INSPECTION  CO- RELATION/REGRESSION ANALYSIS  TEST OF SIGNIFICANCE  ANALYSIS OF VARIANCE (ANOVA)
  • 9.
  • 10.
  • 11.
    MEASURES OF CENTRALTENDENCY (CENTRAL VALUE) • MEAN (AVERAGE) • MEDIAN • MODE
  • 12.
    MEASURES OF DISPERSION(VARIATION) • RANGE • STANDARD DEVIATION • VARIANCE
  • 13.
    EXAMPLE -1 The tableshows weights of 10 samples taken from a bulk lot of a chemical (volume of each sample is constant). FIND OUT MEASURES OF CENTRAL TENDENCY AND MEASURES OF DISPERSION
  • 14.
    DATA TABLE -1 SAMPLE NUMBER WEIGHTIN GRAMMES (1) 6 (2) 2 (3) 6 (4) 3 (5) 6 (6) 9 (7) 3 (8) 4 (9) 5 (10) 6
  • 15.
    DETERMINING AVERAGE AVERAGE =∑x/n = 6+2+6+3+6+9+3+4+5+6 10 = 50/10 = 5 gms
  • 16.
    DETERMINING MEDIAN After arrangingthe values in ascending order, we have: 2, 3, 3, 4, 5, 6, 6, 6, 6, 9 (EVEN “n”) Median = Middle value if “n” is ODD = Average of the two middle values if “n” is EVEN (n = No. of observations) MEDIAN = (5+6)/2= 5.5 gms
  • 17.
    DETERMINING MODE MODE =Observation occurring most frequently = 6
  • 18.
    DETERMINING RANGE Range =Maximum weight – Minimum weight = 9 – 2 = 7 gms
  • 19.
    DETERMINING STANDARD DEVIATIONAND VARIANCE x (x – x) (x – x)² 6 + 1 1 2 - 3 9 6 + 1 1 3 - 2 4 6 + 1 1 9 + 4 16 3 - 2 4 4 - 1 1 5 0 0 6 + 1 1 ∑ 50 38
  • 20.
    CALCULATION OF STANDARDDEVIATION AND VARIANCE STANDARD DEVIATION FOR SAMPLE “ ” = ∑ (X-X)²/(n-1) STANDARD DEVIATION FOR POPULATION “σ” = ∑ (X-X)²/n STANDARD DEVIATION ( SAMPLE), “ ” = 38/9= 4.2 = 2.05 gms VARIANCE = (Std. Deviation)² = 4.2
  • 21.
    EXERCISE- 2 The performanceof employees in an office has been assessed on a scale 0 to 10 (“0” being worst and “10” being best). The performance score is presented in the Data Table – 2. Find out mean, median, mode, range, standard deviation and variance.
  • 22.
    DATA TABLE –2 PERFORMANCE SCORE OF EMPLOYEES EMPLOYEE PERFORMANCE SCORE (1) (2) (3) (4) (5) (6) (7) 5 9 6 7 5 7 3
  • 23.
    ANSWERS – Example2 Mean = 6 Median = 6 Mode = 5, 7 Range = 6 Standard Deviation = 1.9 Variance = 3.6
  • 24.
  • 25.
    DATA TYPES Attribute Data: which can be counted. Example: Number of defectives in a lot, Number of defects per piece etc. Variable data : which can be measured and can take on any value within a given range. Example: Length, weight, Age, time, temperature etc.
  • 26.
    FUNDAMENTAL LAW OFVARIATION • Variation is inevitable in any process/ operation/ component • However, variations can be controlled/ narrowed down by various techniques. • Beyond a certain limit, it may not be economical to reduce variation
  • 27.
    CAUSES OF VARIATION (1)VARIATION DUE TO CHANCE CAUSES (Also called natural variation or inherent variation) • These variations are due to a large number of factors which are either uncontrollable or uneconomical to control. Examples of such factors are: variations in temperature, humidity and other environmental conditions, slight variations in raw material etc. • These variations are unavoidable. It is not practical to enumerate each and every chance cause and control it. • The factors causing chance variations are many, but the effect of a single cause is very less. Variation due to chance cause is the sum total of variations due to all chance causes – known or unknown. • Variations due to chance causes follow certain standard probability distributions like Normal distribution in case of variable type of data and binomial/poisson distribution in case of attribute type of data.
  • 28.
    (2) VARIATION DUETO ASSIGNABLE CAUSES (Also called variation due to special causes/ unnatural causes) • These variations are due to just one or few individual causes. • Assignable cause results in a large variation. • Assignable causes being few, they can be detected and eliminated. • Examples of assignable causes: variations due to defective raw material, faulty setup or untrained operator. • Variations due to assignable causes do not follow any probability distribution and hence they can easily be “singled out” from chance variations.
  • 30.
    A word ofcaution SQC techniques should never be seen as end in themselves. The aim should be to solve the problem and achieve desired results rather than apply a particular tool / technique. The approach should be result oriented rather than tool oriented.