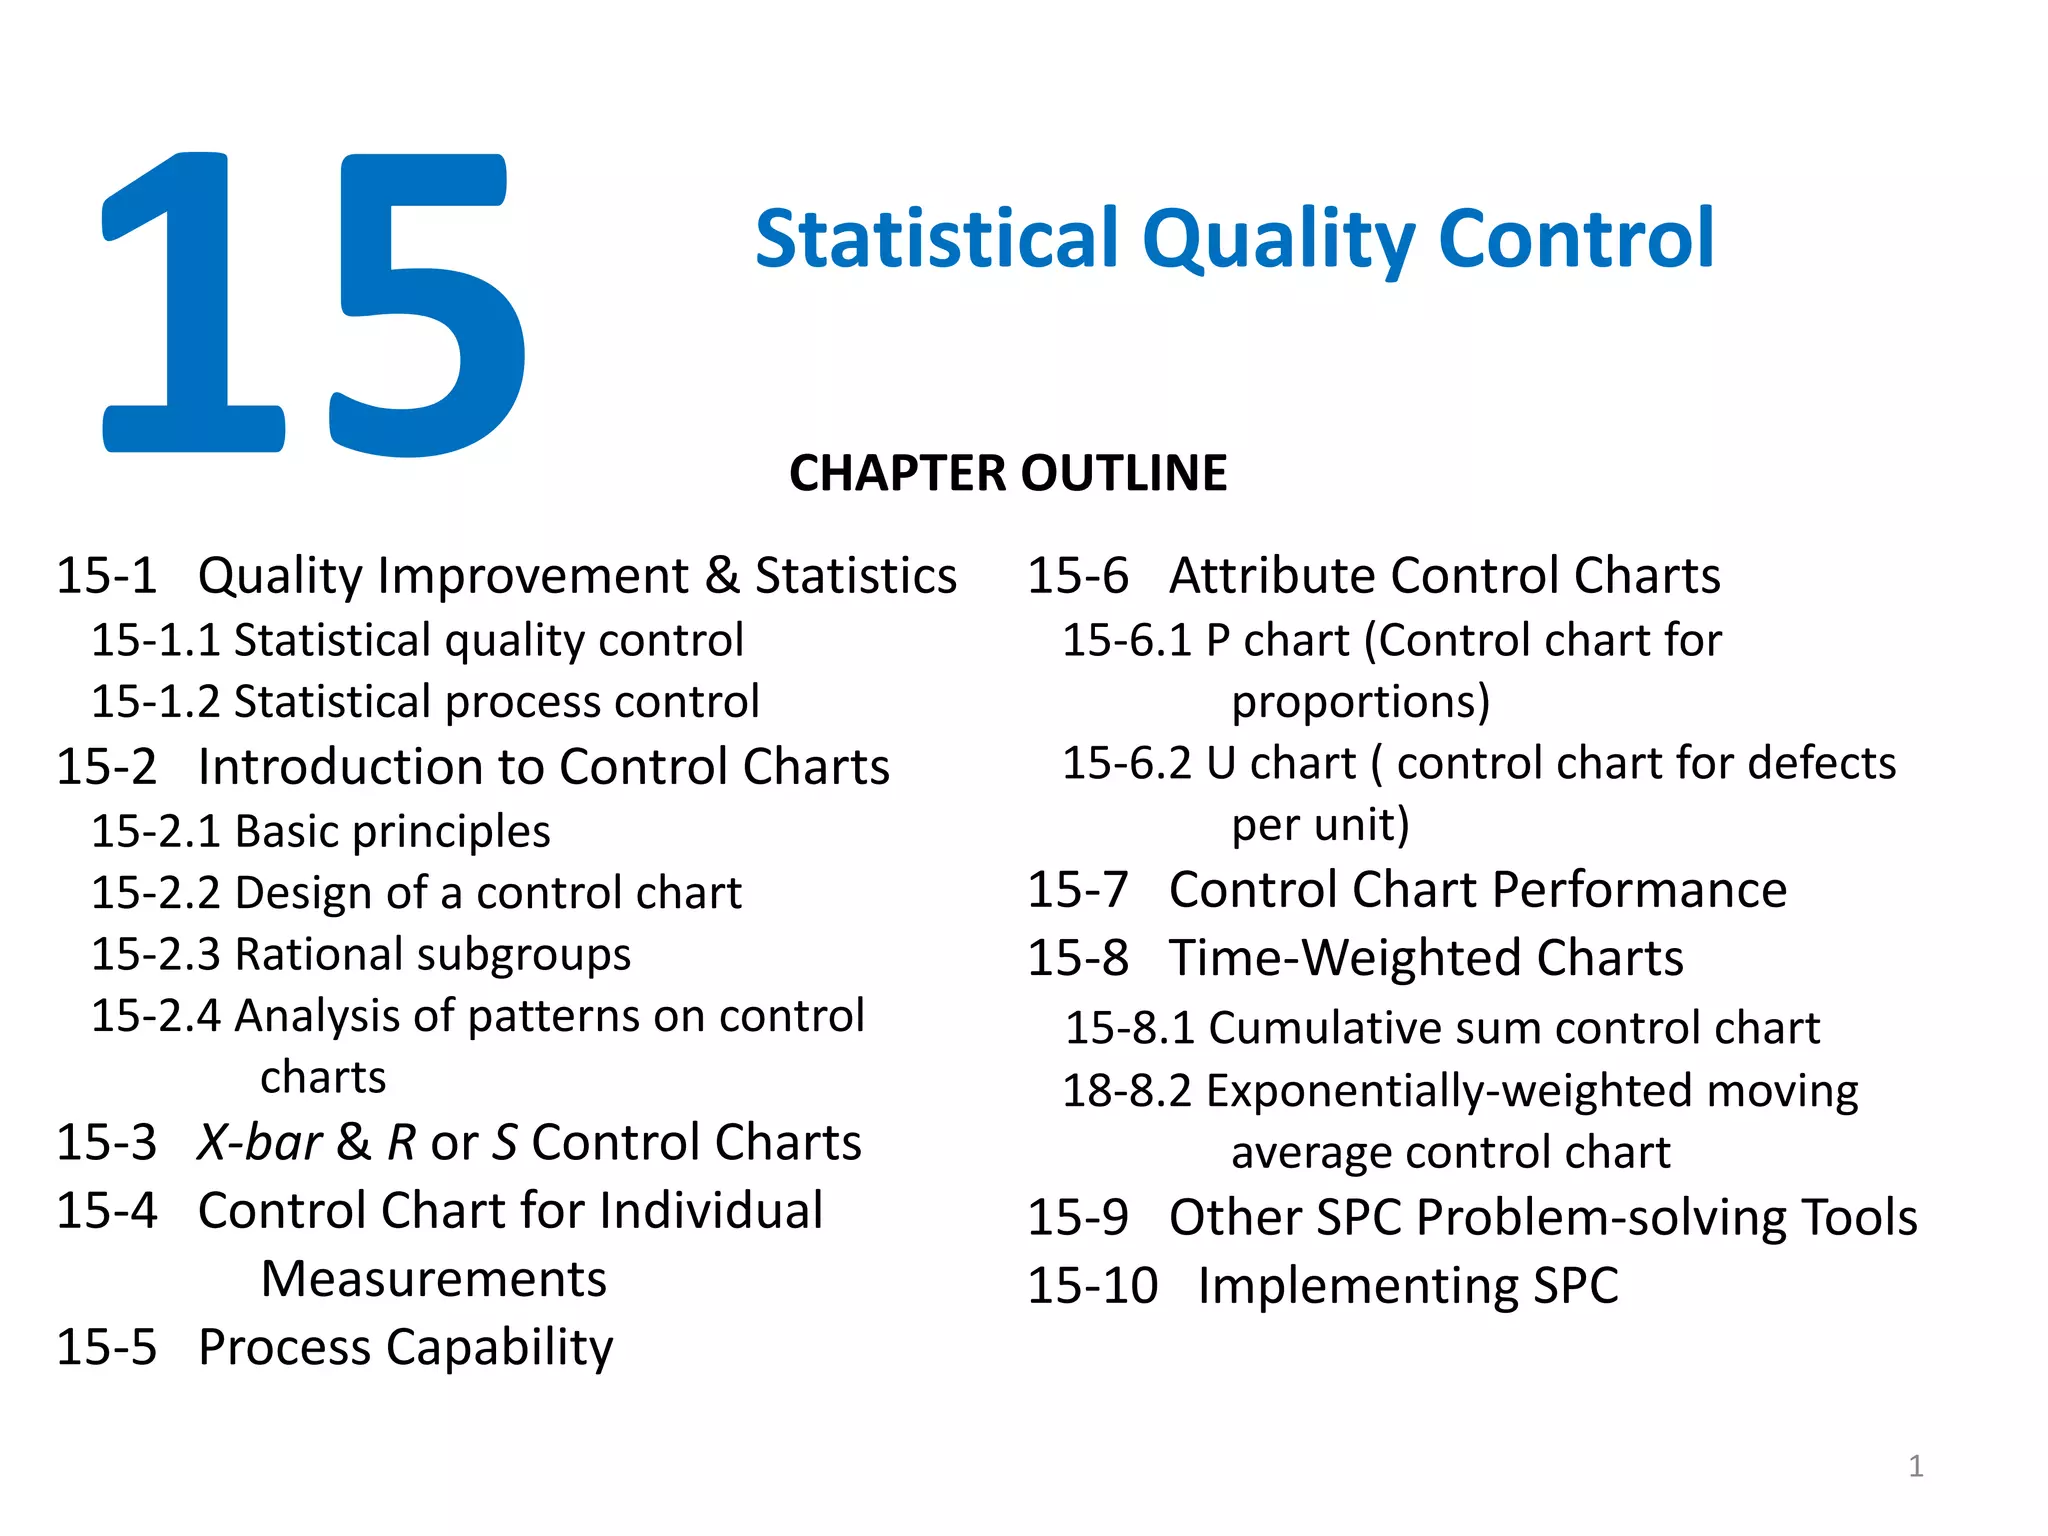
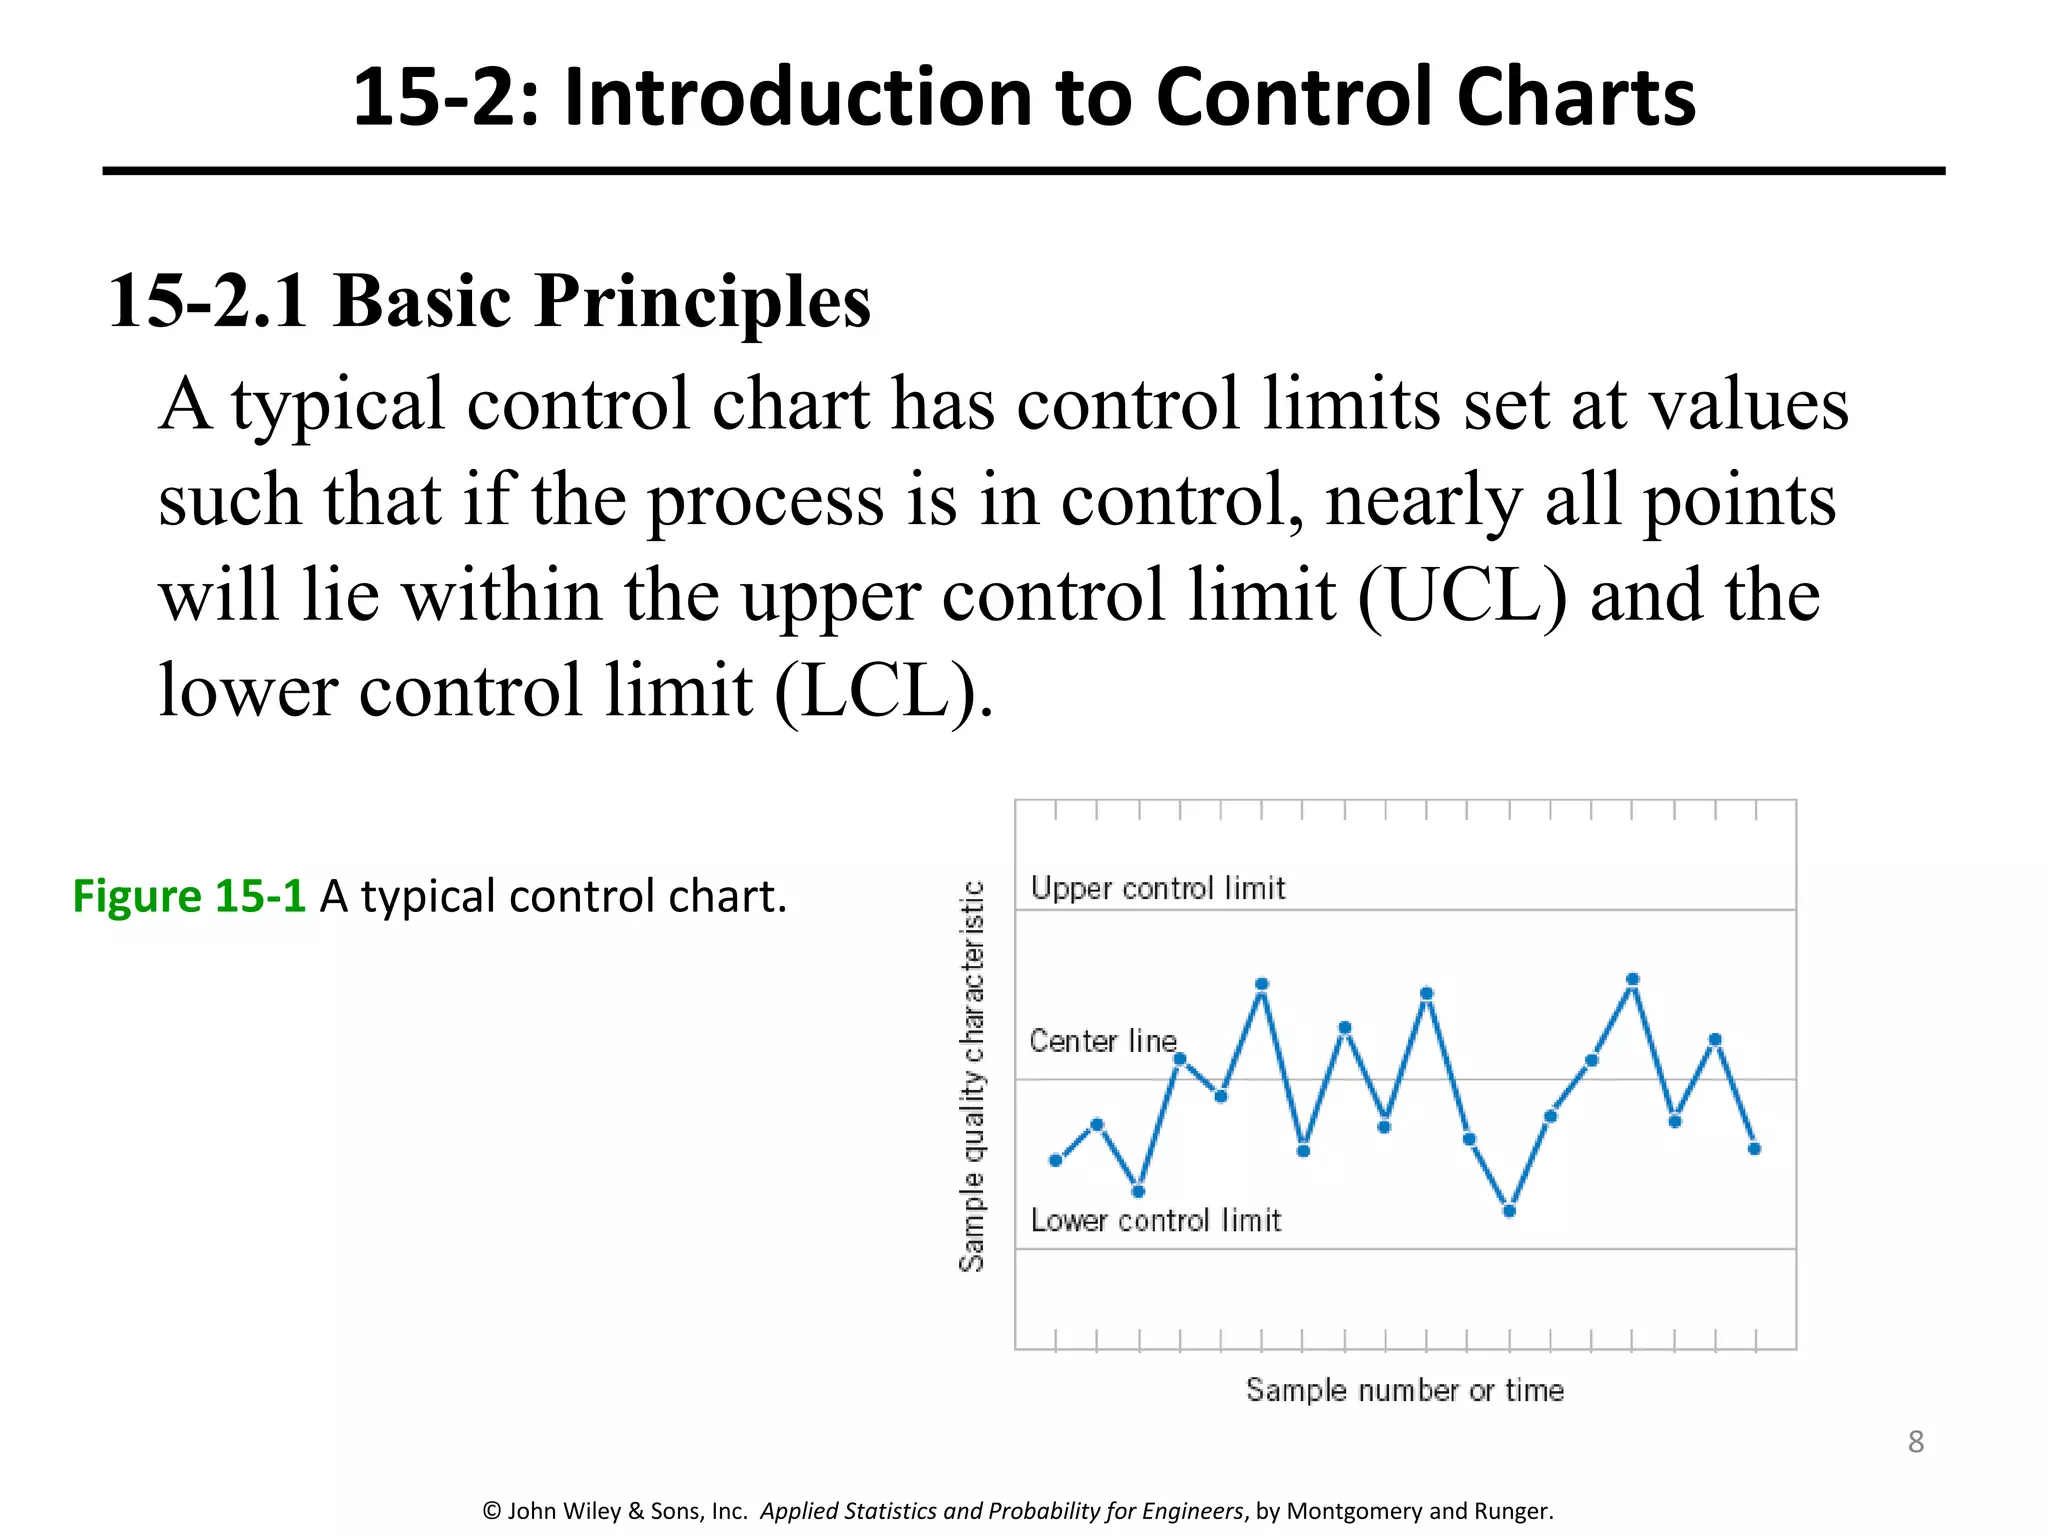
This chapter outline describes statistical quality control tools including control charts. Control charts are used to detect assignable causes of variation and improve process stability. The document defines key control chart terminology like rational subgroups and patterns. It provides examples of variable control charts like X-bar and R charts and attribute charts like P and U charts. Process capability is also discussed along with ratios to quantify how close a process operates to specification limits. The goal of these statistical quality control methods is reduction of process variability through detection and elimination of assignable causes.


![Control Charts[1]](https://cdn.slidesharecdn.com/ss_thumbnails/controlcharts1-1226081330857138-9-thumbnail.jpg?width=640&height=640&fit=bounds)


![Control Charts[1]](https://cdn.slidesharecdn.com/ss_thumbnails/controlcharts1-1226961283054520-8-thumbnail.jpg?width=640&height=640&fit=bounds)
![Control charts[1]](https://cdn.slidesharecdn.com/ss_thumbnails/controlcharts1-100924110931-phpapp01-thumbnail.jpg?width=640&height=640&fit=bounds)