Downloaded 158 times
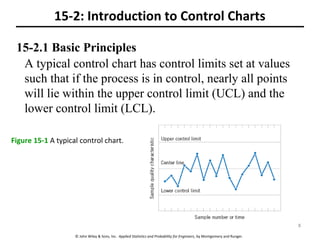
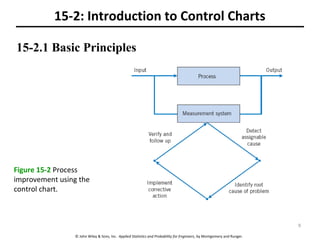
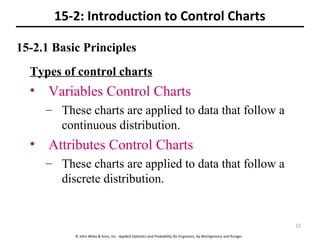
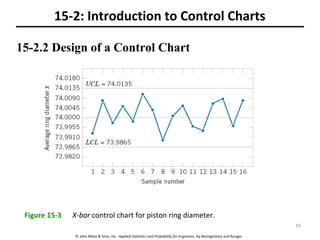
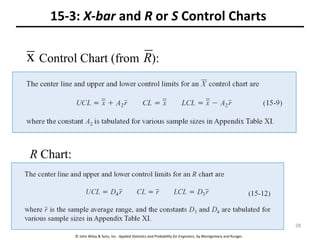
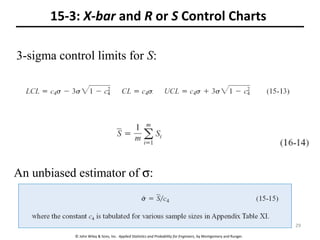
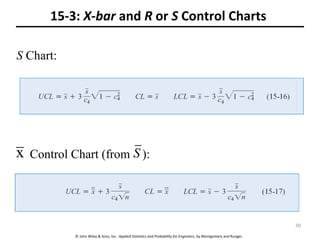
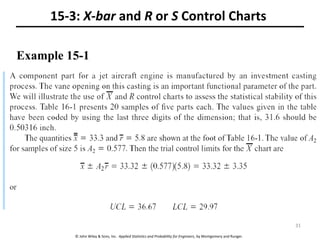
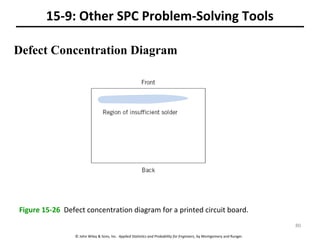
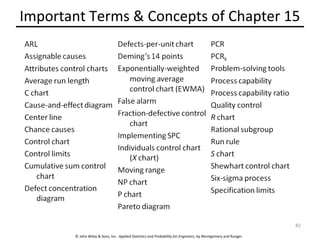

This chapter discusses statistical quality control and control charts. It covers the following key points: 1. Statistical process control uses tools like control charts to reduce variability and identify assignable causes of variation. 2. Control charts monitor a process over time and detect when the process moves out of the state of statistical control. 3. There are variables and attributes control charts. Variables charts like X-bar and R charts are for continuous data, while attributes charts like P and U charts are for discrete data. 4. Rational subgrouping aims to maximize differences between subgroups while minimizing within-subgroup differences to better detect assignable causes.


![Acceptance Sampling[1]](https://cdn.slidesharecdn.com/ss_thumbnails/acceptancesampling1-1226078569232381-9-thumbnail.jpg?width=640&height=640&fit=bounds)


![Control Charts[1]](https://cdn.slidesharecdn.com/ss_thumbnails/controlcharts1-1226081330857138-9-thumbnail.jpg?width=640&height=640&fit=bounds)


![Control Charts[1]](https://cdn.slidesharecdn.com/ss_thumbnails/controlcharts1-1226961283054520-8-thumbnail.jpg?width=640&height=640&fit=bounds)
![Control charts[1]](https://cdn.slidesharecdn.com/ss_thumbnails/controlcharts1-100924110931-phpapp01-thumbnail.jpg?width=640&height=640&fit=bounds)


![Getting Started with Apache Spark: Big Data Made Simple [Free Meetup]](https://cdn.slidesharecdn.com/ss_thumbnails/apachesparkgettingstarted-260203175547-8361bcc3-thumbnail.jpg?width=640&height=640&fit=bounds)


