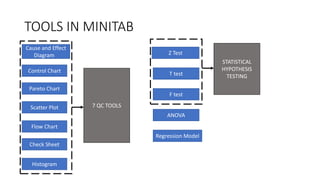
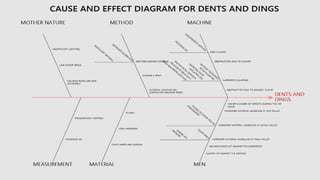
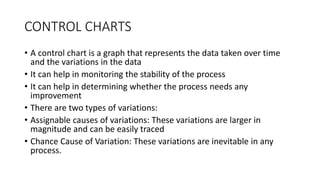
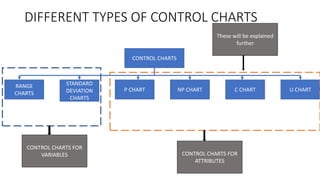
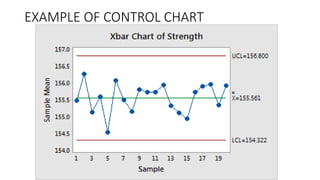
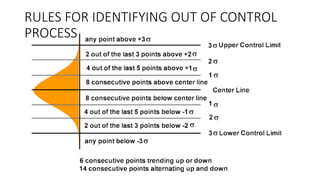
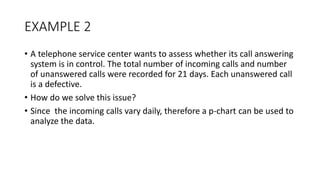
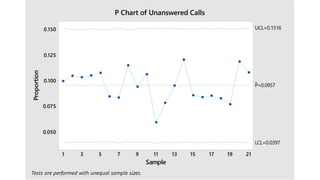
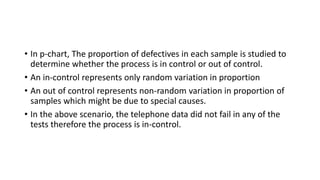
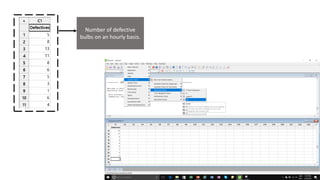
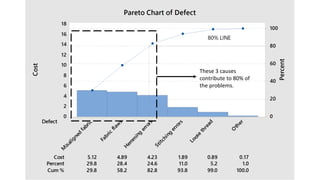
This document provides an overview of using Minitab software to perform six sigma analysis. It discusses key tools in Minitab like cause and effect diagrams, control charts, pareto charts, and various statistical tests. Examples are given to demonstrate how to use these tools to analyze data from various industrial processes and identify sources of variation or defects. Control charts can be used to determine if a process is in or out of control, while other tools like pareto charts and regression can help identify the most influential factors. Minitab is a useful statistical package that can play an important role in six sigma improvement projects.
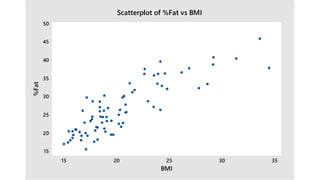


![Oc Curves[1]](https://cdn.slidesharecdn.com/ss_thumbnails/occurves1-1226090108328626-9-thumbnail.jpg?width=640&height=640&fit=bounds)