Downloaded 53 times

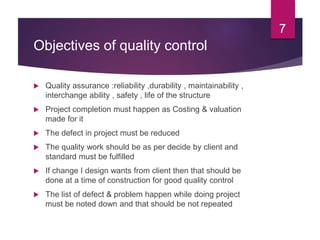
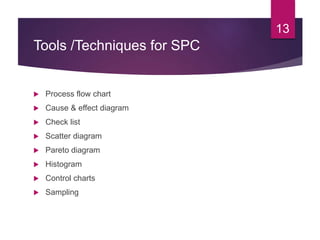
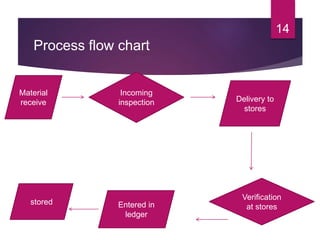
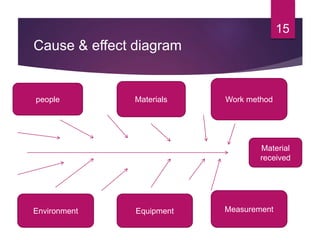
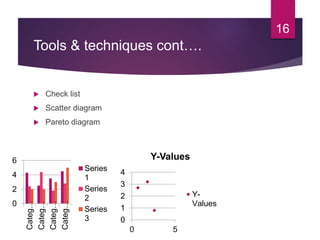
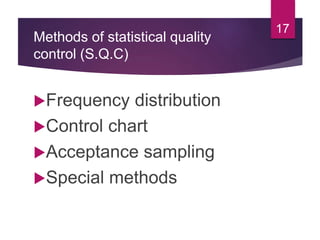
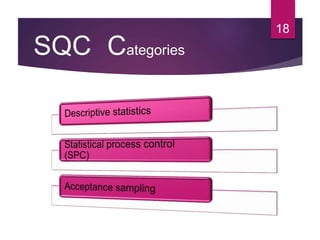
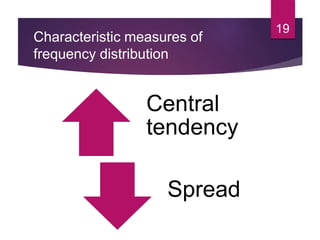
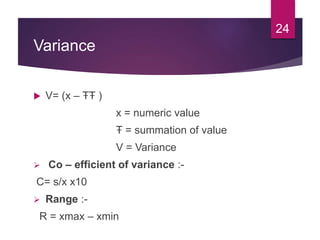
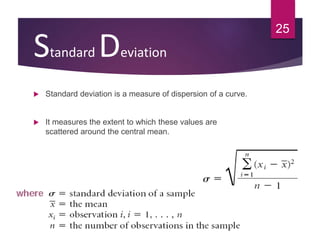
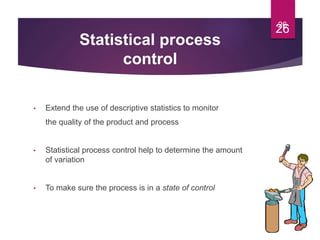
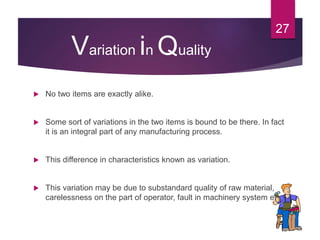
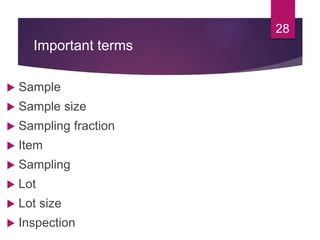
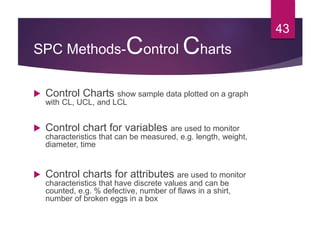
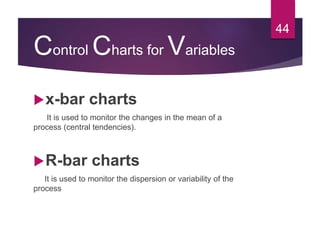
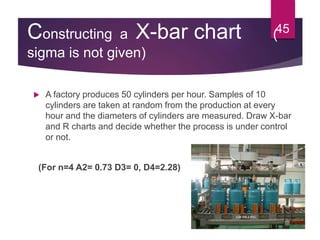
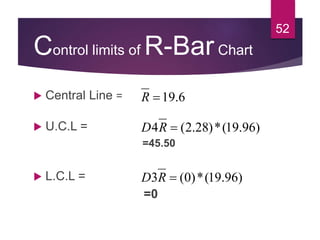
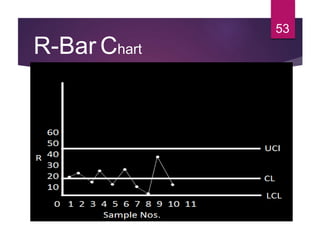
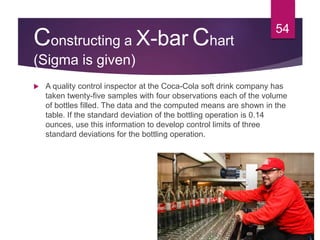
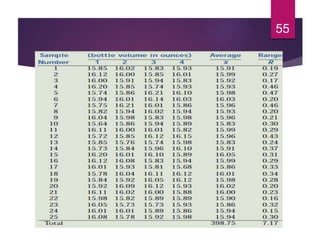


This document discusses statistical quality control and monitoring. It defines key terms like quality, quality control, statistical quality control, variables, attributes, and control limits. It describes the objectives of quality control as assuring reliability, durability, safety and meeting project requirements. Statistical process control tools like control charts, flow charts and sampling are explained. Common and assignable causes of variation are differentiated. Descriptive statistics used to characterize processes like mean, median, mode, variance and standard deviation are outlined. Control charts are identified as methods to monitor variables and attributes. Examples of X-bar and R charts are provided.


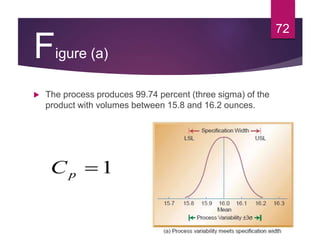
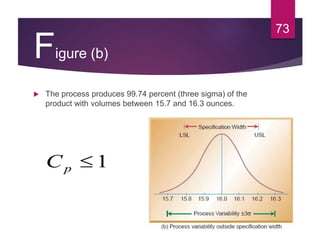
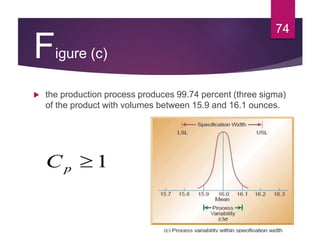
![Control Charts[1]](https://cdn.slidesharecdn.com/ss_thumbnails/controlcharts1-1226081330857138-9-thumbnail.jpg?width=640&height=640&fit=bounds)