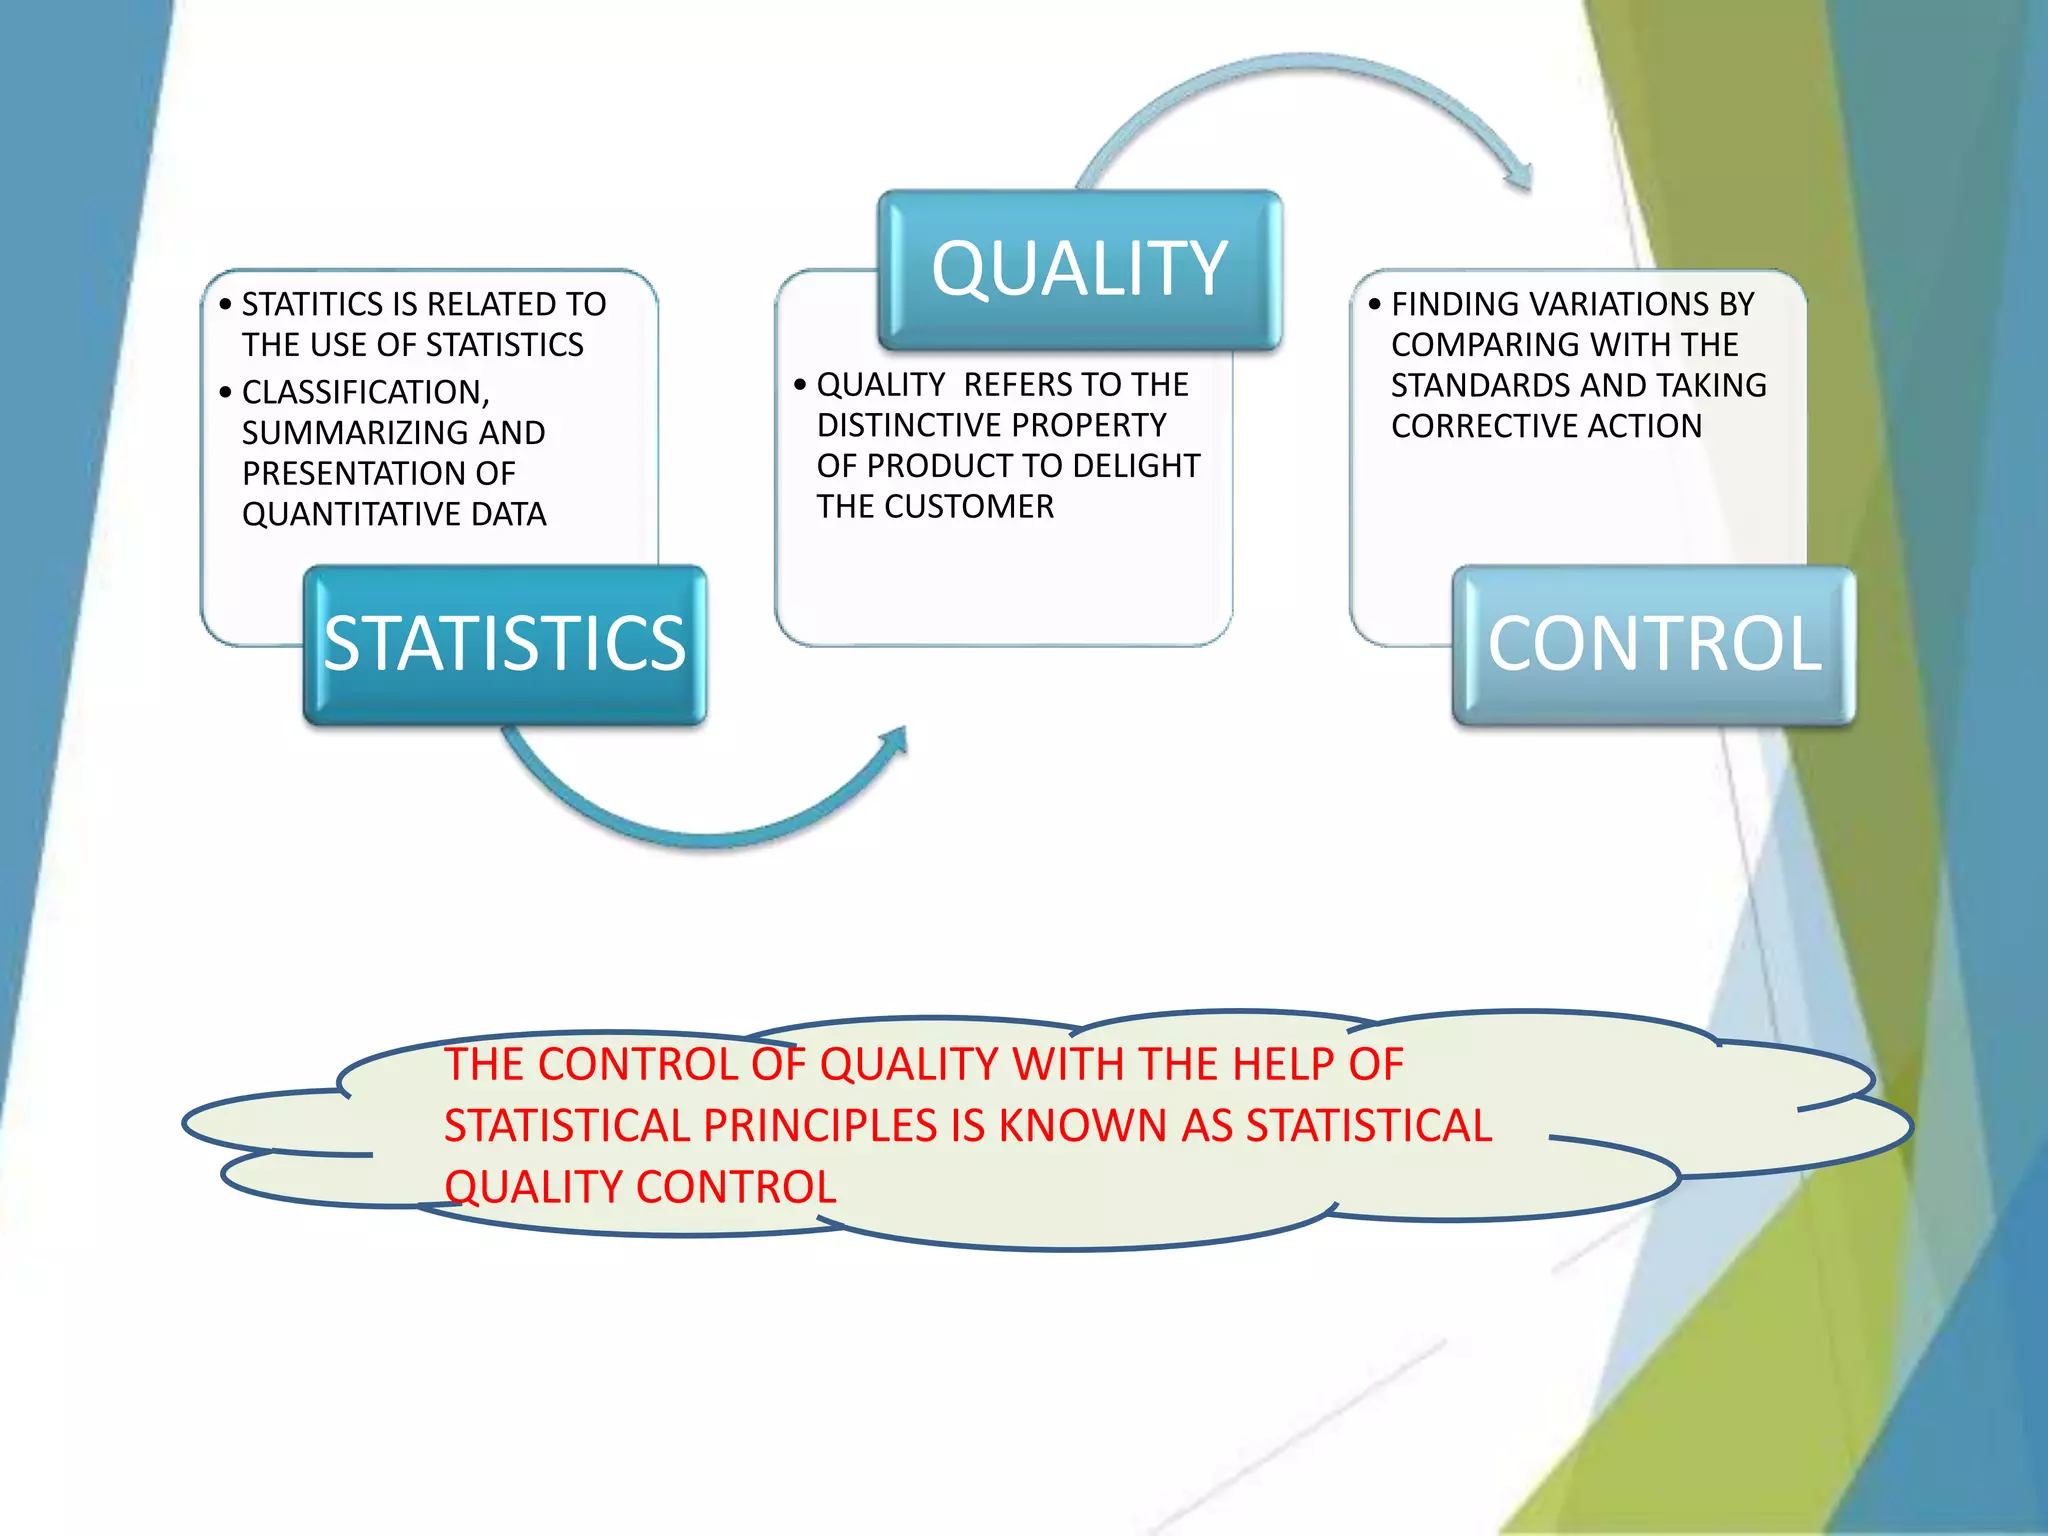
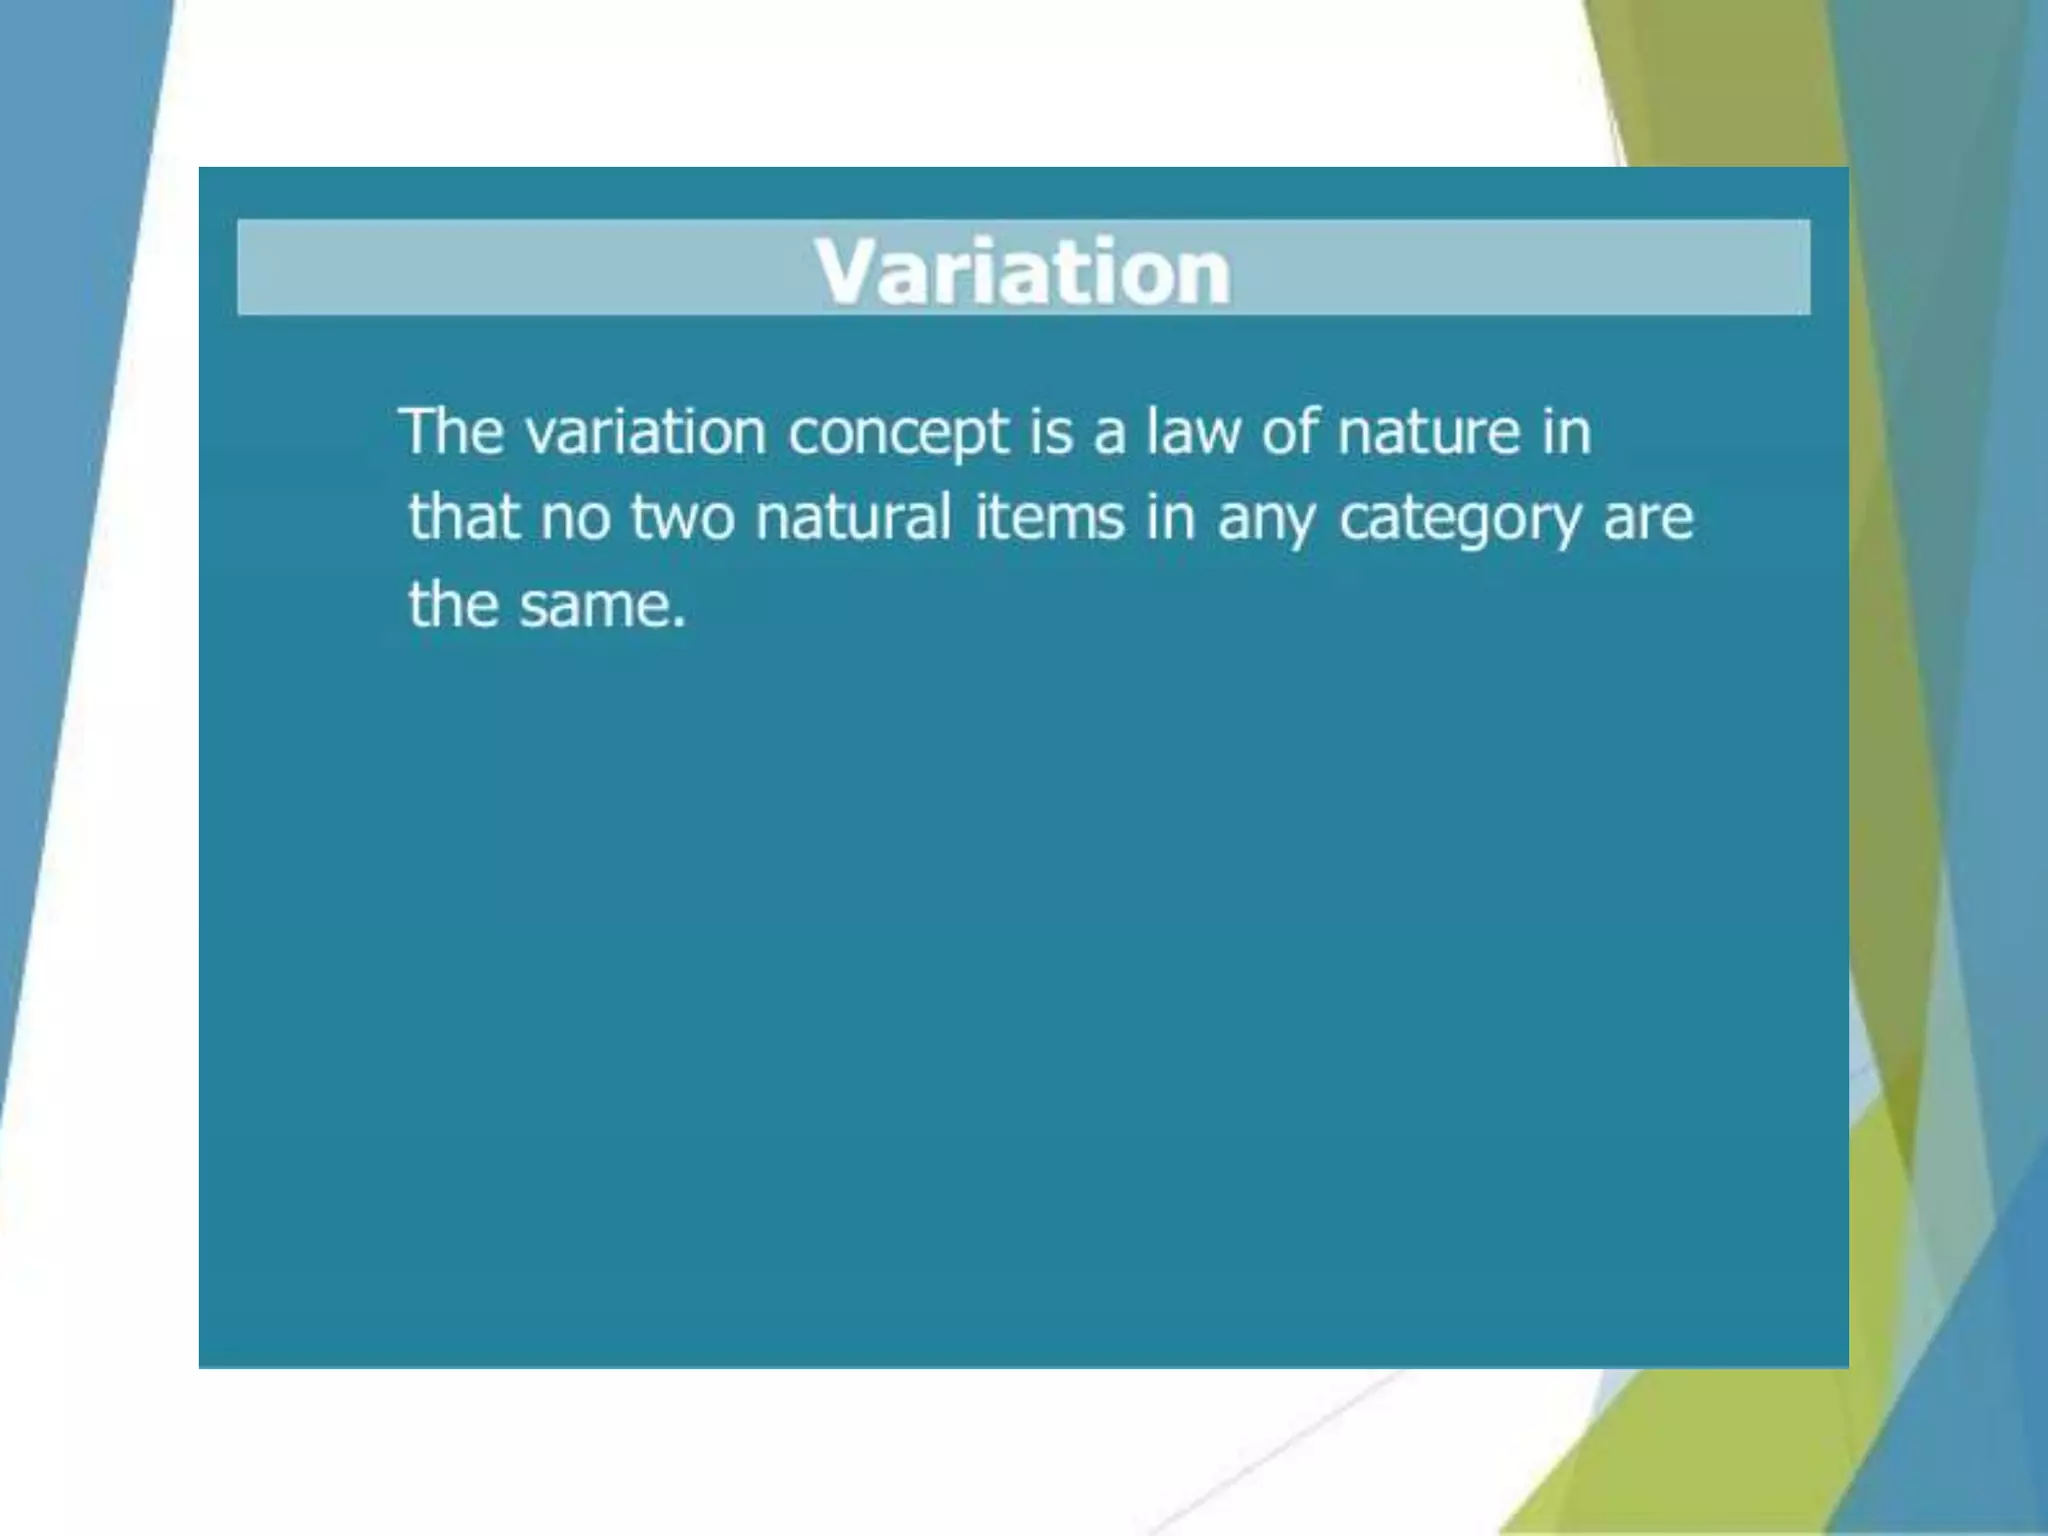
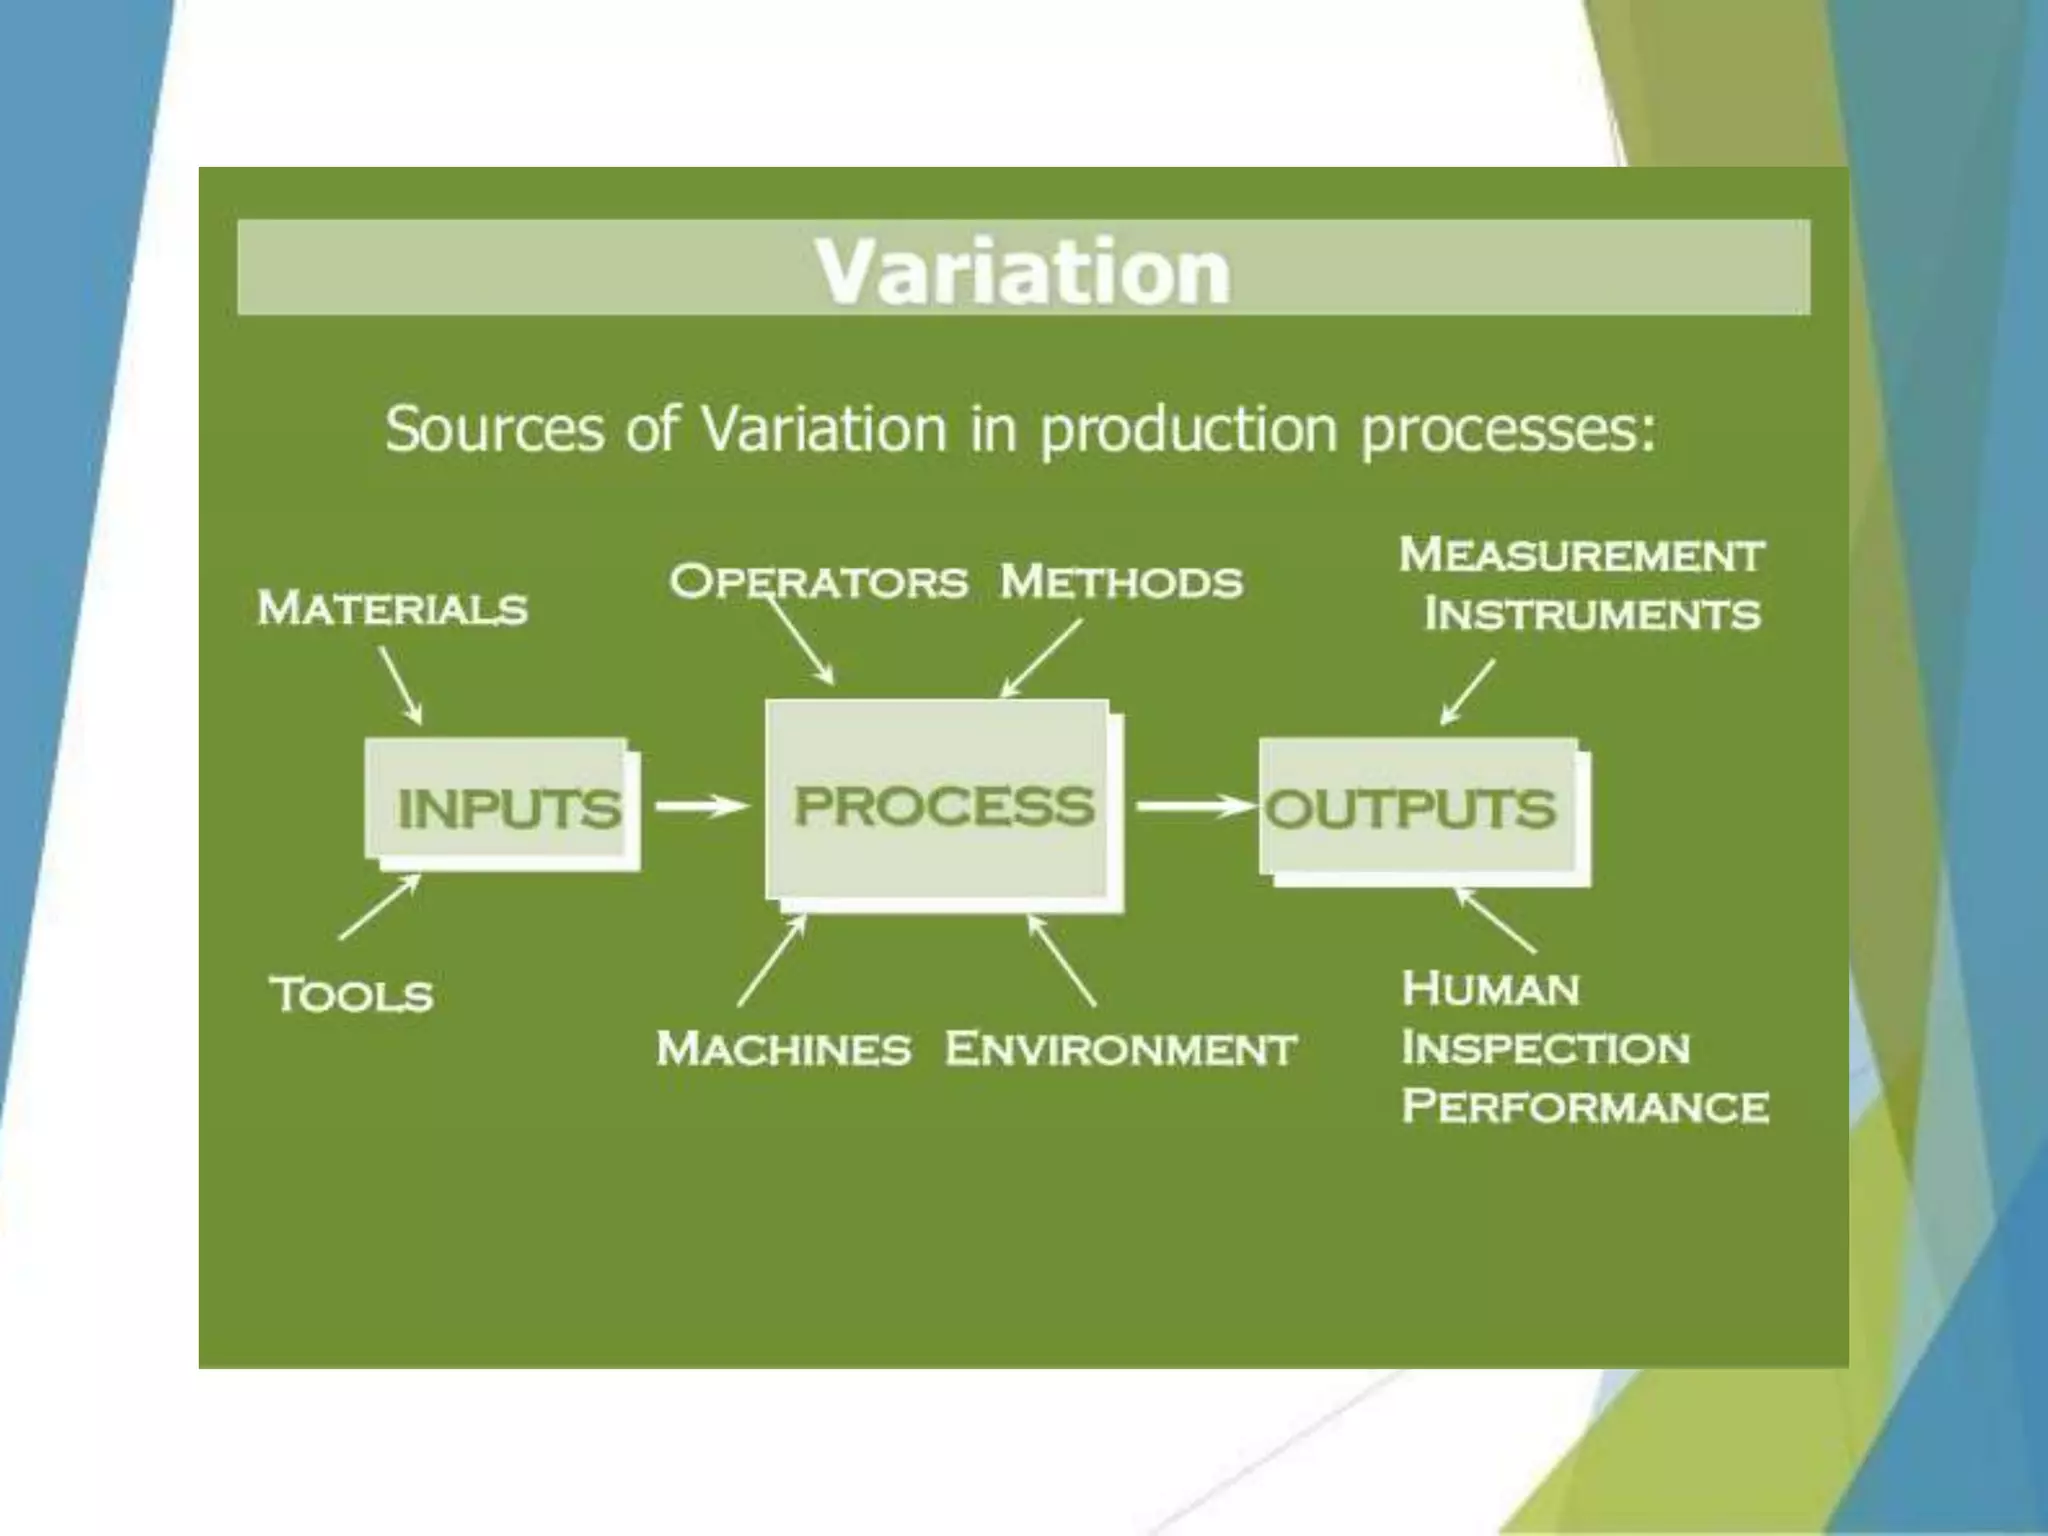
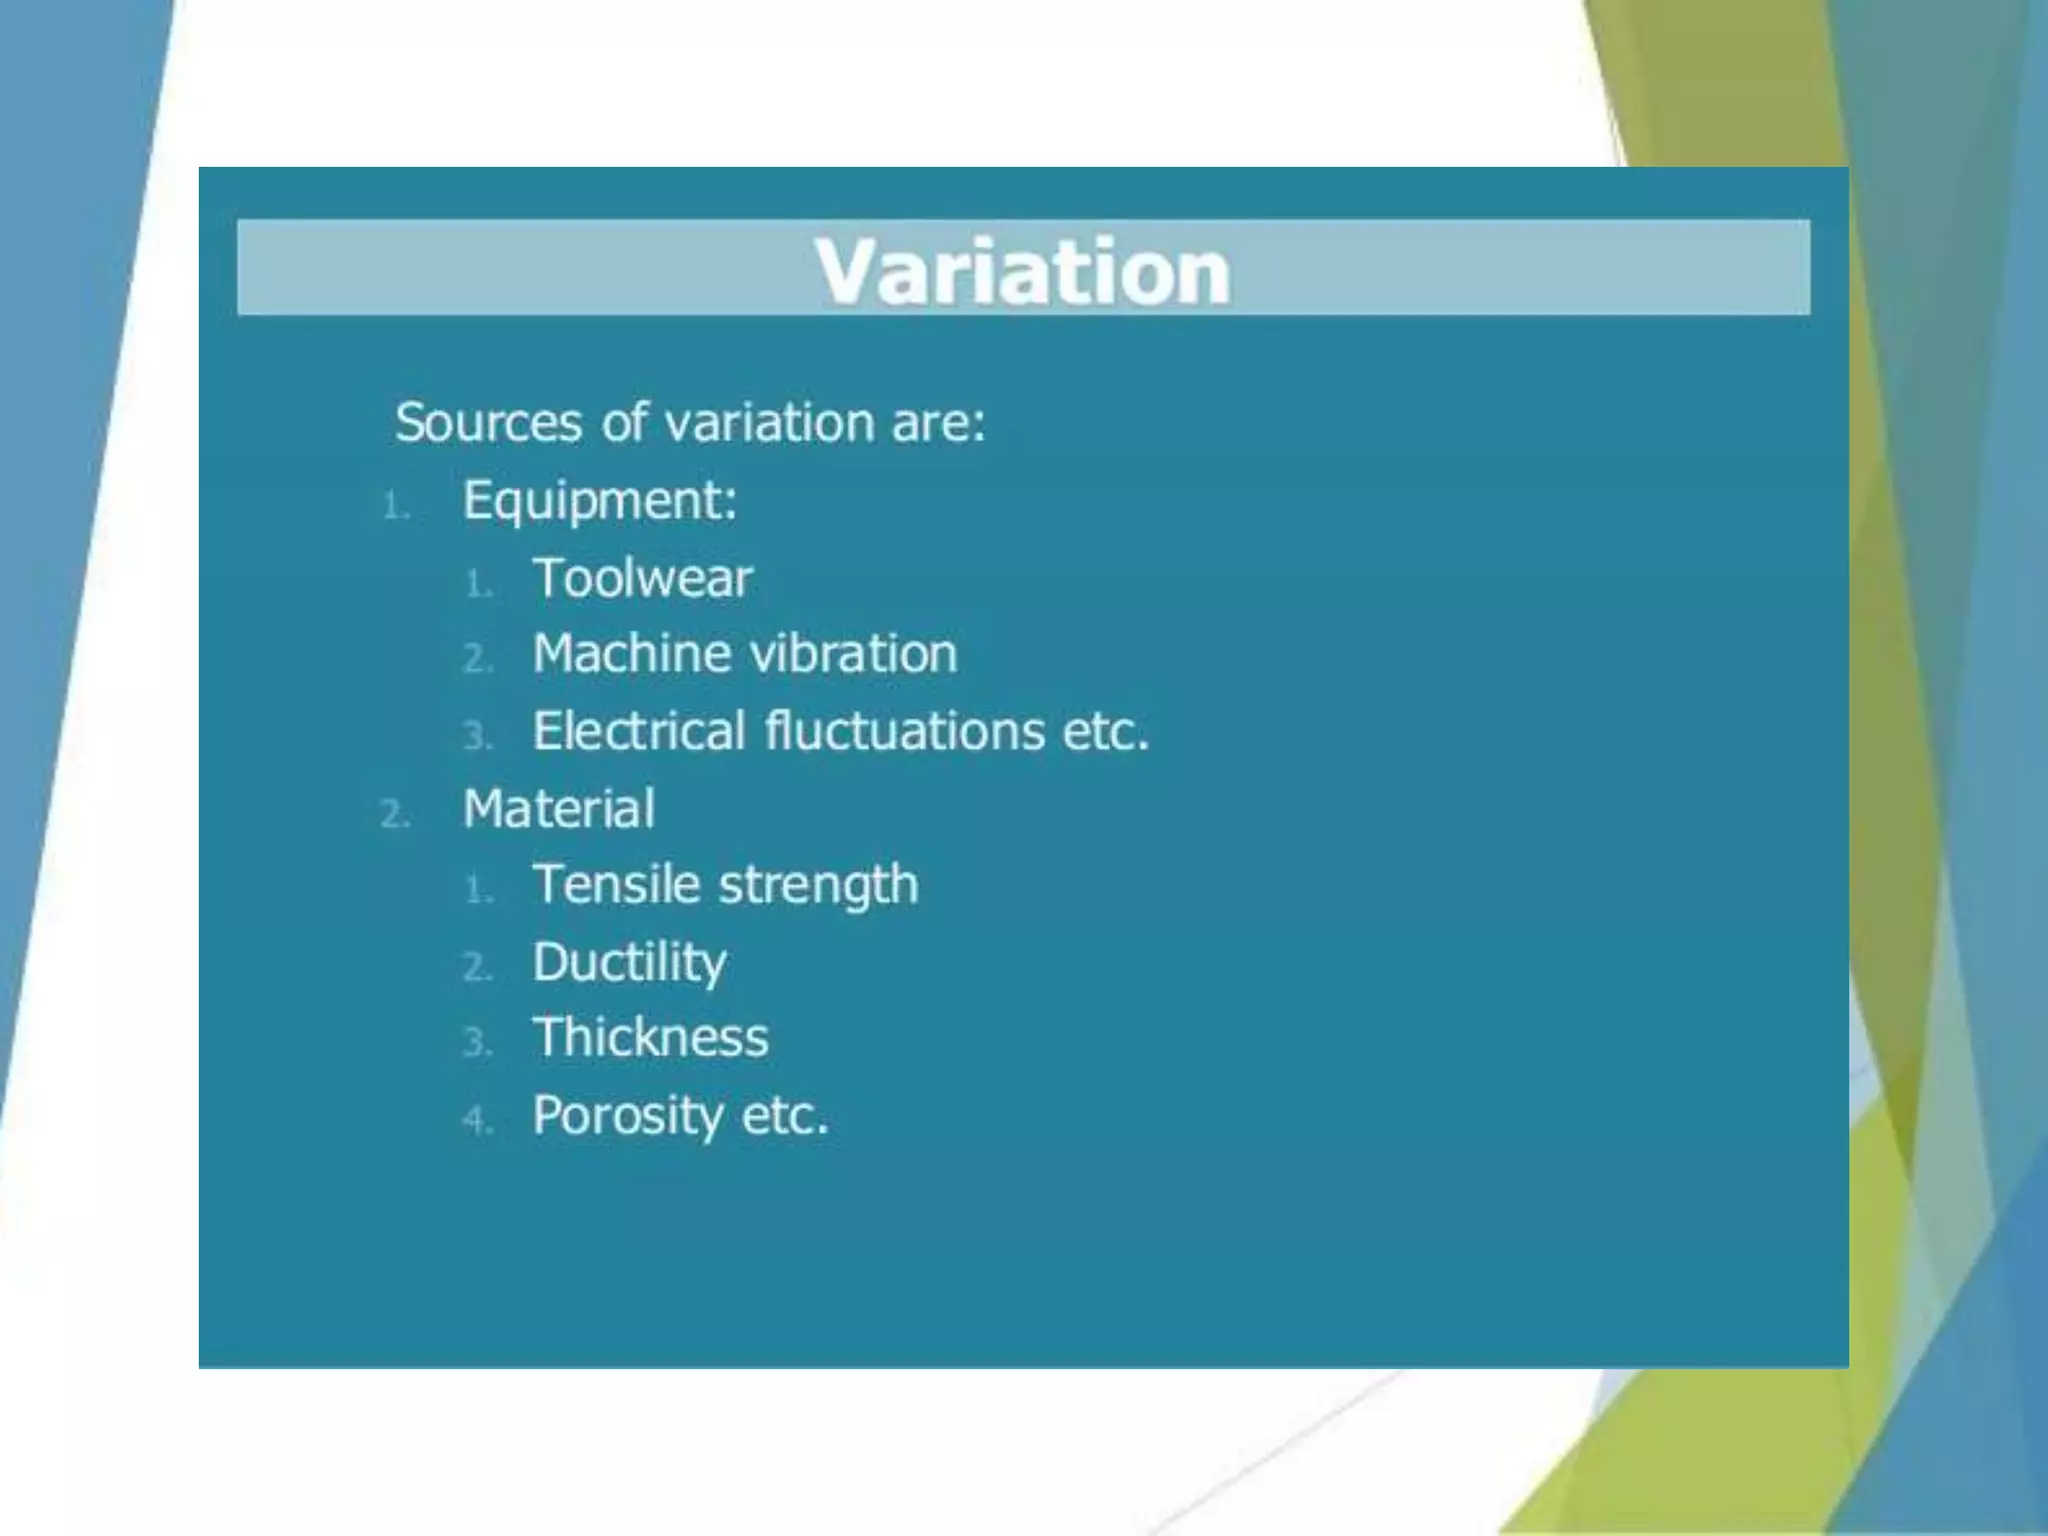
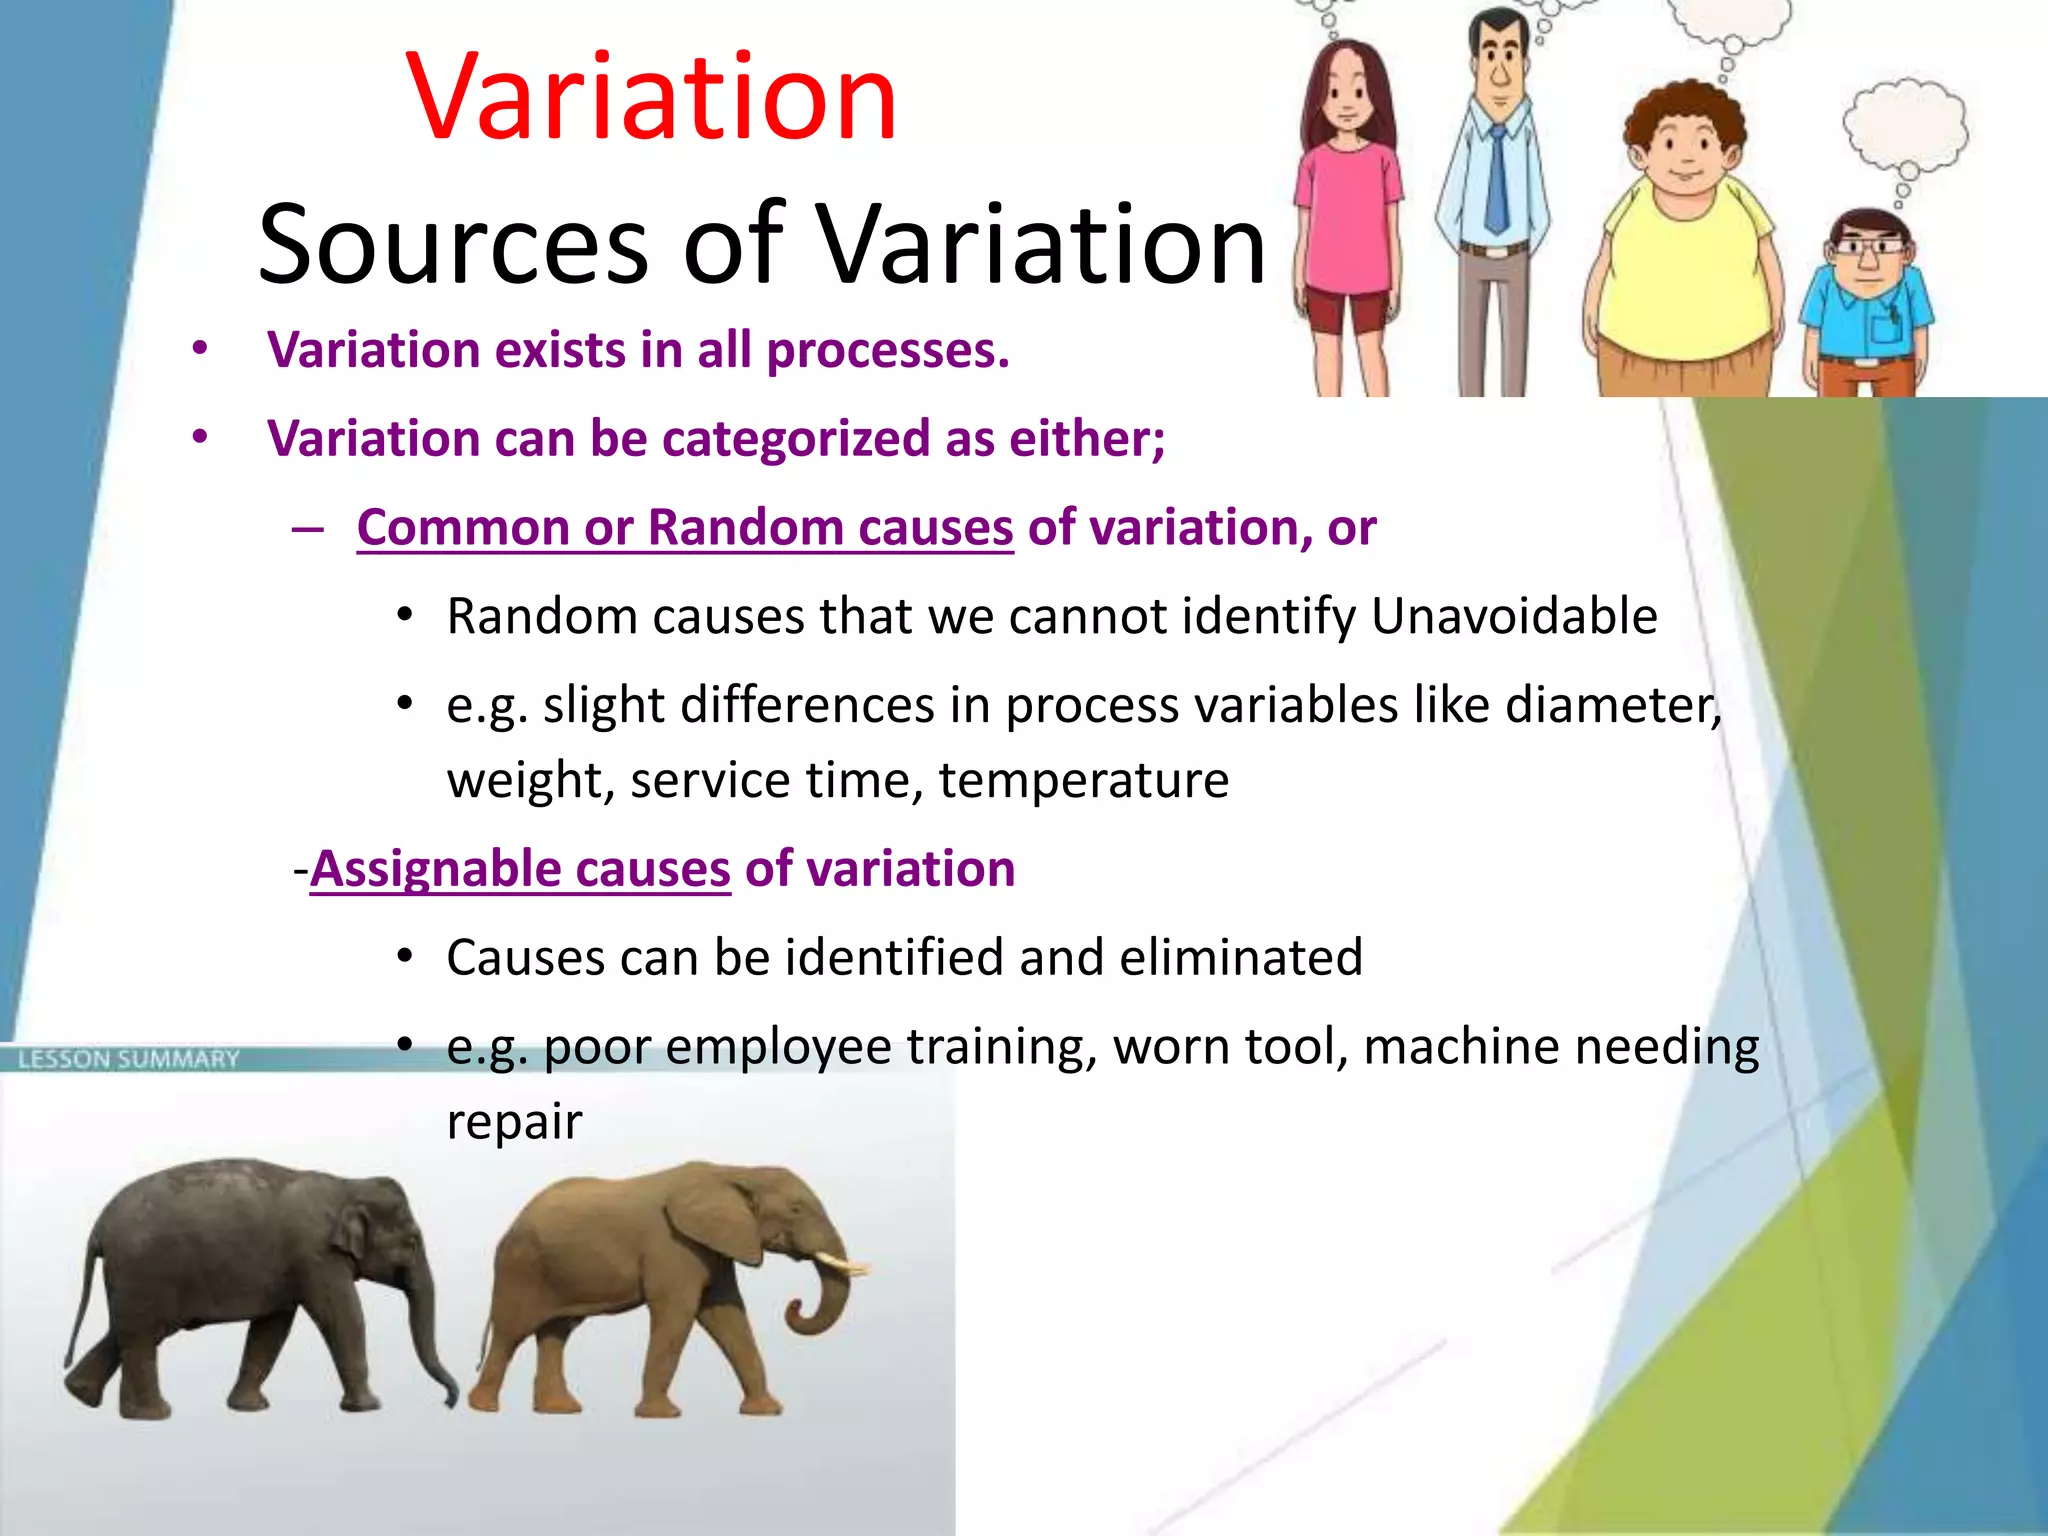
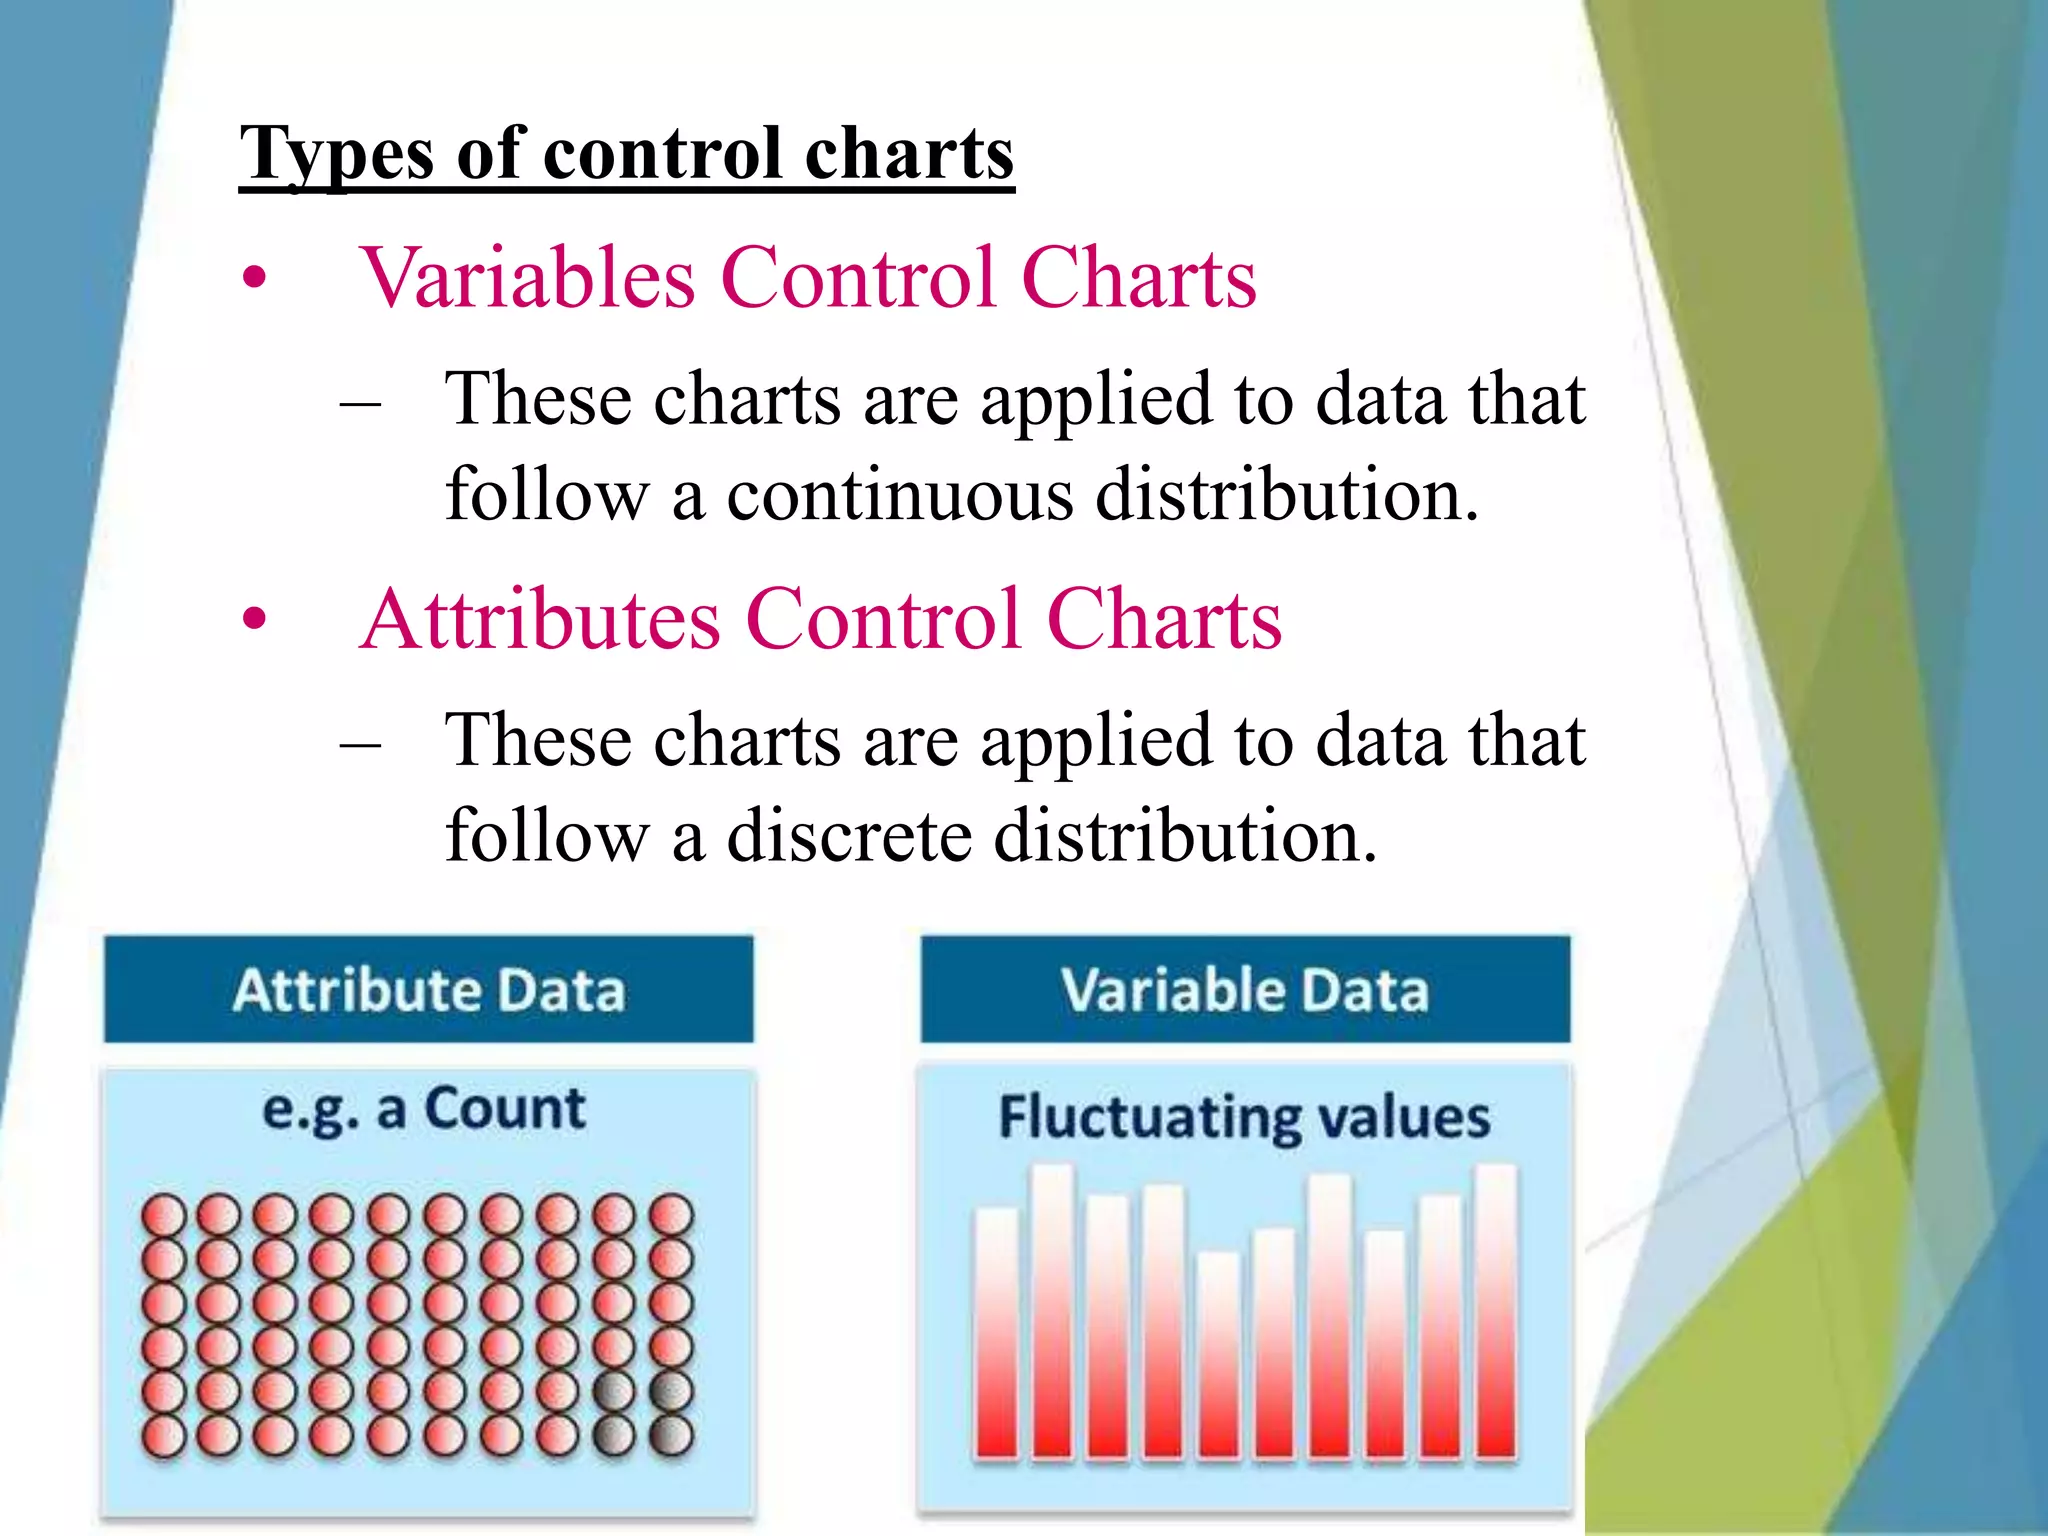
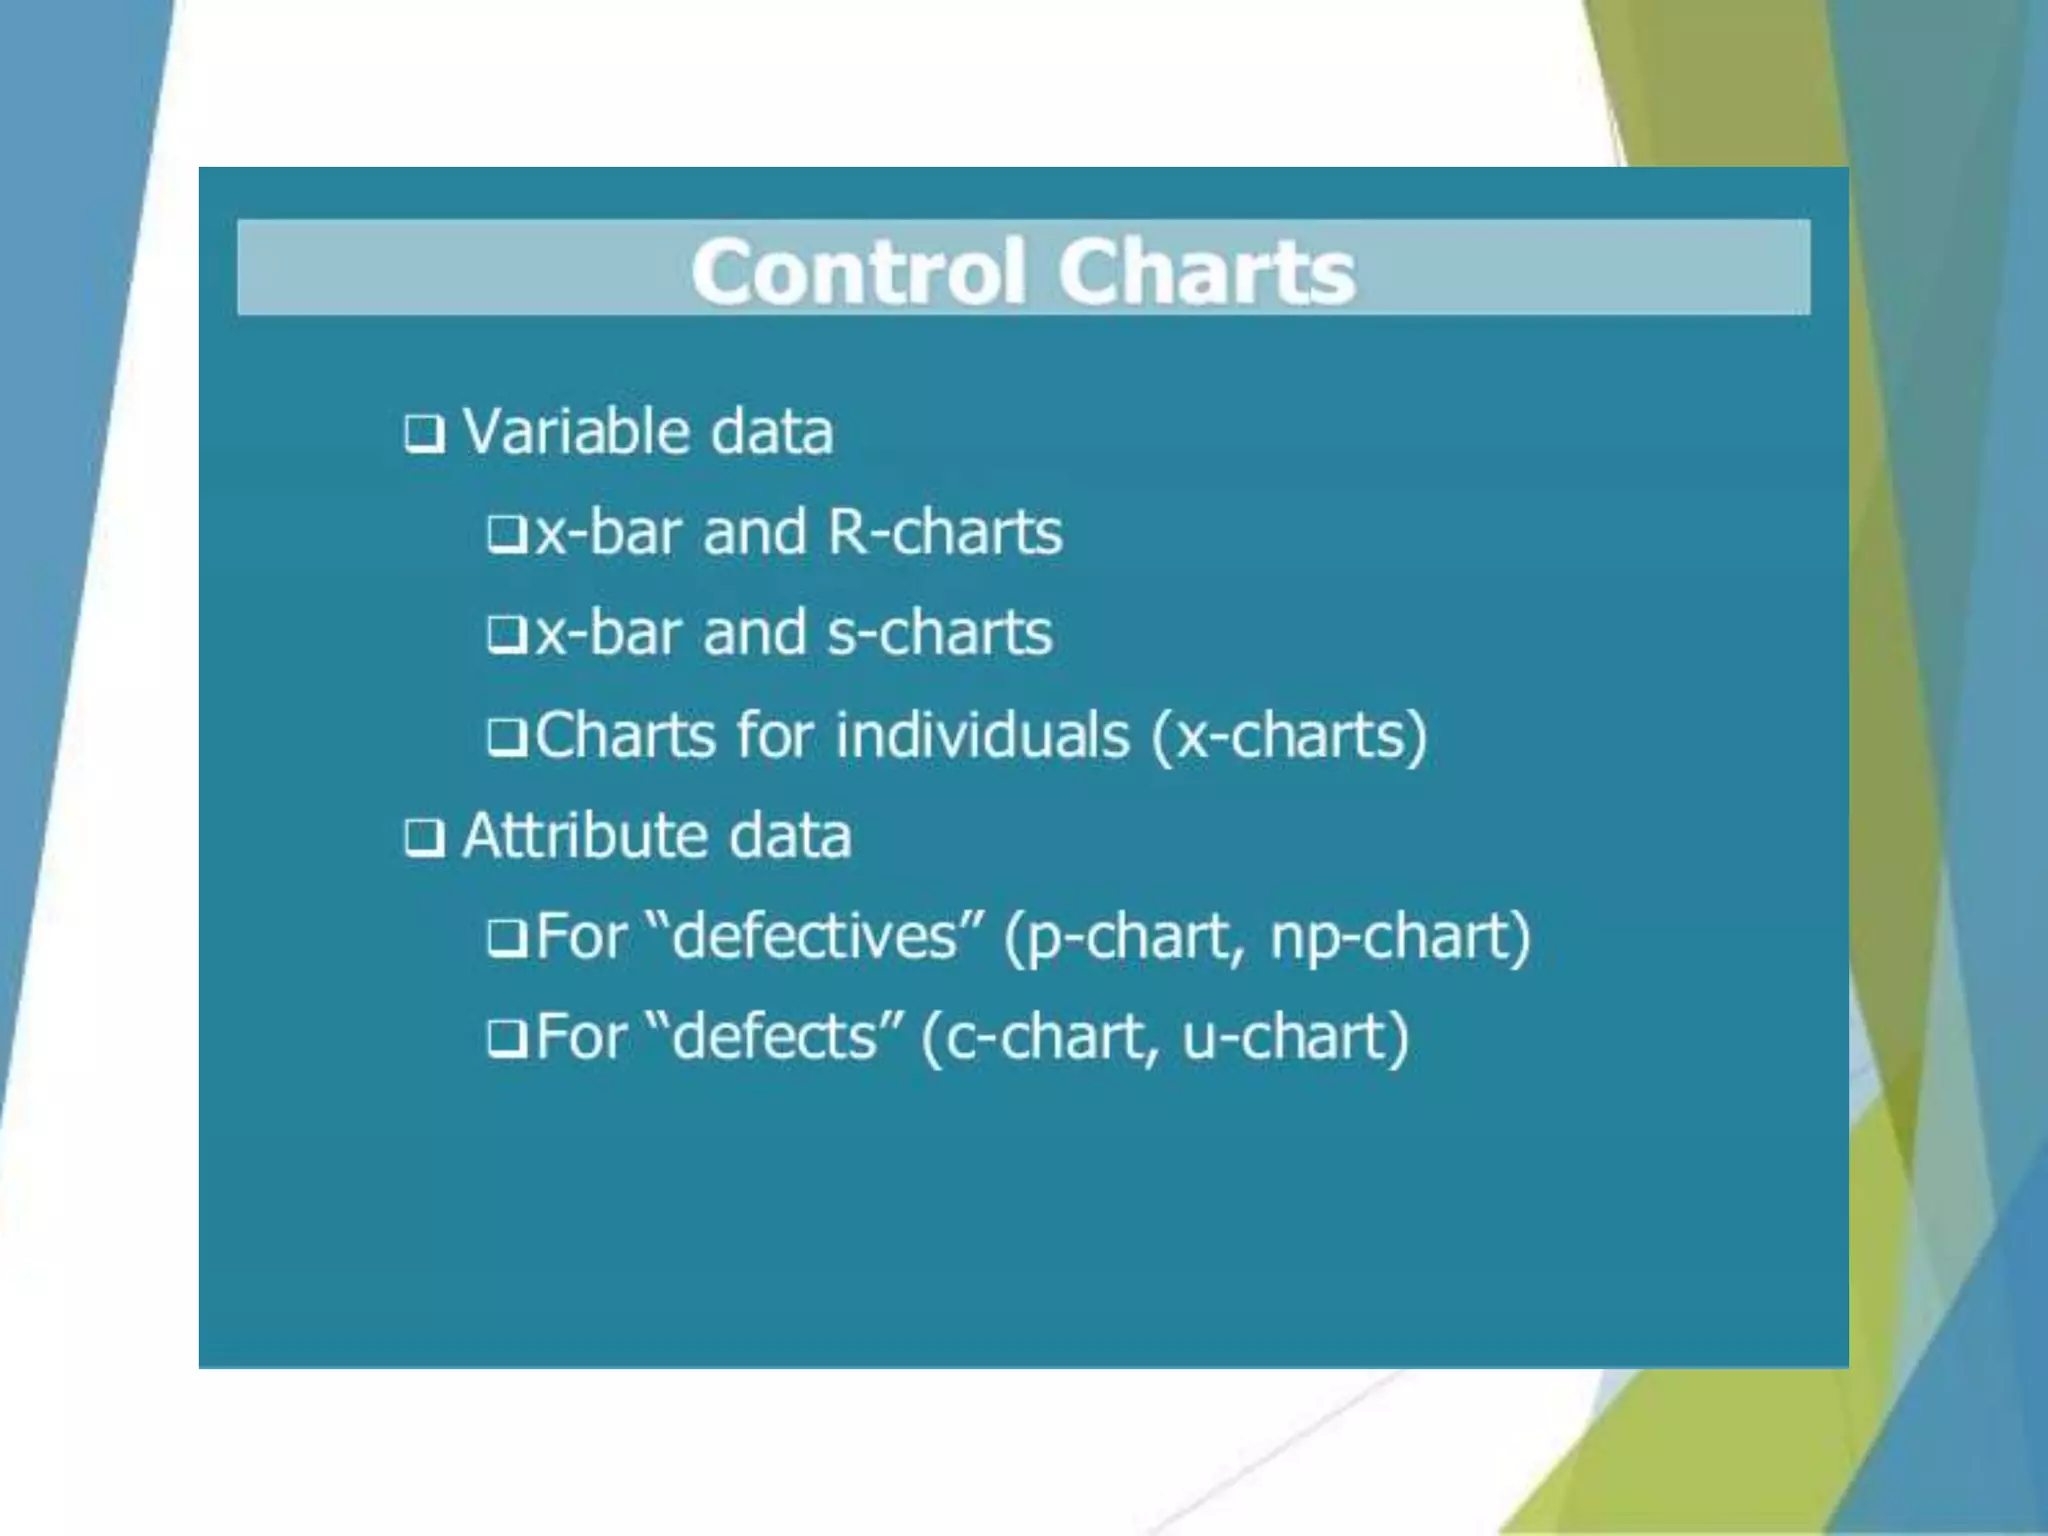
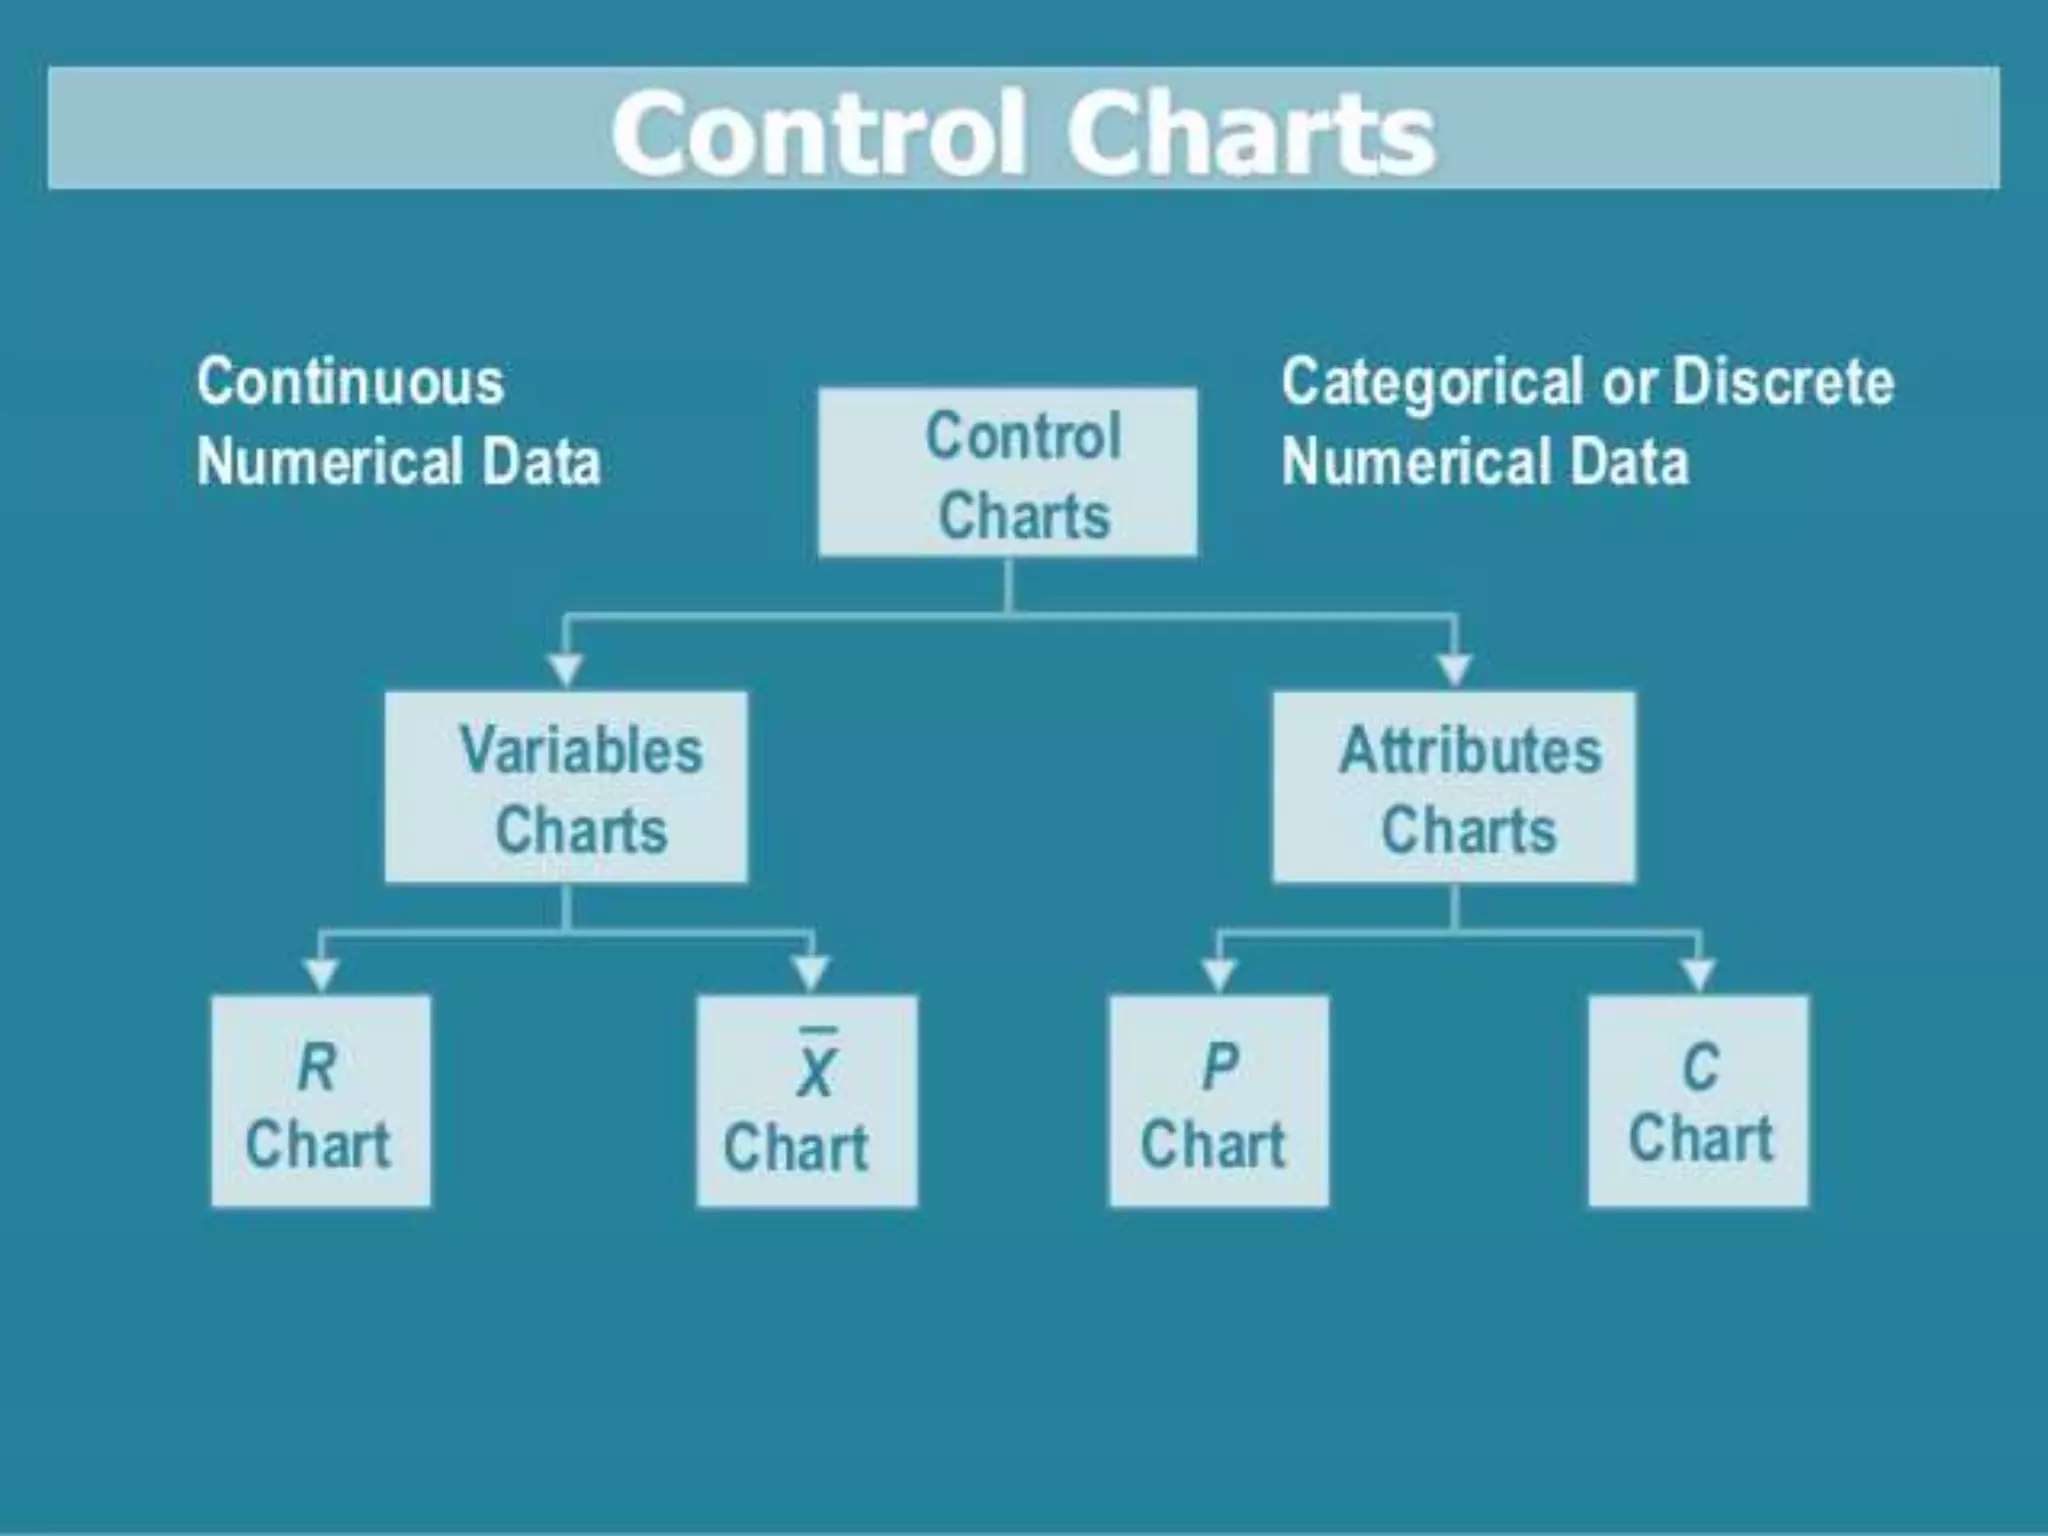
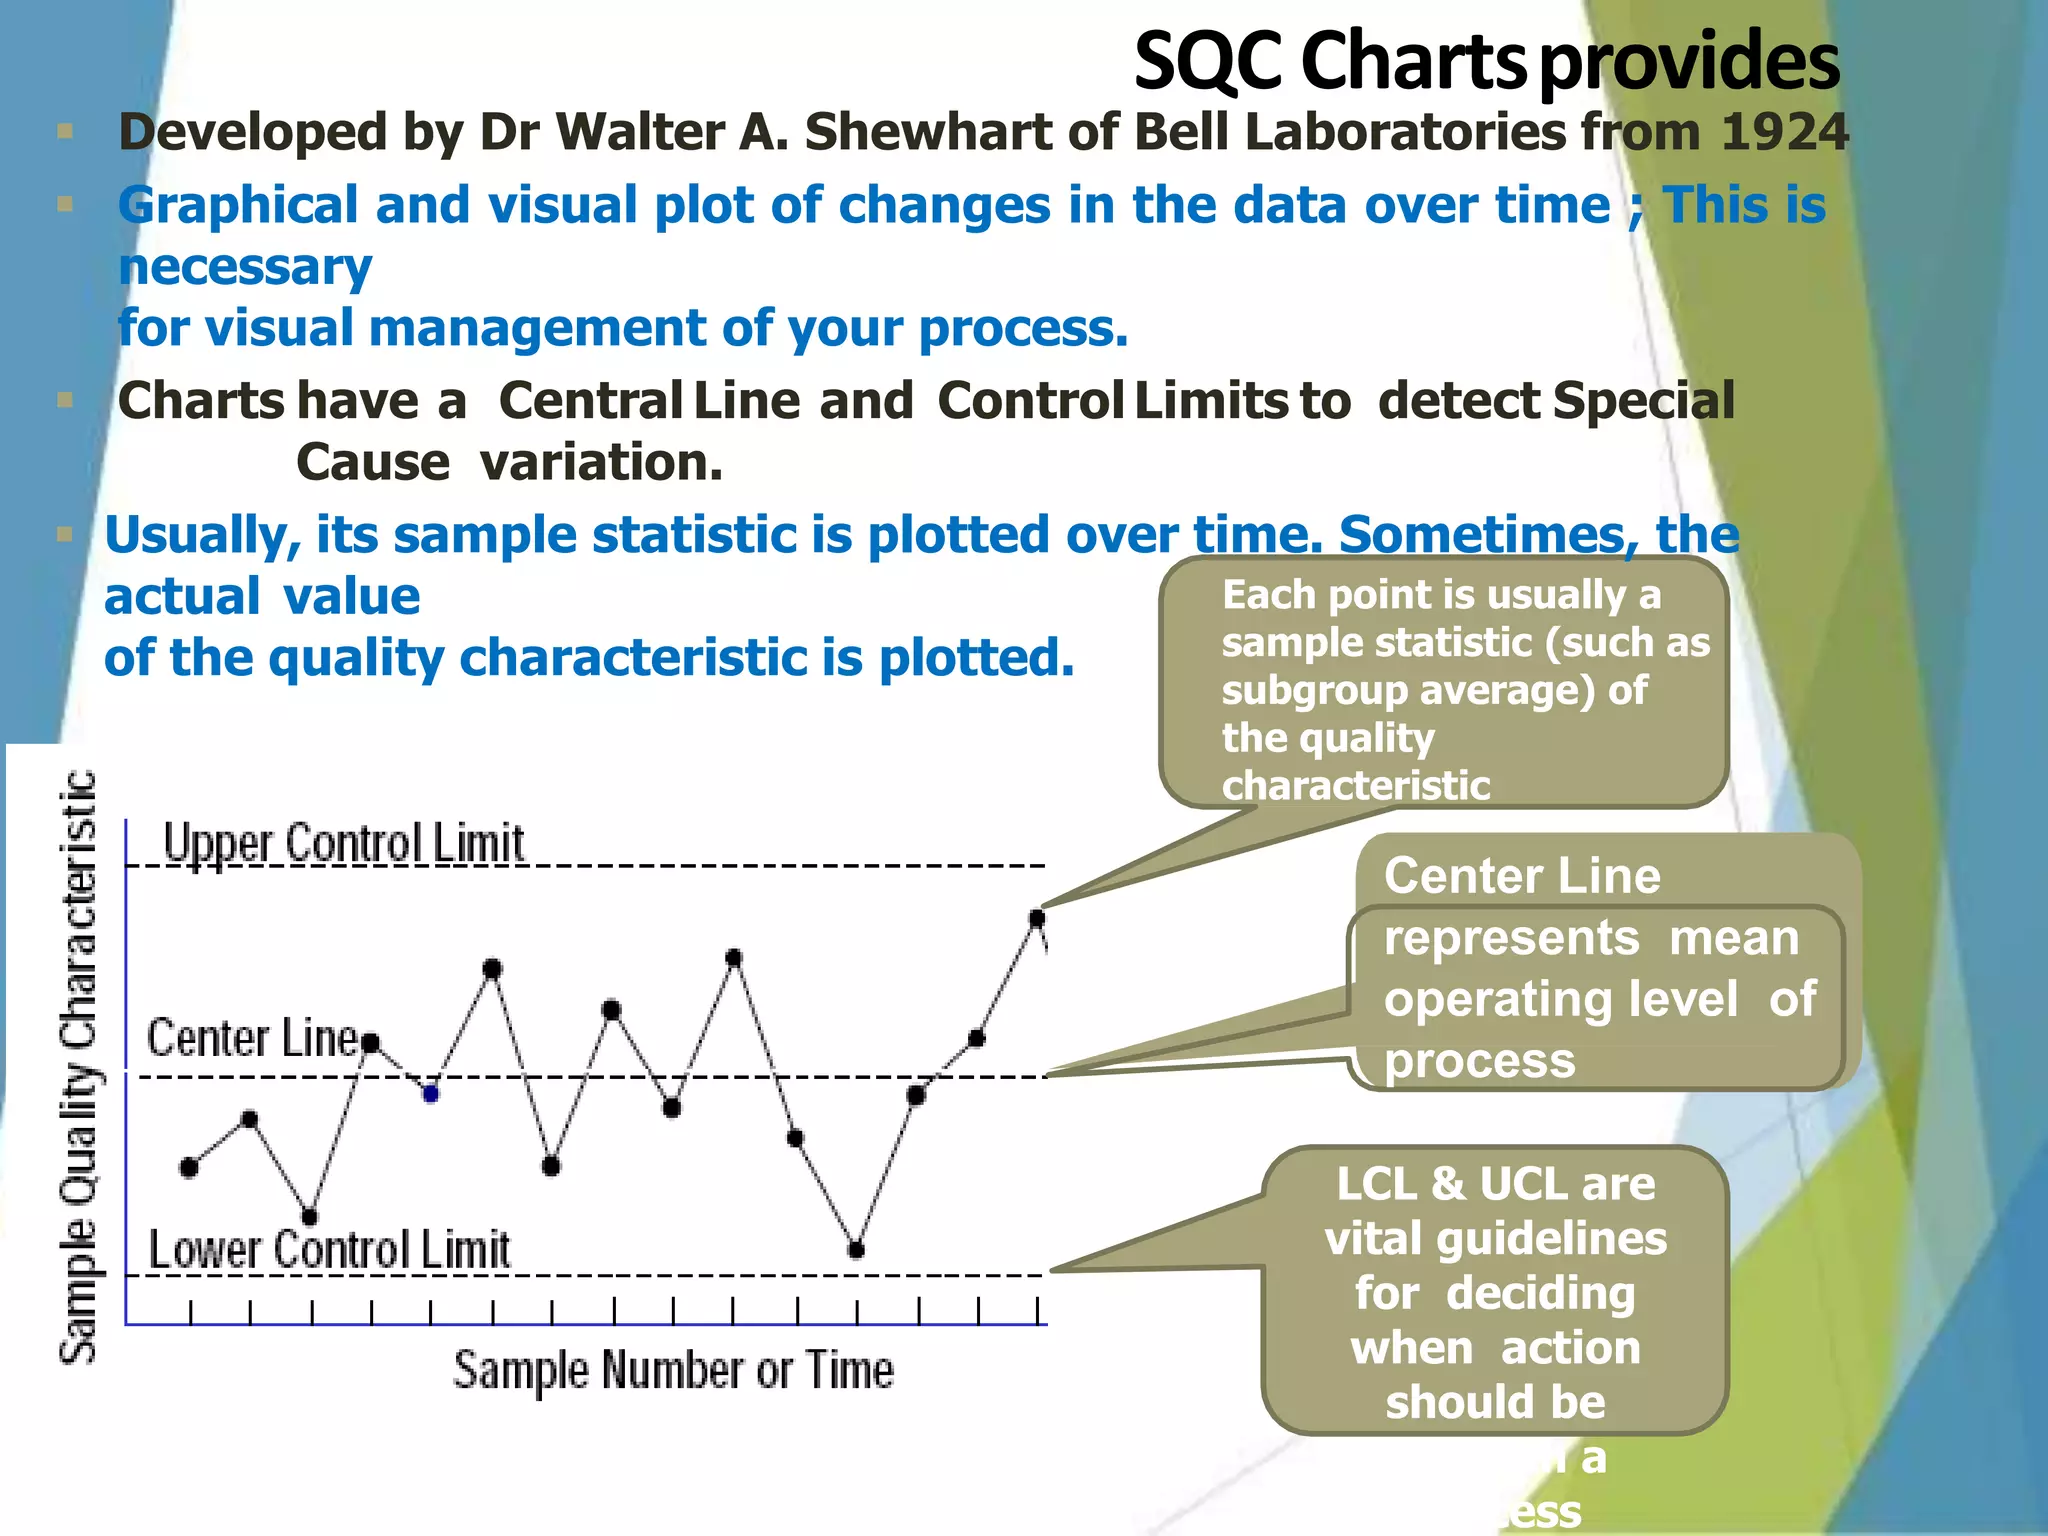
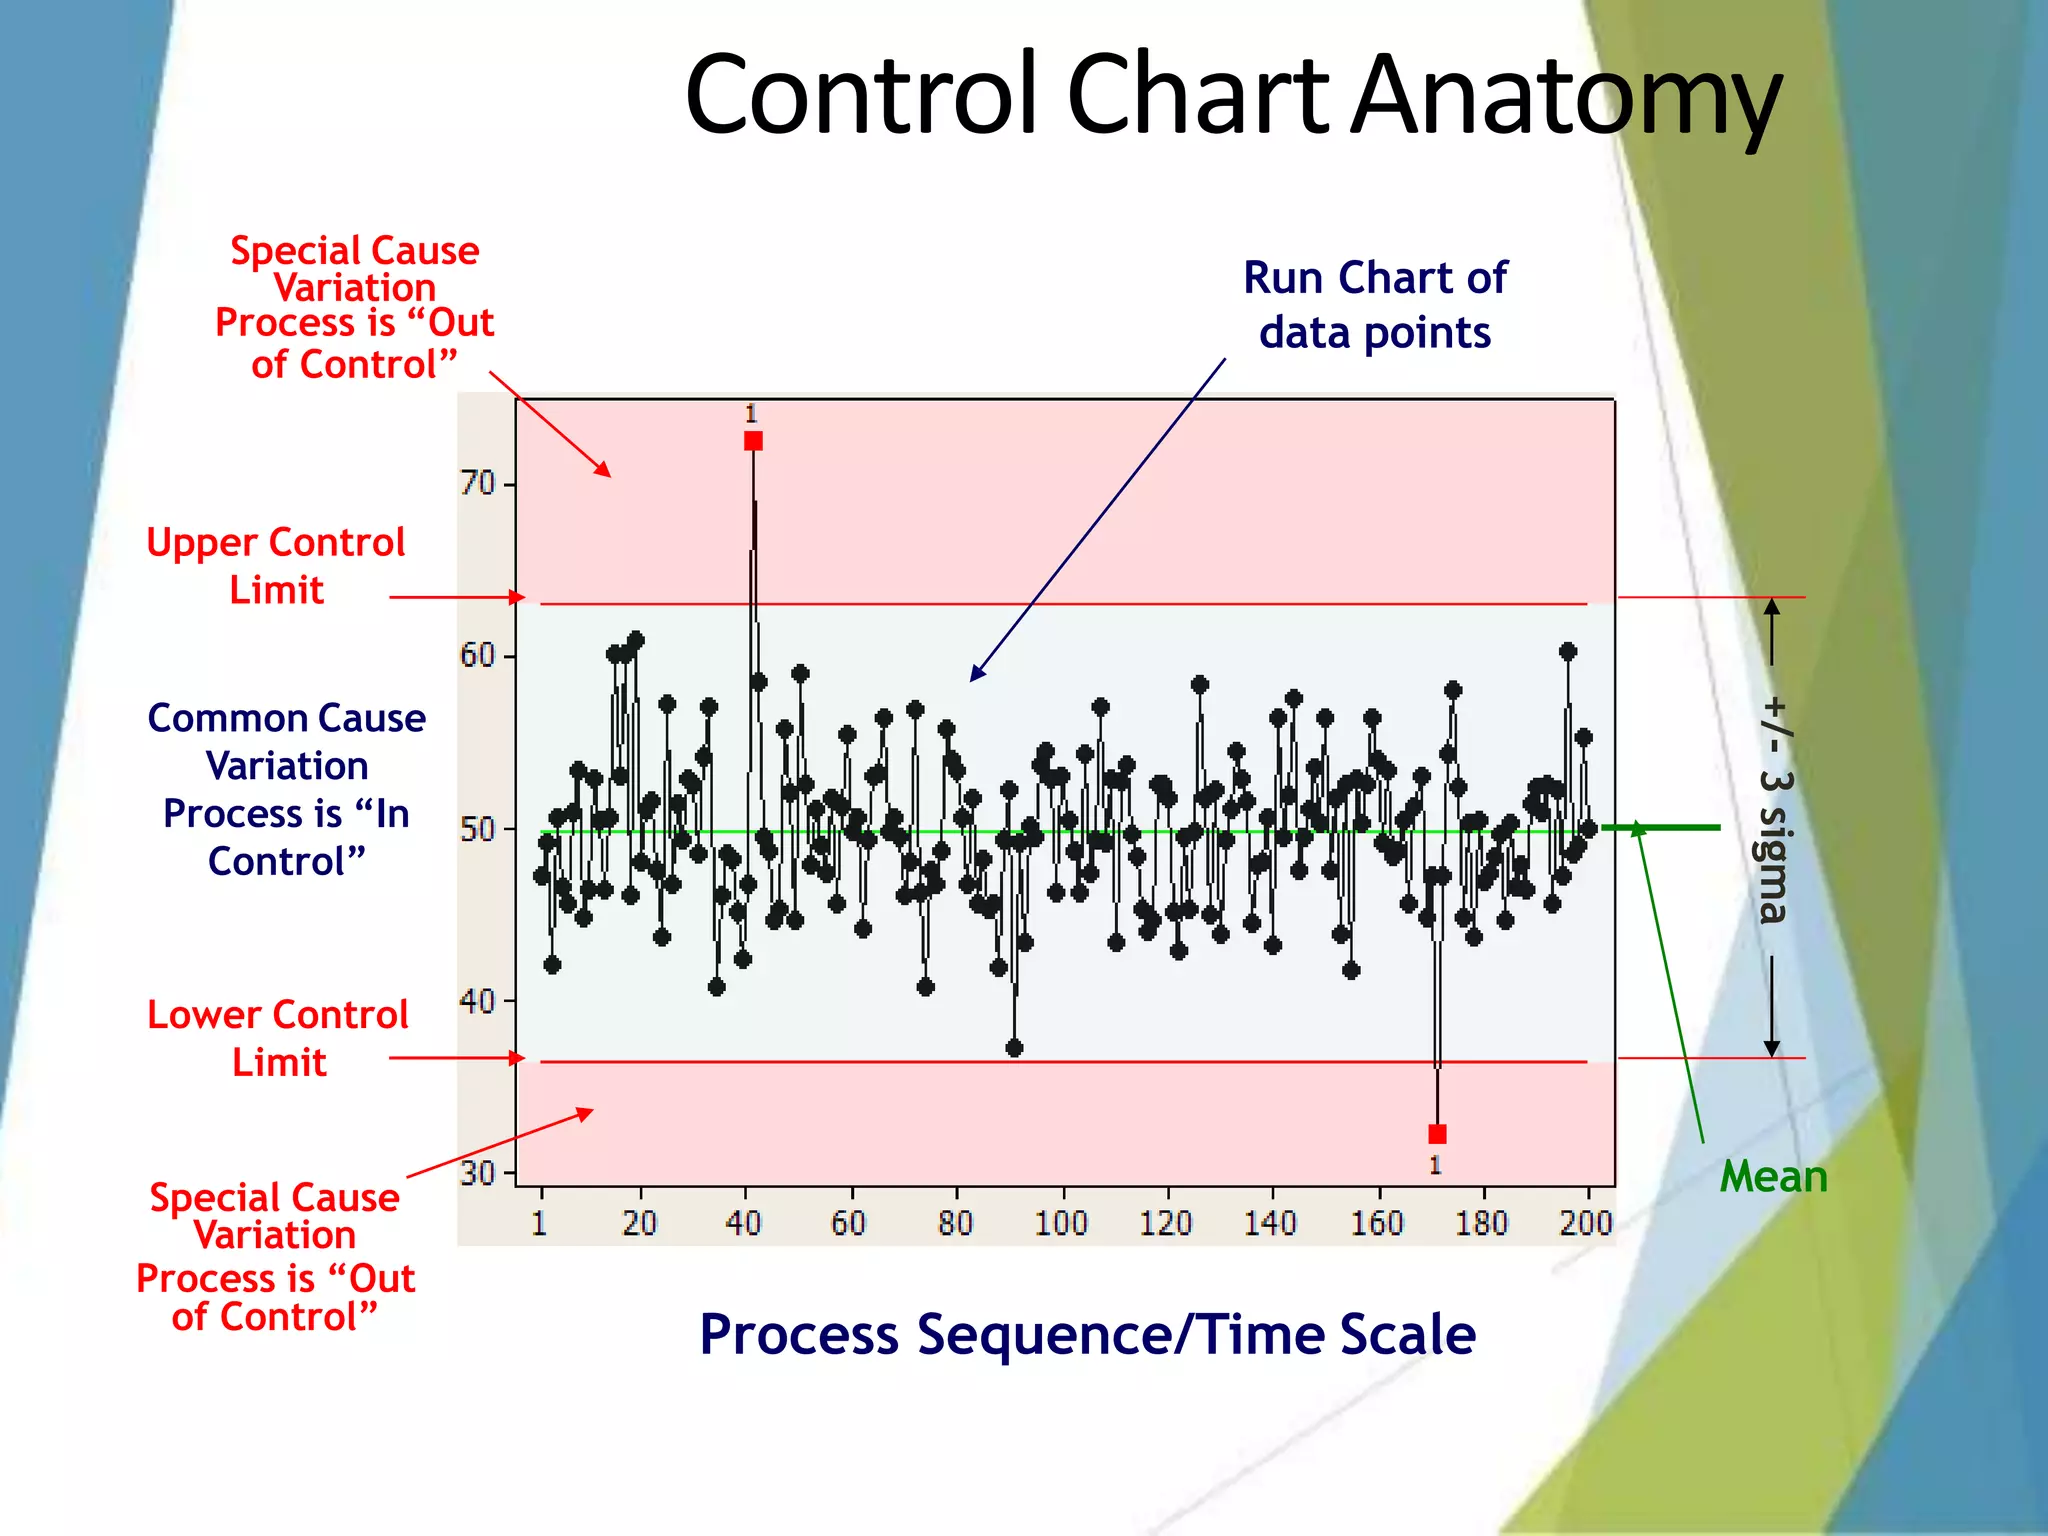
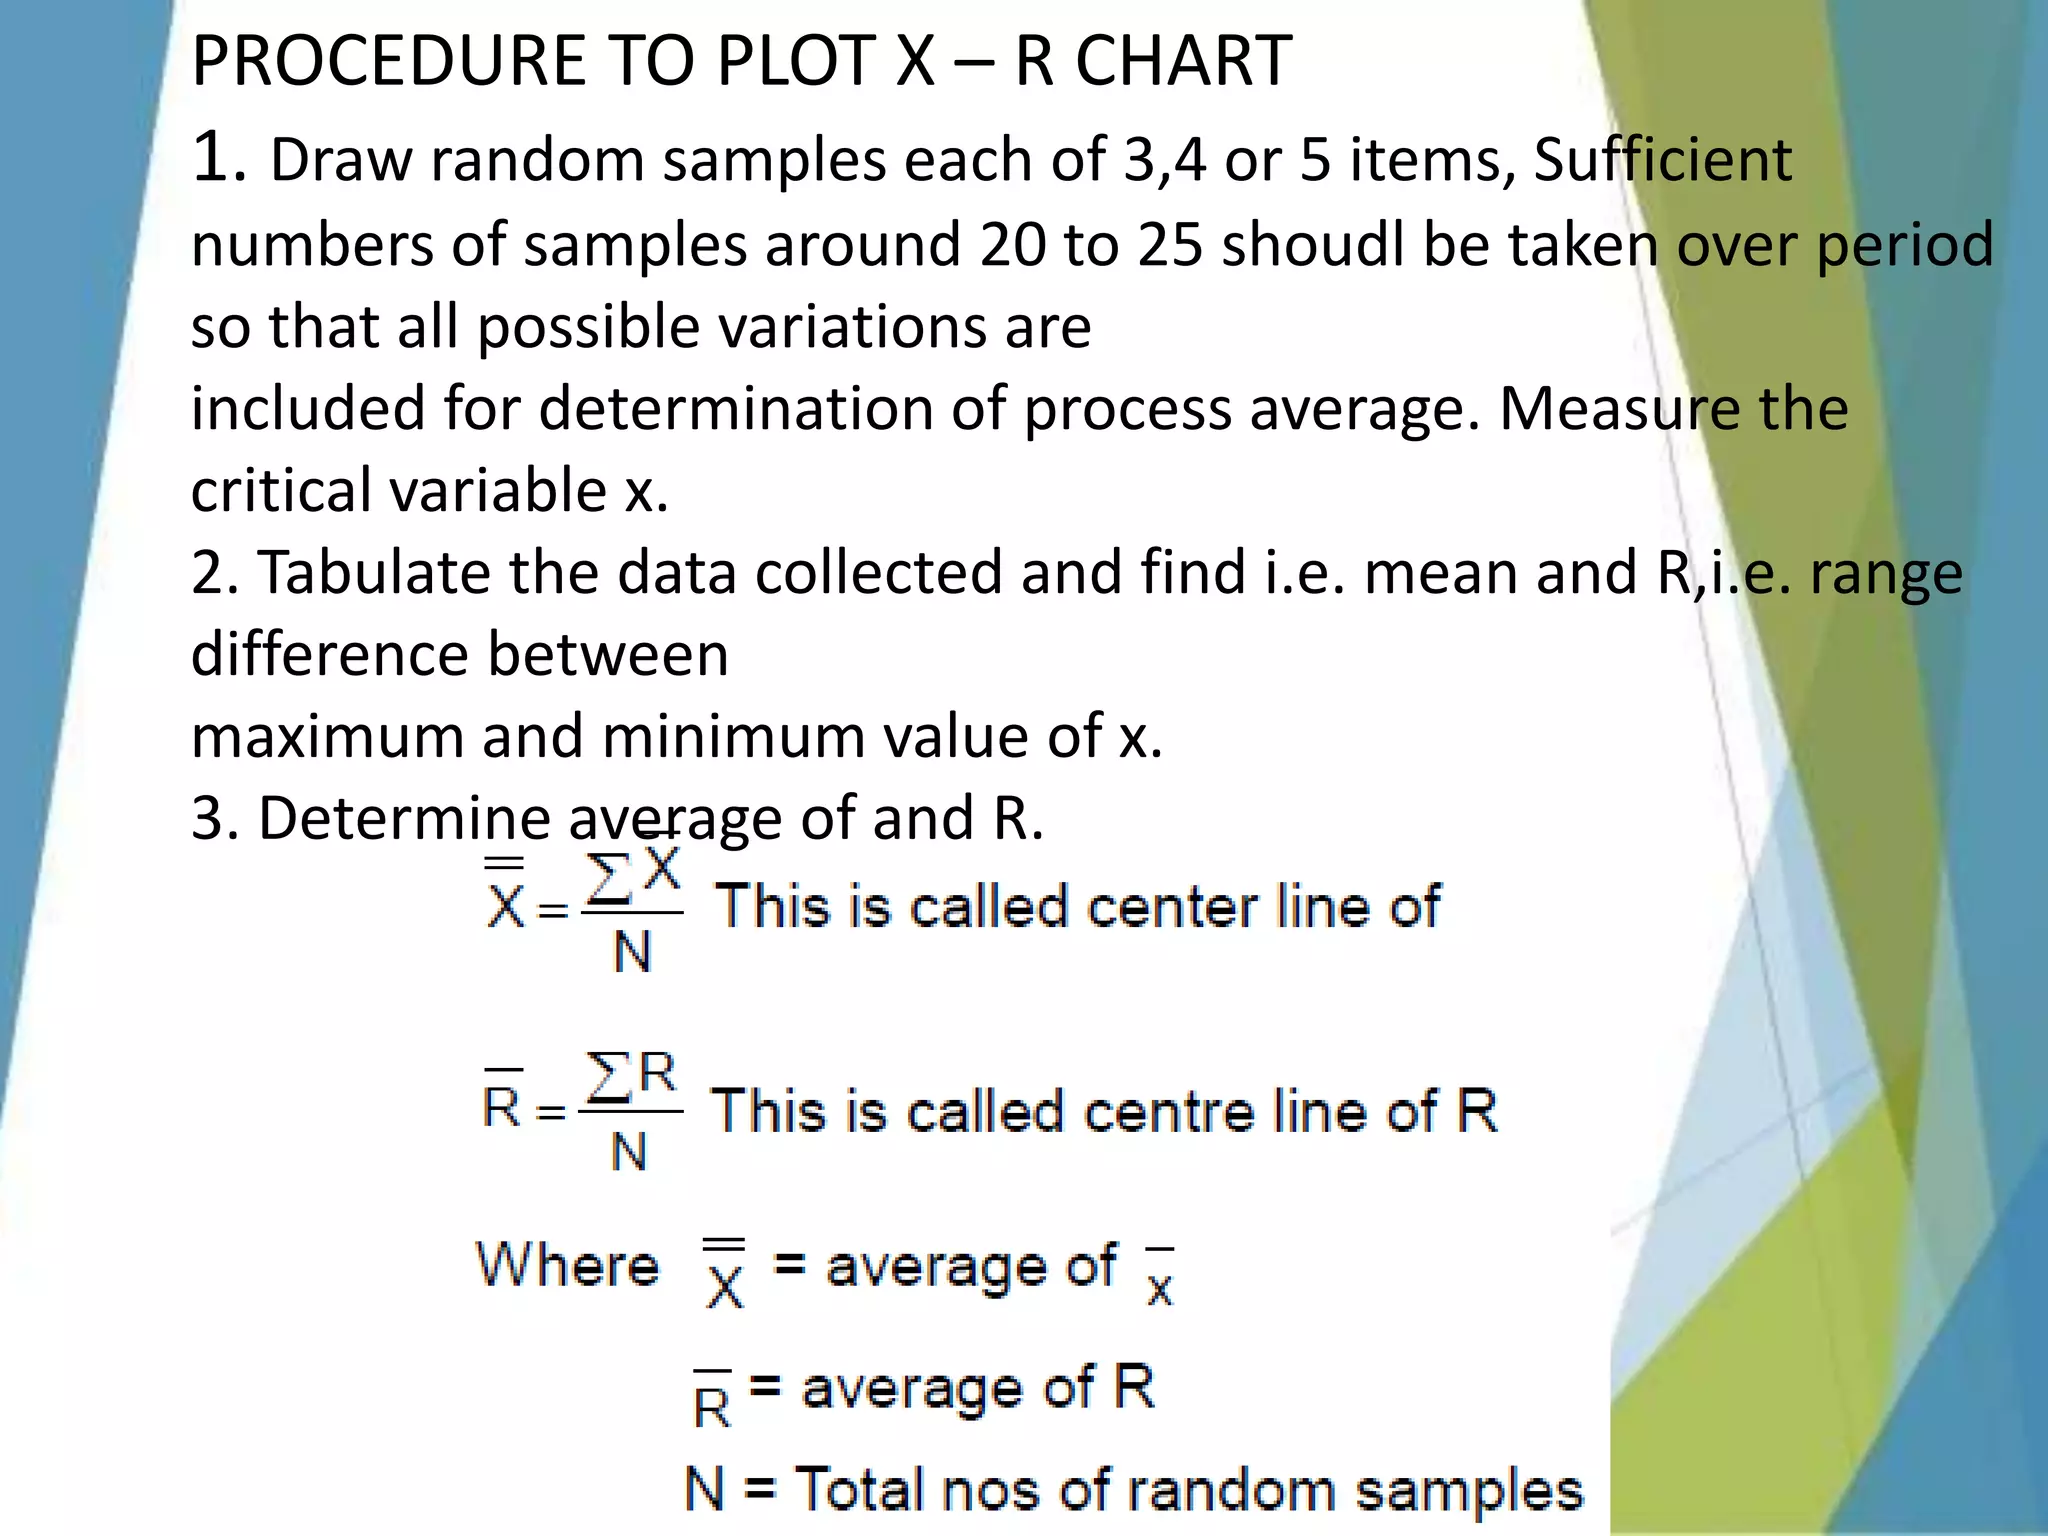
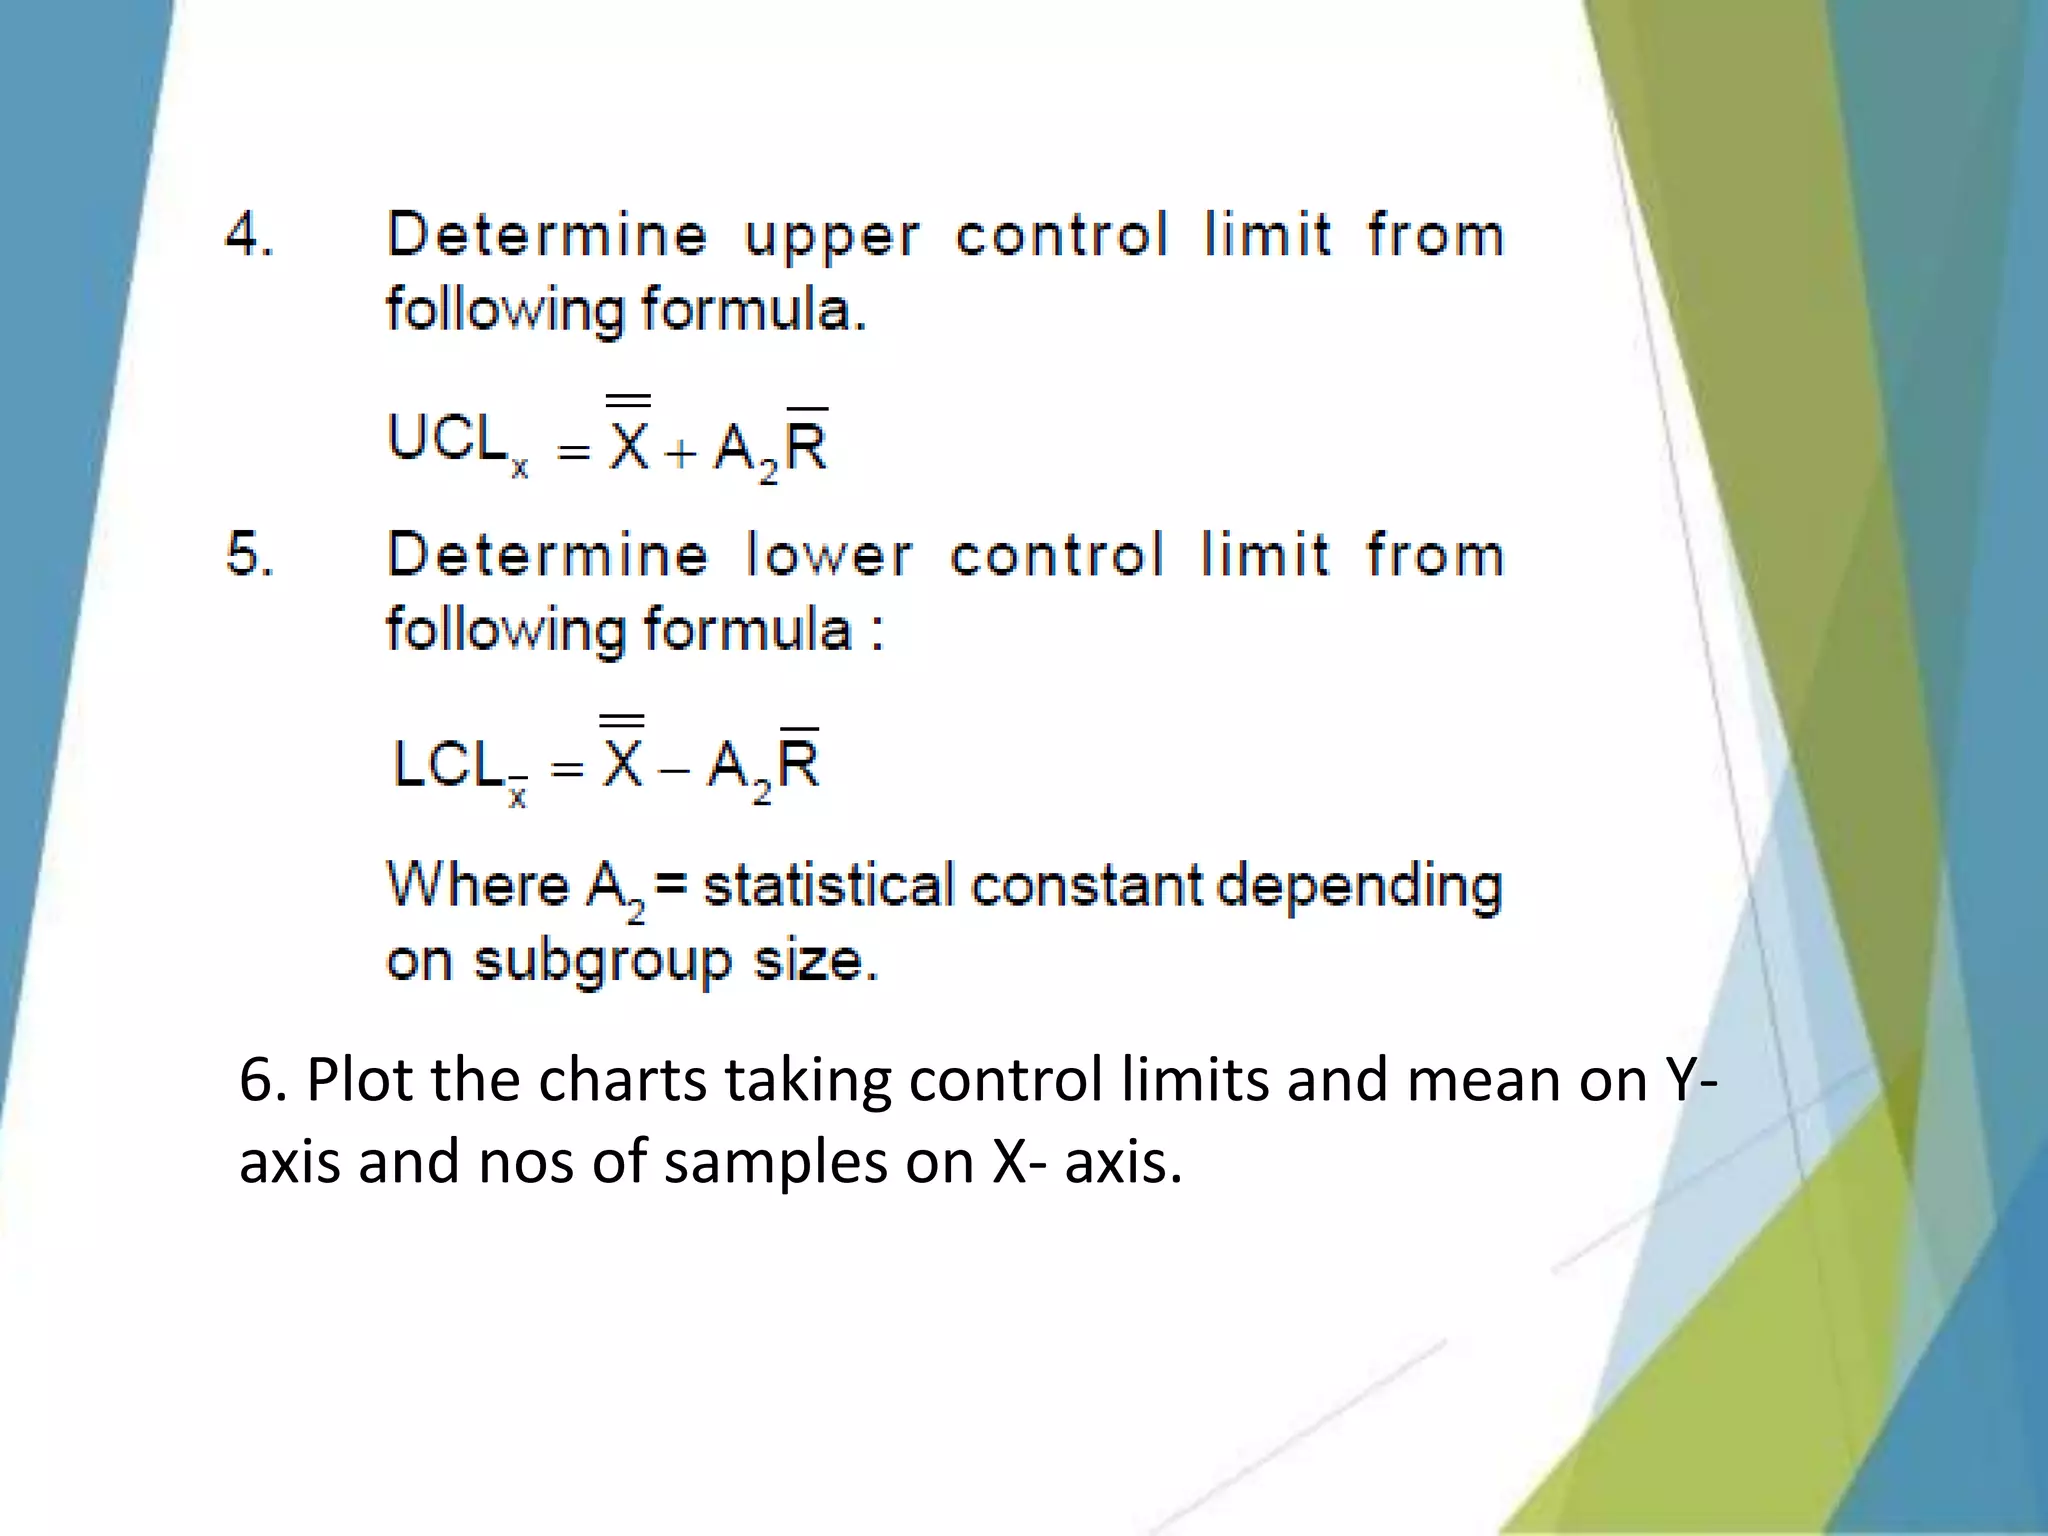
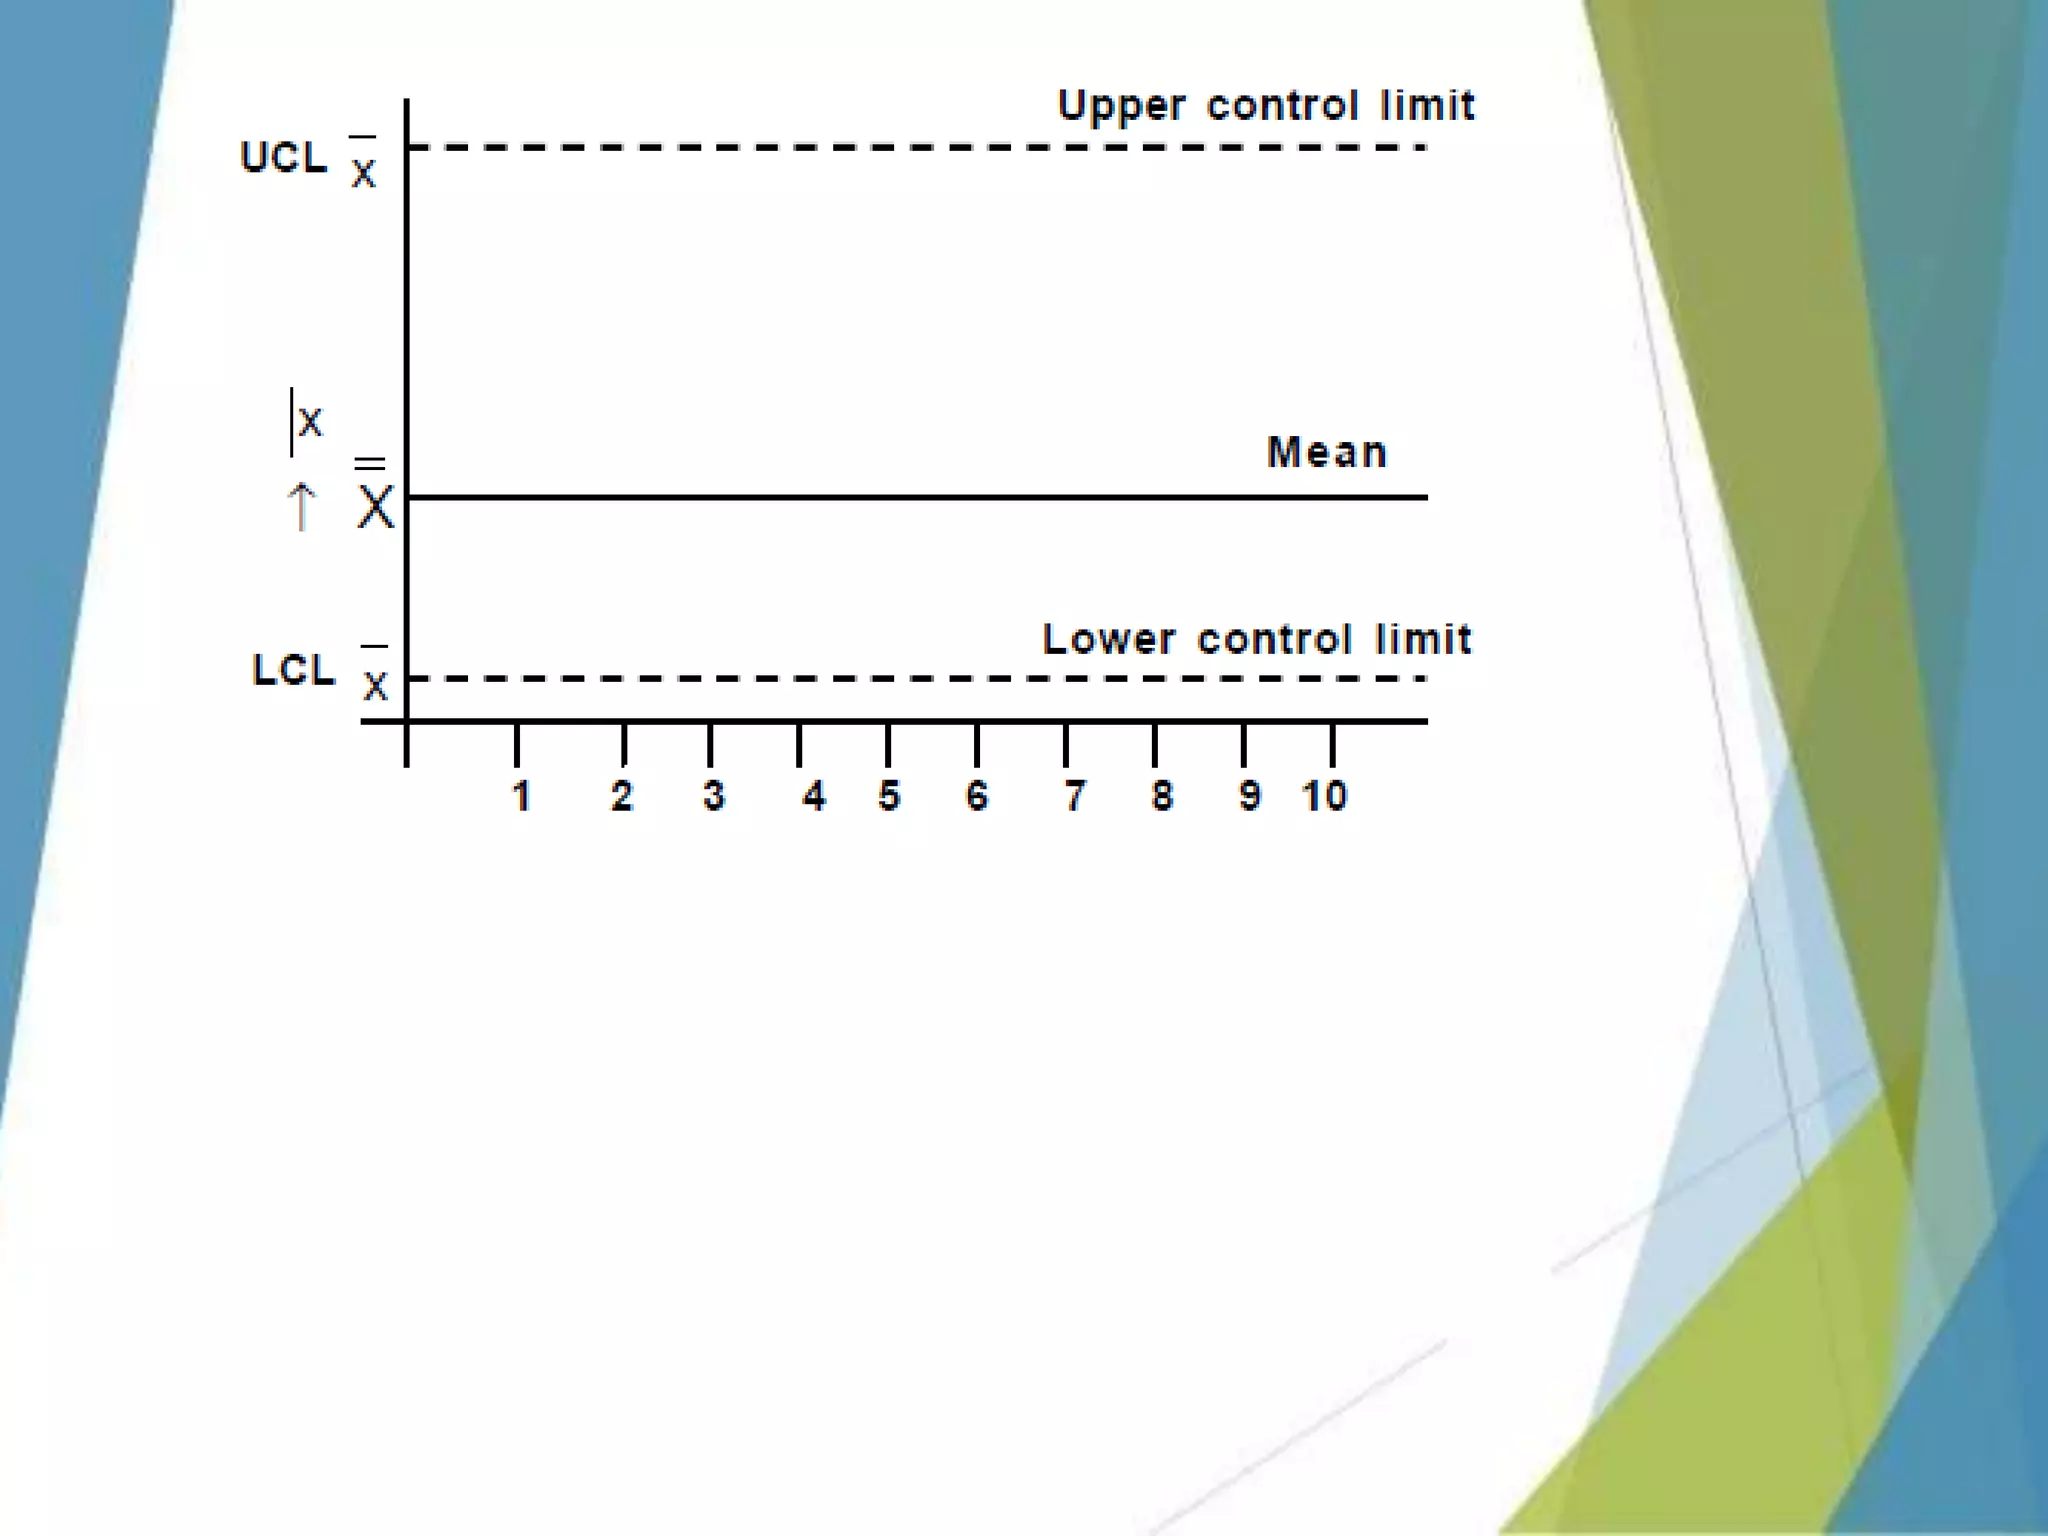
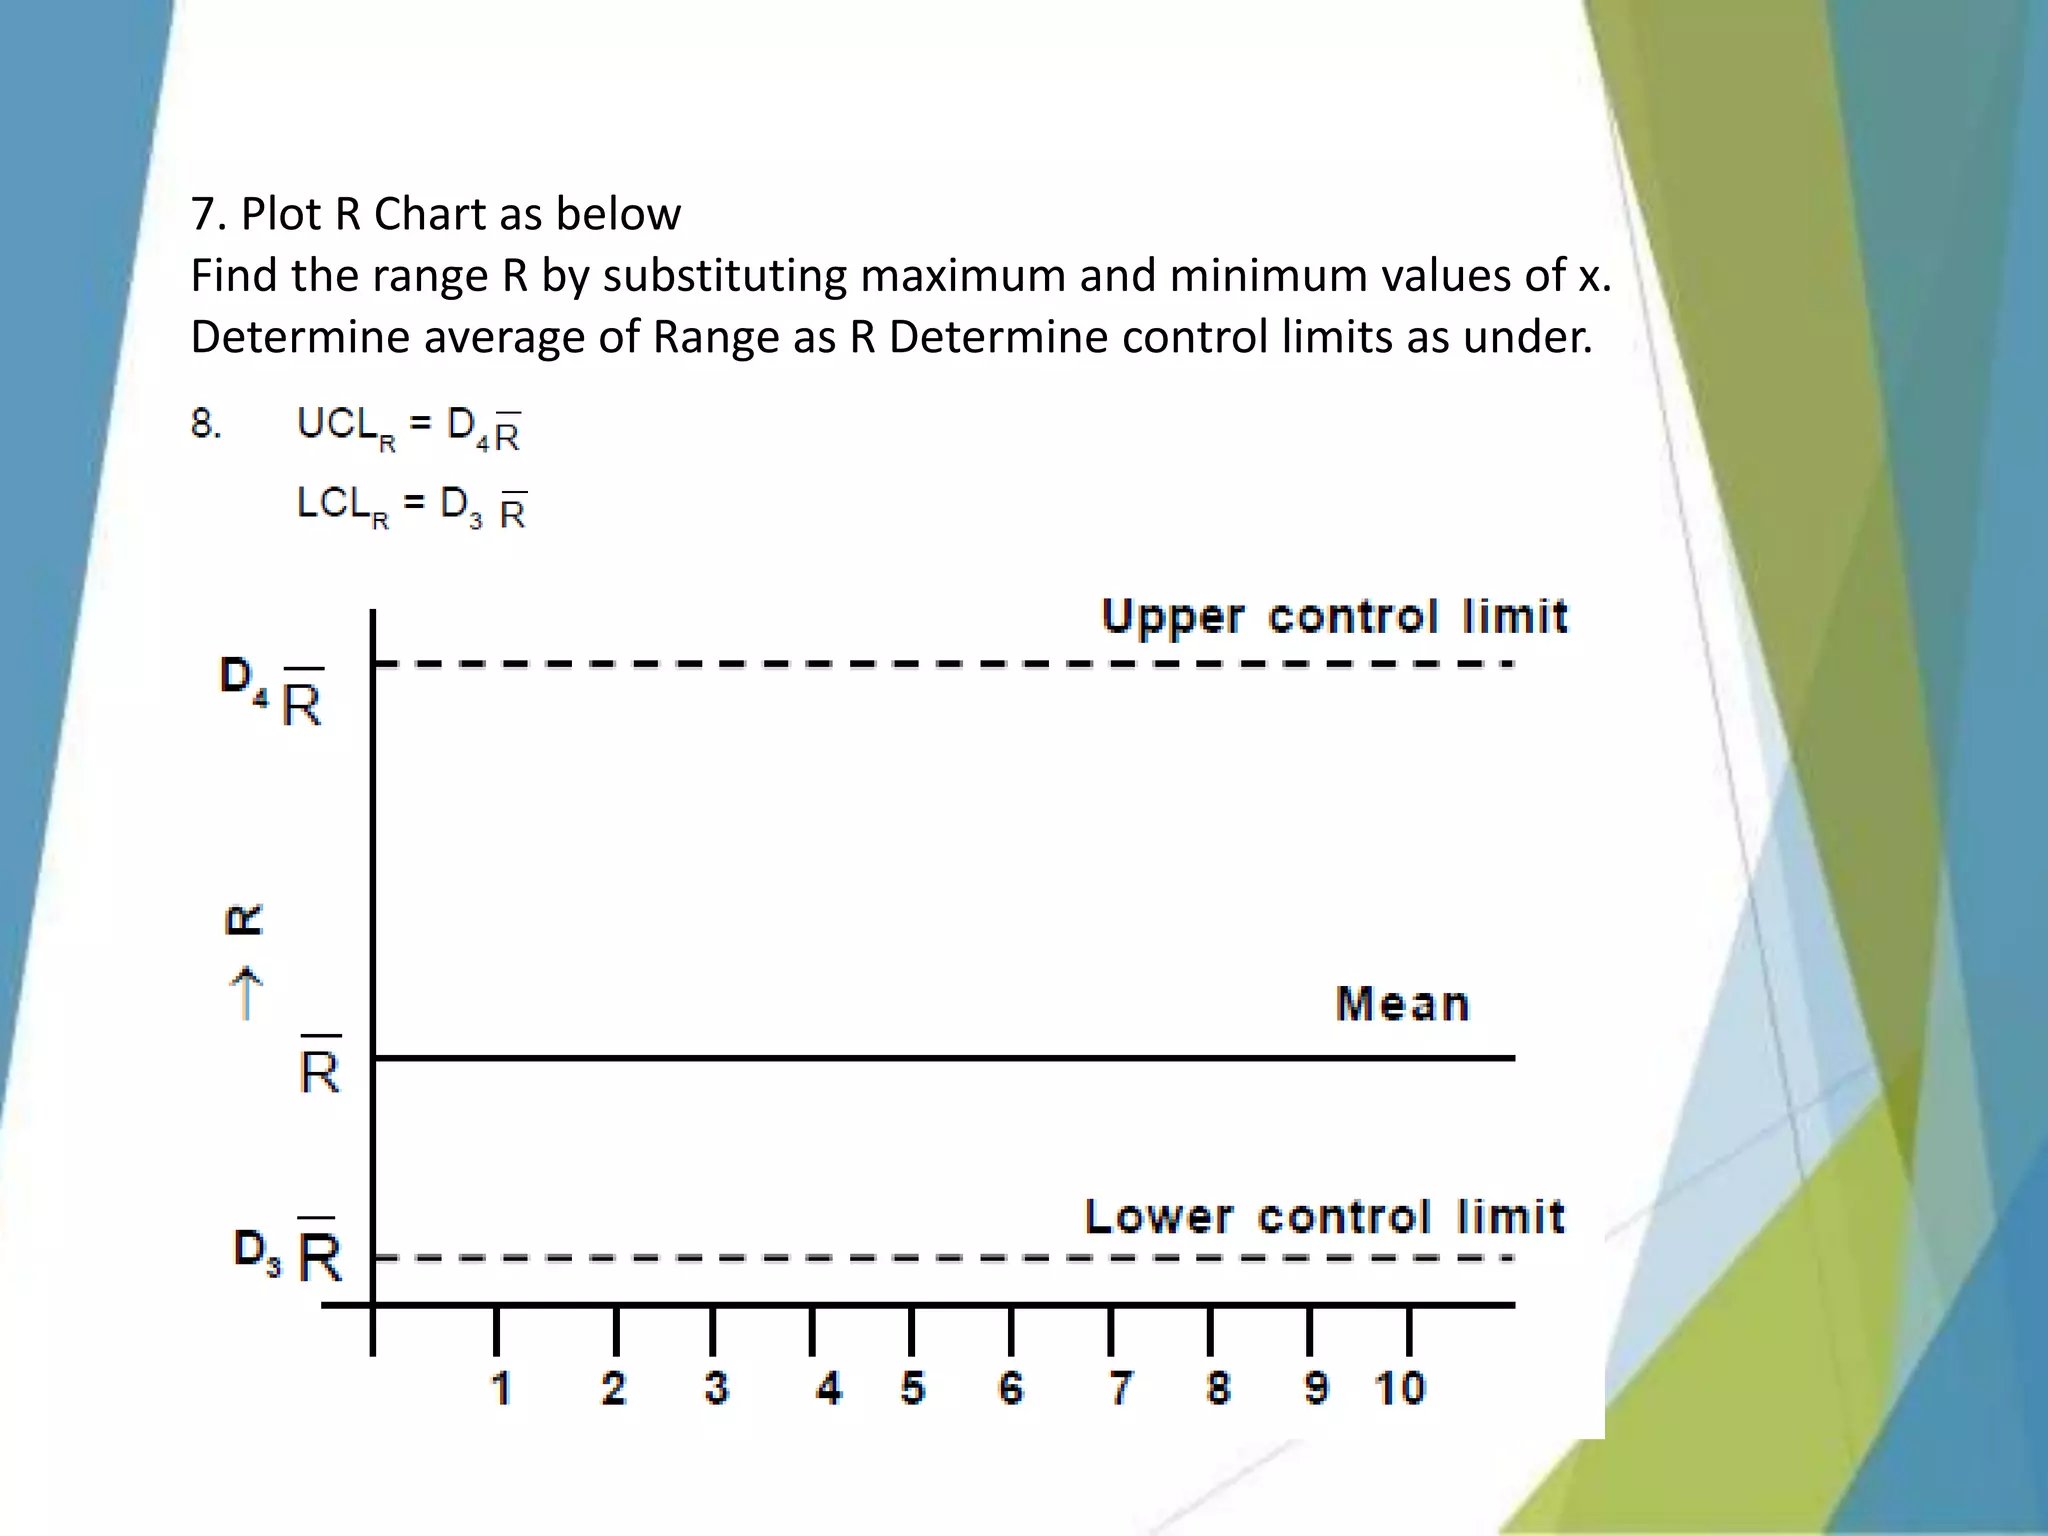
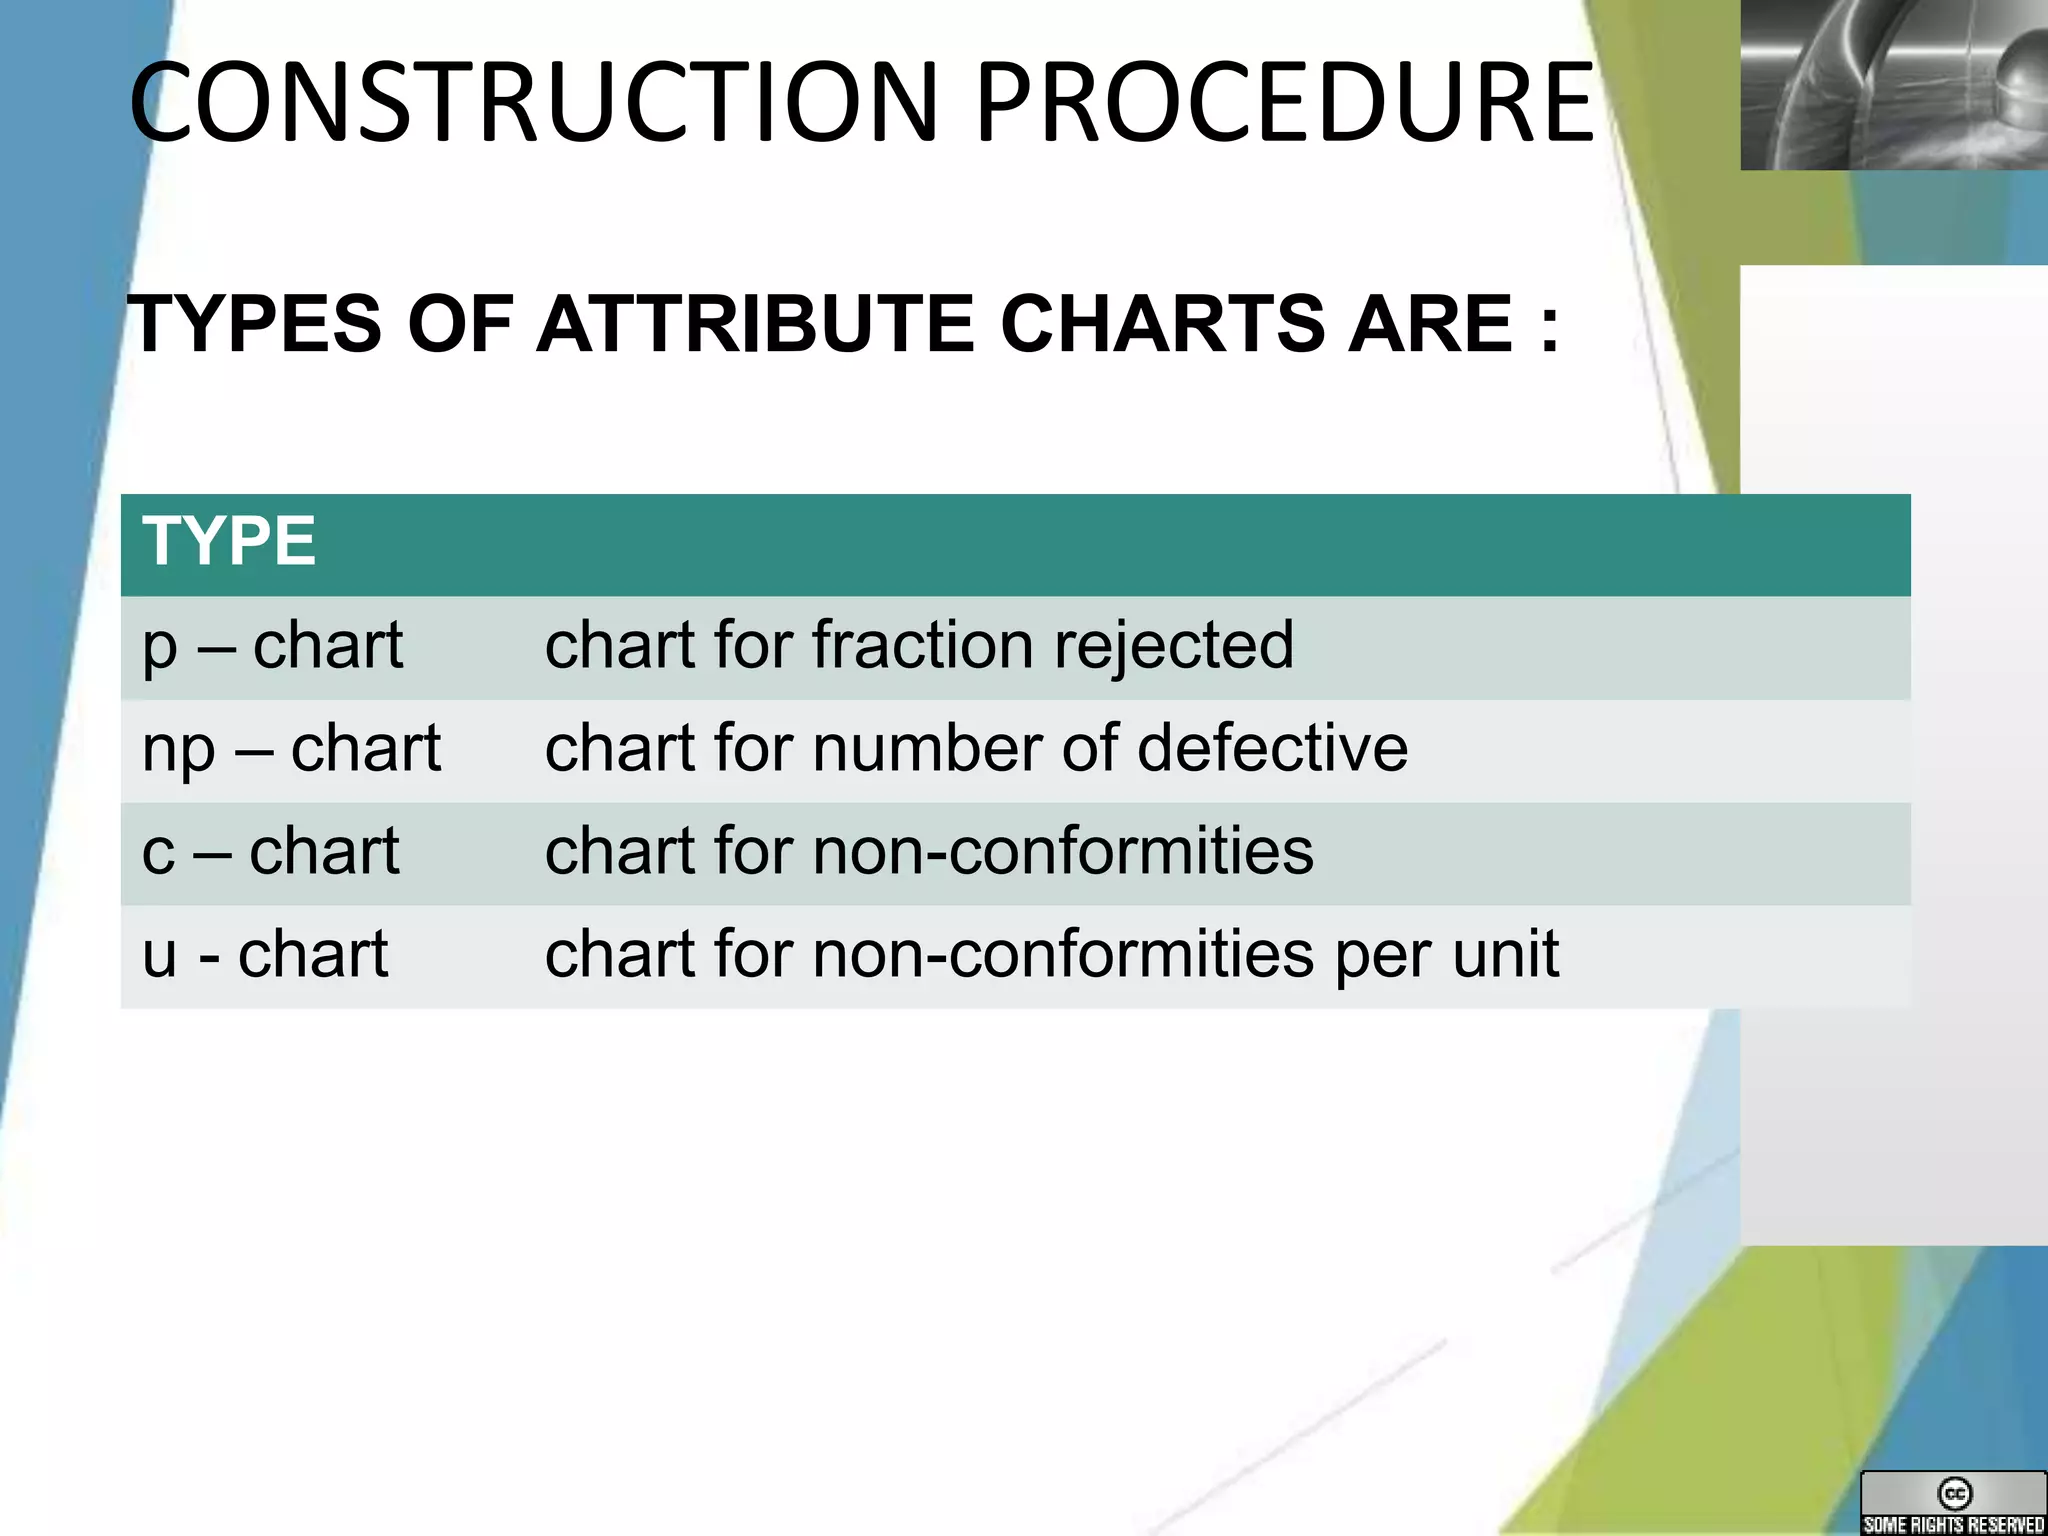
This document provides an overview of statistical quality control (SQC) and control charts. It defines key terms like quality, control, variation, and statistics. It explains the difference between common and assignable causes of variation. Different types of control charts are described for attributes and variables data, including how to construct X-bar and R charts. Sources of variation and how to interpret control charts are also summarized. The goal of SQC is to reduce variability in processes through the use of statistical principles and control charts.
1. STATISTICAL QUALITY
CONTROL
Prepared By –
Ms. H.N.DAVE
Lecturer (Mechanical Engg. Dept.)
R.C. Technical Institute, Ahmedabad
HINIDAVE2005@gmail.com
CHAPTER 4
2.
3. • STATITICS IS RELATED TO
THE USE OF STATISTICS
• CLASSIFICATION,
SUMMARIZING AND
PRESENTATION OF
QUANTITATIVE DATA
STATISTICS
• QUALITY REFERS TO THE
DISTINCTIVE PROPERTY
OF PRODUCT TO DELIGHT
THE CUSTOMER
QUALITY • FINDING VARIATIONS BY
COMPARING WITH THE
STANDARDS AND TAKING
CORRECTIVE ACTION
CONTROL
THE CONTROL OF QUALITY WITH THE HELP OF
STATISTICAL PRINCIPLES IS KNOWN AS STATISTICAL
QUALITY CONTROL
4.
5.
6.
7.
8.
9.
10.
11. Sources of Variation
• Variation exists in all processes.
• Variation can be categorized as either;
– Common or Random causes of variation, or
• Random causes that we cannot identify Unavoidable
• e.g. slight differences in process variables like diameter,
weight, service time, temperature
-Assignable causes of variation
• Causes can be identified and eliminated
• e.g. poor employee training, worn tool, machine needing
repair
Variation
12. • A process that is operating with
only chance causes of variation
present is said to be in statistical
control.
• A process that is operating in the
presence of assignable causes is
said to be out of control.
• The eventual goal of SPC is the
elimination of variability in the
process.
15. LOGO
ATTRIBUTE VS VARIABLE
Attribute Variable
Used for product characteristics
that can be evaluated with a
discrete response (pass/fail,
yes/no, good/bad, number
defective)
Used when the quality
characteristic can be measured
and expressed in numbers
less costly when it comes to
collecting data
must be able to measure the
quality characteristics in numbers
can plot multiple characteristics on
one chart
may be impractical and
uneconomical
loss of information vs variable
chart
16. LOGO
ADVANTAGES & DISADVANTAGES
Advantages Disadvantages
Some quality characteristics can only
be viewed as a attribute
Attributes don’t measure the
degree to which specifications are
met or not met
Quality characteristic may be
measurable as a variable but an
attribute is used for time, cost or
convenience
Doesn’t provide much information
on cause
Combination of variables can be
measured as an attribute rather than
use a multivariate chart
Variable chart can indicate
potential changes which allow
preventive actions
loss of information vs variable
chart
Larger sample size required
17. COMMON CAUSE ATTRIBUTES SPECIAL CAUSE ATTRIBUTES
Wikipedia gives the following 16 item list
for common cause variability:
1. Inappropriate procedures
2. Incompetent employees
3. Insufficient training
4. Poor design
5. Poor maintenance of machines
6. Lack of clearly defined standing
operating procedures (SOPs)
7. Poor working conditions, e.g. lighting,
noise, dirt, temperature, ventilation
8. Machines not suited to the job
9. Substandard raw materials
10. Assurement Error
11. Quality control error
12. Vibration in industrial processes
13. Ambient temperature and humidity
14. Normal wear and tear
15. Variability in settings
16. Computer response time
Wikipedia gives the following 11 item list
for special cause variability:
1. Poor adjustment of equipment
2. Operator falls asleep
3. Faulty controllers
4. Machine malfunction
5. Computer crashes
6. Poor batch of raw material
7. Power surges
8. High healthcare demand from elderly
people
9. Abnormal traffic (click-fraud) on web
ads
10. Extremely long lab testing turnover
time due to switching to a new
computer system
11. Operator absent
18. Types of control charts
• Variables Control Charts
– These charts are applied to data that
follow a continuous distribution.
• Attributes Control Charts
– These charts are applied to data that
follow a discrete distribution.
19.
20.
21. SQC Chartsprovides
Developed by Dr Walter A. Shewhart of Bell Laboratories from 1924
Graphical and visual plot of changes in the data over time ; This is
necessary
for visual management of your process.
Charts have a Central Line and ControlLimits to detect Special
Cause variation.
Usually, its sample statistic is plotted over time. Sometimes, the
actual value
of the quality characteristic is plotted.
LCL & UCL are
vital guidelines
for deciding
when action
should be
taken in a
process
Each point is usually a
sample statistic (such as
subgroup average) of
the quality
characteristic
Center Line
represents mean
operating level of
process
22. Control ChartAnatomy
Special Cause
Variation
Process is “Out
of Control”
Special Cause
Variation
Process is “Out
of Control”
Run Chart of
data points
Process Sequence/Time Scale
Mean
+/-
3
sigma
Upper Control
Limit
Common Cause
Variation
Process is “In
Control”
Lower Control
Limit
23. Control and Out ofControl
10
Outlier
Outlier
99.7%
3
2
1
95%
68%
-1
-2
-3
25. TYPES OF CONTROLCHART
17
There are two main categories of Control Charts, those
that display attribute data, and those that display
variables data.
Attribute Data: This category of Control Chart displays
data that result from counting the number of occurrences
or items in a single category of similar items or
occurrences. These “count” data may be expressed as
pass/fail, yes/no, or presence/absence of a defect.
Variables Data: This category of Control Chart displays
values resulting from the measurement of a continuous
variable. Examples of variables data are elapsed time,
temperature, and radiation dose.
26. TYPES& SELECTIONOFCONTROLCHART
18
What type of
data do I
have?
Variable Attribute
Counting
defects or
defectives?
X-bar & S
Chart
I & MR
Chart
X-bar & R
Chart
n > 10 1 < n <
10
n = 1
Defective
s
Defect
s
What
subgroup size
is available?
Constant
Sample Size?
Constant
Opportunity?
yes yes
no no
np Chart u Chart
p Chart c Chart
Note: A defective unit can
have more than one defect.
27. PROCEDURE TO PLOT X – R CHART
1. Draw random samples each of 3,4 or 5 items, Sufficient
numbers of samples around 20 to 25 shoudl be taken over period
so that all possible variations are
included for determination of process average. Measure the
critical variable x.
2. Tabulate the data collected and find i.e. mean and R,i.e. range
difference between
maximum and minimum value of x.
3. Determine average of and R.
28. 6. Plot the charts taking control limits and mean on Y-
axis and nos of samples on X- axis.
29.
30. 7. Plot R Chart as below
Find the range R by substituting maximum and minimum values of x.
Determine average of Range as R Determine control limits as under.
31. 9. Make the points by taking and R for each sample and join then by
straight line.
10. Standard deviation can be determined as
32. X-bar and R or S Control Charts
Control Chart (from ):
R
Chart:
x R
32
33.
34. Example 5.1
During production of carbon steel pins on an automatic lathe machine, eleven
samples each of 4- pins were randomly taken and inspection was carried out. The
lengths of pin were measured during inspection. Construct x - R chart and
establish control limits. The inspection data are given as under.
35.
36.
37.
38.
39.
40. EXAMPLE 3 :
For sample size of 5, A2 = 0.577, D4 =2.114, D3 = 0. Construct - R chart and
determine control limits of range R.
46. LOGO
p, np - Chart
p and np charts deal with nonconforming
P is fraction nonconforming
np is total nonconforming
C h a r t s based on Binomial distribution.
S a m p l e size must be large enough (example p
=
2
%
)
Definition of anonconformity.
Probability the same from item toitem.
DEFECT VS DEFECTIVES
47. LOGO
c, u - Charts
c and u charts deal with nonconformities.
c Chart – total number of nonconformities
u Chart – nonconformities per unit
C h a r t s based on Poisson distribution.
S a m p l e size, constant probabilities.
DEFECT VS DEFECTIVES
48. LOGO
CONSTRUCTION PROCEDURE
The following procedure is used to construct all type of
attribute charts
Step 1
Preliminary samples are taken and inspected
Step 2
When the process achieves the control state, the required
quality characteristics is measured and recorded in the
prescribed data sheet
Step 3
Trial control limits are calculated using appropriate
formulae. Each chart is suitable for different applications
49. LOGO
CONSTRUCTION PROCEDURE
Step 4
Step 5
Draw the control limits for computed values
Draw the control chart
Let X – axis Be the sample number
Let Y – axis Be the fraction defectives for the p–charts
Be the number of defectives for the np–charts
Be the number of non-conformities for the c–chart
Be the number of non-conformities per unit for the u – chart
UCL (Dotted line)
Centre Line, CL (Continuous line)
LCL (Dotted line)
50. LOGO
CONSTRUCTION PROCEDURE
Step 6
Plot all the measured points (i.e.,past data) on the
appropriate charts. Connect successive points by straight
line segments.
Step 7
If all the points fall within the trial control limits, accept the
trial control limits for present and future references.
Step 8
If there is no systematic behaviour (i.e.,it implies random
pattern), it shown that the process was in control in the
past, therefore, the trial control limits are suitable for
controlling current and future production.
51. LOGO
CONSTRUCTION PROCEDURE
Revised control limits:
Step 9
If one or more points fall outside the control limits, try to find
the causes and eliminate these points to the calculation of
the revised control limits.
Step 10
Draw the revised control limits on the previously draw chart
itself.
52. LOGO
CONSTRUCTION PROCEDURE
Step 11
If the points other than the eliminated points fall within the
revised control limits, accept the revised control limits for
present and future use.
Step 12
If one or more points other than the removed points fall
outside the revised control limits, repeat the process as
before.
53. LOGO
CONSTRUCTION PROCEDURE
TYPES OF ATTRIBUTE CHARTS ARE :
TYPE
p – chart chart for fraction rejected
np – chart chart for number of defective
c – chart chart for non-conformities
u - chart chart for non-conformities per unit
54. LOGO
P CHART FORMULA
n
p
p(1 p)
UCL p 3
n
p
p(1 p)
LCL p 3
Totalnumberinspected
p
Total numberof defectives
p
CentreLine,CL
The centre line and upper and lower control limits for the P
charts are :
55. LOGO
P CHART EXAMPLE
Day No. of defectives
1 4
2 0
3 3
4 2
5 3
6 5
7 1
8 2
9 2
10 0
Problem : (constant sample size)
The following table gives the result of inspection of 50 items per
day for 20 days. Construct the fraction defectives or percent
defectives chart and give inference about the process.
Day No. of defectives
11 3
12 4
13 2
14 5
15 1
16 0
17 4
18 4
19 5
20 2
56. LOGO
P CHART EXAMPLE
1000
Solution : (constant sample size)
Centre Line,CLp p
Total number of defectives
52 0.052
Total number inspected
50
0.052(10.052)
n
p
UCL p 3
p(1 p)
0.052 3
0.052 0.0942 0.1462
50
0.052(10.052)
n
p
LCL p 3
p(1 p)
0.052 3
0.052 0.0942 0.0422 0
57. LOGO
P CHART EXAMPLE
Inference :
•All the sample points fall within the control limit and pattern of variation shows the
random pattern.
•The process is in control.
•This limits can be used for future references.
58. LOGO
P CHART EXAMPLE
Problem : (variable sample size)
Construct the fraction defectives or percent defectives chart
and give inference about the process.
Day Sample
size
No. of
defectives
1 200 4
2 200 2
3 300 4
4 300 5
5 300 3
6 300 3
7 250 1
8 250 2
9 250 2
10 250 4
Day Sample
size
No. of
defectives
11 250 2
12 250 5
13 250 4
14 250 5
15 250 2
16 200 0
17 200 1
18 200 3
19 200 1
20 200 3
60. LOGO
P CHART EXAMPLE
Inference :
•All the sample points fall within the control limit and pattern of variation shows the
random pattern.
•The process is in control.
•This limits can be used for future references.
61. LOGO
np CHART FORMULA
np(1 p)
UCLnp np 3
np(1 p)
LCLnp np 3
Number ofsamples
np
Total numberof defectives
np
CentreLine,CL
The centre line and upper and lower control limits for the np
charts are :
62. LOGO
np CHART EXAMPLE
Problem :
The following table
gives the result of
inspection of 100 items
per day for 25 days.
Construct the fraction
defectives or percent
defectives chart and
give inference about
the process.
Sample n Number of defective
100
100
100
100
100
100
100
100
100
100
100
100
100
100
100
100
100
100
100
100
100
2
0
3
0
0
0
1
1
1
0
0
2
1
3
1
1
2
1
1
0
3
1
2
3
4
5
6
7
8
9
10
11
12
13
14
15
16
17
18
19
20
21
22
23
24
25
100
100
100
100
0
1
0
1
63. LOGO
np CHART EXAMPLE
25
Solution :
Centre Line,CLnp np
Total number of defectives
25 1 . 0
No.ofsamples
1.0(10.01)
np(1 p) 1 .0 3
UCLnp np 3
1 .0 2.985 3.985
1.0(10.01)
np(1 p) 1 .0 3
LCLnp np 3
1 .0 2.985 1.985 0
0.01
25
2500
p
Total number of defectives
Total number inspected
64. LOGO
np CHART EXAMPLE
Inference :
•All the sample points fall within the control limit and pattern of variation shows the
random pattern.
•The process is in control.
•This limits can be used for future references.
65. LOGO
C CHART FORMULA
The centre line and upper and lower control limits for the c
charts are :
UCLc c 3 c
LCLc c 3 c
Number ofsamples
c
Total number of defects
CLc
66. LOGO
C CHART EXAMPLE
Problem :
In a copper foil laminations process
for every 500 feet of foil laminated,
one square foot of the laminated
copper foil is examned for visual
defect such as unever lamination,
scrath, etc. The data collected are
shown in the table below. Calculate
the control limit and plot the c-chart.
Time Number of Defect
5
3
2
6
6
7
3
3
6
7
7
9
7
5
3
12
6
10
100
200
300
400
500
600
700
800
900
1000
1100
1200
1300
1400
1500
1600
1700
1800
1900
2000
2100
2200
2300
2400
100
200
7
2
6
8
0
7
4
3
67. LOGO
np CHART EXAMPLE
Solution :
26
No.ofsamples
Centre Line,CLc c
Total number of defects
144 5.54
UCLc c 3 c 5.54 3 5.54
5.54 7 .0 6 12.60
LCLc c 3 c 5.54 3 5.54
5.54 7.06 1.52 0
68. LOGO
C CHART EXAMPLE
Inference :
•All the sample points fall within the control limit and pattern of variation shows the
random pattern.
•The process is in control.
•This limits can be used for future references.
69. LOGO
U CHART FORMULA
n
u
u
UCL u 3
n
u
u
LCL u 3
n
u
CentreLine,CL u
c
The centre line and upper and lower control limits for the u
charts are :
70. LOGO
U CHART EXAMPLE
Problem :
A radio manufacturer wishes to
use SQC charts for the detection
of non-conformities per unit on
the final assembly line. The
sample size is finalised as 10
radios. The data collected are
shown in the table. Calculate the
control limit and plot the u-chart.
Sample
number
Number of
non-conformities
1
2
3
4
5
6
7
8
9
10
11
12
13
14
15
16
17
18
20
10
11
15
10
14
13
18
12
19
20
18
14
17
20
22
18
19
20
10
14
12
71. LOGO
U CHART EXAMPLE
20
Solution :
c
Total number of defects
307 15.35
No.ofsamples
10
1.54
u
UCL u 3
u
1.54 3
n
1.54 1.18 2.72
10
n
Centre Line,CLu u
c
15.35 1.53
10
1.54
n
1.54 1.18 0.36
u
LCL u 3
u
1.54 3
72. LOGO
U CHART EXAMPLE
Sample
number
Sample
size
Number of
non-conformities (c)
Number of
non-conformities per unit (u)
1 10 18 1.8
2 10 20 2.0
3 10 10 1.0
4 10 11 1.1
5 10 15 1.5
6 10 10 1.0
7 10 14 1.4
8 10 13 1.3
9 10 18 1.8
10 10 12 1.2
11 10 19 1.9
12 10 20 2.0
13 10 18 1.8
14 10 14 1.4
15 10 17 1.7
16 10 20 2.0
17 10 22 2.2
18 10 10 1.0
19 10 14 1.4
20 10 12 1.2
73. LOGO
U CHART EXAMPLE
Inference :
•All the sample points fall within the control limit and pattern of variation shows the
random pattern.
•The process is in control.
•This limits can be used for future references.