Download as PDF, PPTX
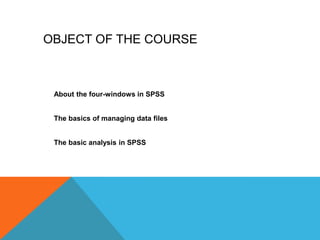
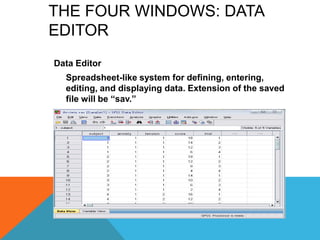
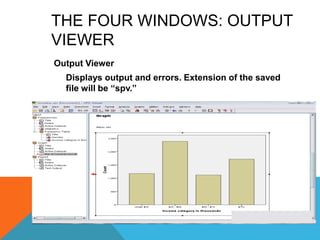
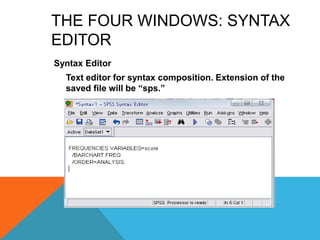
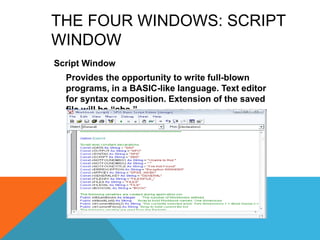
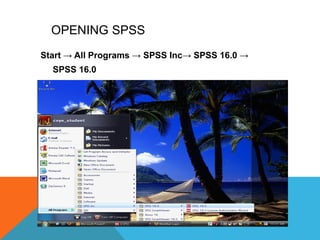
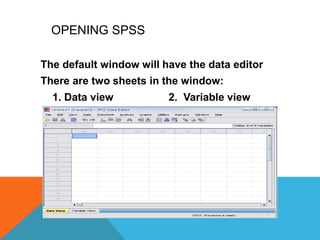
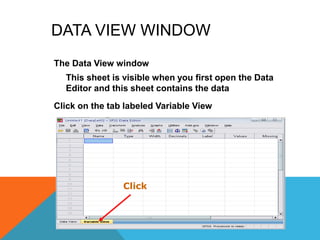
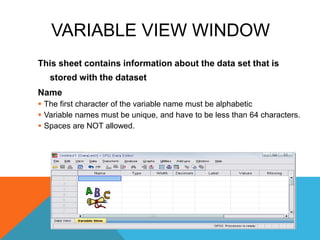
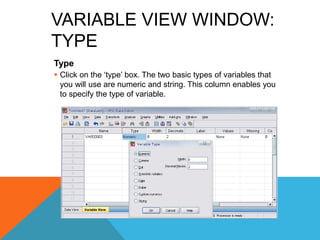

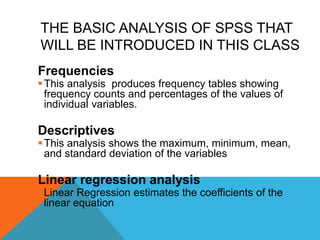
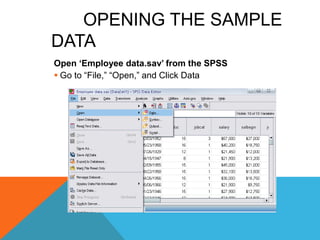
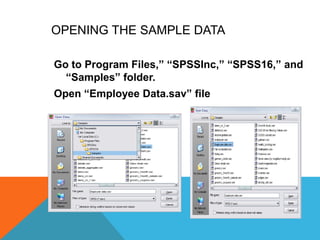
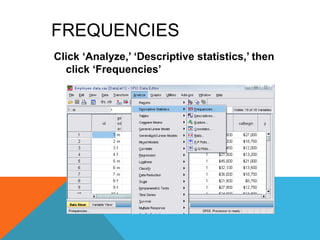
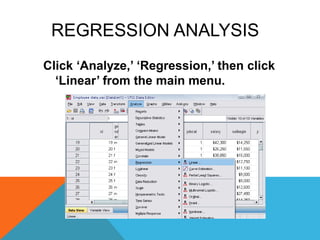
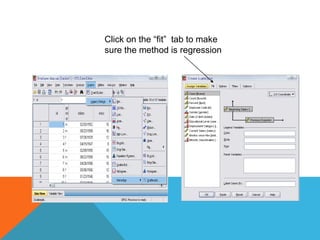
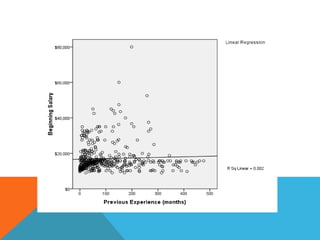

This document provides an overview of using the SPSS statistical package for data analysis. It discusses the four main windows in SPSS - the data editor, output viewer, syntax editor, and script window. It also covers the basics of managing data files, including opening SPSS, defining variables, and saving data. Finally, it introduces some basic analysis techniques in SPSS like frequencies, descriptives, and linear regression analysis.