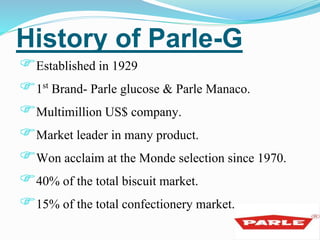
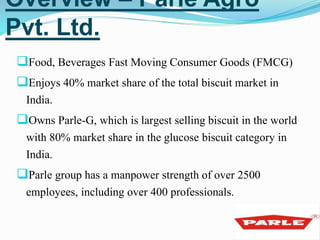
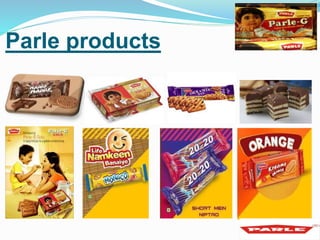
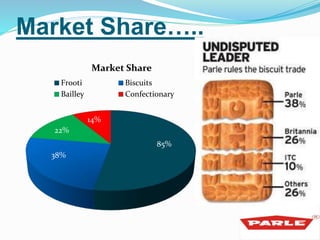
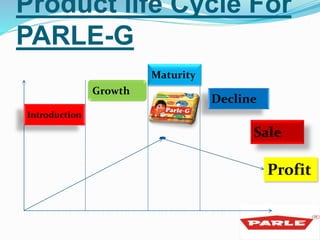
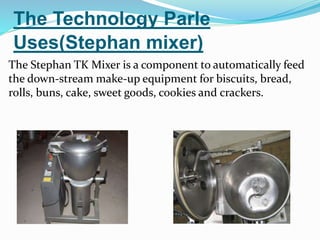
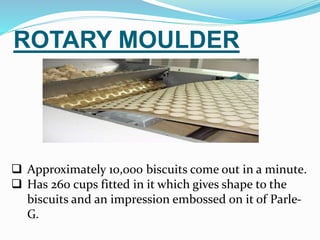
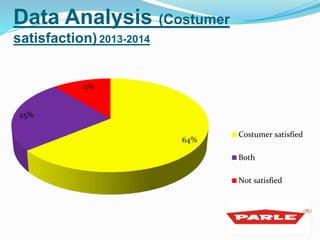
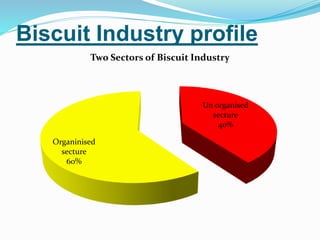
Introduction(Biscuits Industry in India) 
Largest Manufacturer’s of Biscuits & Confectionaries almost 
80 years. 
Parle itself symbolizes quality grate taste. 
Most are Parle product are market leaders. 
Available Everyone. 
Beacon of faith & trust for the consumers. 
Grate strength is extremely widespread distribution network.
History of Parle-G 
Established in 1929 
1st Brand- Parle glucose & Parle Manaco. 
Multimillion US$ company. 
Market leader in many product. 
Won acclaim at the Monde selection since 1970. 
40% of the total biscuit market. 
15% of the total confectionery market.
Overview – Parle Agro 
Pvt. Ltd. 
Food, Beverages Fast Moving Consumer Goods (FMCG) 
Enjoys 40% market share of the total biscuit market in 
India. 
Owns Parle-G, which is largest selling biscuit in the world 
with 80% market share in the glucose biscuit category in 
India. 
Parle group has a manpower strength of over 2500 
employees, including over 400 professionals.
Parle products
Market Share….. 
Frooti Biscuits 
Bailley Confectionary 
85% 
22% 
38% 
Market Share 
14%
Product life Cycle For 
PARLE-G 
Introduction 
Growth 
Maturity 
Decline 
Sale 
Profit
The Technology Parle 
Uses(Stephan mixer) 
The Stephan TK Mixer is a component to automatically feed 
the down-stream make-up equipment for biscuits, bread, 
rolls, buns, cake, sweet goods, cookies and crackers.
The Stephan Mixer 
Process 
The operation can be divided into four phases: 
1. Loading 
2. Mixing 
3. Kneading 
4. Discharging
process 
Raw Materials Testing Mixing 
Moulding 
Baking 
Cooling 
Packing
ROTARY MOULDER 
 Approximately 10,000 biscuits come out in a minute. 
 Has 260 cups fitted in it which gives shape to the 
biscuits and an impression embossed on it of Parle- 
G.
Data Analysis (Costumer 
satisfaction) 2013-2014 
64% 
25% 
11% 
Costumer satisfied 
Both 
Not satisfied
Achieve goal of Parle 
2014 E 60% 
2013 4o% 
2012 30% 
2011 20% 
2010 15% 
2009 11%
Annual production parle 
16 
14 
12 
10 
8 
6 
4 
2 
0 
Product demand 
Product qulity 
Product price
Annual growth rate of Biscuit 
Industry 
100% 
90% 
80% 
70% 
60% 
50% 
40% 
30% 
20% 
10% 
0% 
Not applicable 
Selling 
Demand
Biscuit Industry profile 
Un organised 
secture 
40% 
Organinised 
secture 
60% 
Two Sectors of Biscuit Industry
Conclusion
Technology Embalmed in Parle-G

Technology Embalmed in Parle-G

  • 2.
    Introduction(Biscuits Industry inIndia) Largest Manufacturer’s of Biscuits & Confectionaries almost 80 years. Parle itself symbolizes quality grate taste. Most are Parle product are market leaders. Available Everyone. Beacon of faith & trust for the consumers. Grate strength is extremely widespread distribution network.
  • 3.
    History of Parle-G Established in 1929 1st Brand- Parle glucose & Parle Manaco. Multimillion US$ company. Market leader in many product. Won acclaim at the Monde selection since 1970. 40% of the total biscuit market. 15% of the total confectionery market.
  • 4.
    Overview – ParleAgro Pvt. Ltd. Food, Beverages Fast Moving Consumer Goods (FMCG) Enjoys 40% market share of the total biscuit market in India. Owns Parle-G, which is largest selling biscuit in the world with 80% market share in the glucose biscuit category in India. Parle group has a manpower strength of over 2500 employees, including over 400 professionals.
  • 5.
  • 6.
    Market Share….. FrootiBiscuits Bailley Confectionary 85% 22% 38% Market Share 14%
  • 7.
    Product life CycleFor PARLE-G Introduction Growth Maturity Decline Sale Profit
  • 8.
    The Technology Parle Uses(Stephan mixer) The Stephan TK Mixer is a component to automatically feed the down-stream make-up equipment for biscuits, bread, rolls, buns, cake, sweet goods, cookies and crackers.
  • 9.
    The Stephan Mixer Process The operation can be divided into four phases: 1. Loading 2. Mixing 3. Kneading 4. Discharging
  • 10.
    process Raw MaterialsTesting Mixing Moulding Baking Cooling Packing
  • 11.
    ROTARY MOULDER Approximately 10,000 biscuits come out in a minute.  Has 260 cups fitted in it which gives shape to the biscuits and an impression embossed on it of Parle- G.
  • 12.
    Data Analysis (Costumer satisfaction) 2013-2014 64% 25% 11% Costumer satisfied Both Not satisfied
  • 13.
    Achieve goal ofParle 2014 E 60% 2013 4o% 2012 30% 2011 20% 2010 15% 2009 11%
  • 14.
    Annual production parle 16 14 12 10 8 6 4 2 0 Product demand Product qulity Product price
  • 15.
    Annual growth rateof Biscuit Industry 100% 90% 80% 70% 60% 50% 40% 30% 20% 10% 0% Not applicable Selling Demand
  • 16.
    Biscuit Industry profile Un organised secture 40% Organinised secture 60% Two Sectors of Biscuit Industry
  • 17.