Types of statistics
•Descriptive- summarize or describe our observations
• Inferential- use observations to allow us to make predictions
(inferences) about a situation that has not yet occurred
3.
Descriptive or Inferential?
•I cycle about 50 km per week on average.
• We can expect a lot of rain this time of year.
4.
Population vs Sample
•A population refers to all the cases to which a researcher wants his
estimates to apply to: White mice, lightbulb life, students
• A sample is used because it is normally impossible to study all the
members of a population
• Descriptive stats simply summarize a sample
• Inferential stats generalize from a sample to the wider population
5.
Variables
• Samples aremade up of individuals, all individuals have
characteristics. Members of a sample will differ on certain
characteristics. Hence, we call this variation amongst individuals
variable characteristics or variables for short.
6.
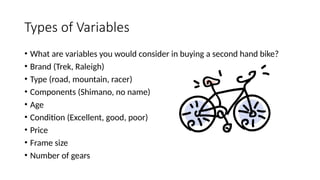
Types of Variables
•What are variables you would consider in buying a second hand bike?
• Brand (Trek, Raleigh)
• Type (road, mountain, racer)
• Components (Shimano, no name)
• Age
• Condition (Excellent, good, poor)
• Price
• Frame size
• Number of gears
7.
SPSS at aglance
• Originally it is an acronym of Statistical Package for the Social
Science but now it stands for Statistical Product and Service
Solutions
• One of the most popular statistical packages which can perform
highly complex data manipulation and analysis with simple
instructions
8.
Scale of Measurement
•Nominal (categorical) e.g. race, colour, sex, job status, etc.
• Ordinal (categorical) e.g. the effect of a drug could be none, mild and
severe, job importance (1-5, 1 being not important and 5 very
important), etc.
• Interval (continuous, covariates, scale, metric) e.g. temperature (in
Celsius), weight (in stones or Kg), height (in inches or cm), etc.
9.
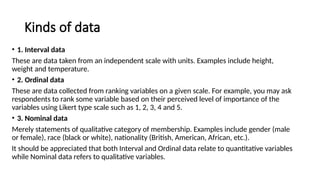
Kinds of data
•1. Interval data
These are data taken from an independent scale with units. Examples include height,
weight and temperature.
• 2. Ordinal data
These are data collected from ranking variables on a given scale. For example, you may ask
respondents to rank some variable based on their perceived level of importance of the
variables using Likert type scale such as 1, 2, 3, 4 and 5.
• 3. Nominal data
Merely statements of qualitative category of membership. Examples include gender (male
or female), race (black or white), nationality (British, American, African, etc.).
It should be appreciated that both Interval and Ordinal data relate to quantitative variables
while Nominal data refers to qualitative variables.
10.
You know thebasics of using a computer such
as:
• 1. How to start applications
• 2. How to use your mouse
• 3. How to move and close windows.
• 4. How to save and open a file.
11.
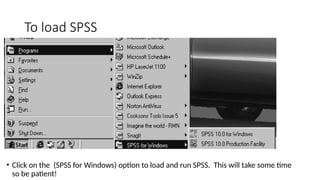
To load SPSS
•Click on the (SPSS for Windows) option to load and run SPSS. This will take some time
so be patient!
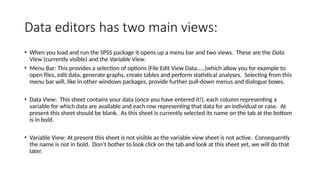
Data editors hastwo main views:
• When you load and run the SPSS package it opens up a menu bar and two views. These are the Data
View (currently visible) and the Variable View.
• Menu Bar: This provides a selection of options (File Edit View Data.....)which allow you for example to
open files, edit data, generate graphs, create tables and perform statistical analyses. Selecting from this
menu bar will, like in other windows packages, provide further pull-down menus and dialogue boxes.
• Data View: This sheet contains your data (once you have entered it!), each column representing a
variable for which data are available and each row representing that data for an individual or case. At
present this sheet should be blank. As this sheet is currently selected its name on the tab at the bottom
is in bold.
• Variable View: At present this sheet is not visible as the variable view sheet is not active. Consequently
the name is not in bold. Don’t bother to look click on the tab and look at this sheet yet, we will do that
later.
14.
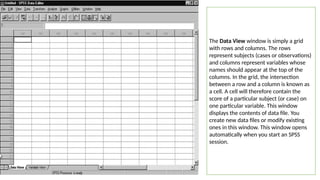
The Data Viewwindow is simply a grid
with rows and columns. The rows
represent subjects (cases or observations)
and columns represent variables whose
names should appear at the top of the
columns. In the grid, the intersection
between a row and a column is known as
a cell. A cell will therefore contain the
score of a particular subject (or case) on
one particular variable. This window
displays the contents of data file. You
create new data files or modify existing
ones in this window. This window opens
automatically when you start an SPSS
session.
15.
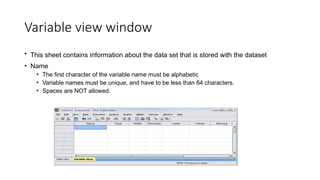
Variable view window
•This sheet contains information about the data set that is stored with the dataset
• Name
• The first character of the variable name must be alphabetic
• Variable names must be unique, and have to be less than 64 characters.
• Spaces are NOT allowed.
16.
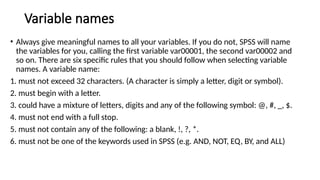
Variable names
• Alwaysgive meaningful names to all your variables. If you do not, SPSS will name
the variables for you, calling the first variable var00001, the second var00002 and
so on. There are six specific rules that you should follow when selecting variable
names. A variable name:
1. must not exceed 32 characters. (A character is simply a letter, digit or symbol).
2. must begin with a letter.
3. could have a mixture of letters, digits and any of the following symbol: @, #, _, $.
4. must not end with a full stop.
5. must not contain any of the following: a blank, !, ?, *.
6. must not be one of the keywords used in SPSS (e.g. AND, NOT, EQ, BY, and ALL)
17.
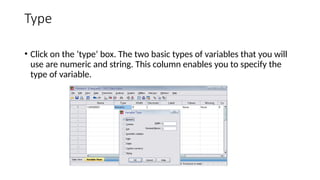
Type
• Click onthe ‘type’ box. The two basic types of variables that you will
use are numeric and string. This column enables you to specify the
type of variable.
18.
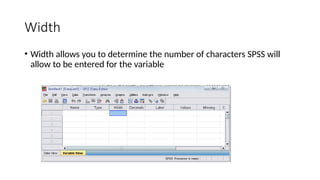
Width
• Width allowsyou to determine the number of characters SPSS will
allow to be entered for the variable
19.
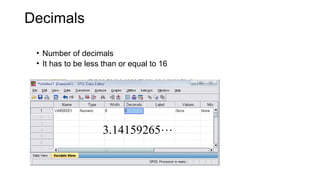
Decimals
• Number ofdecimals
• It has to be less than or equal to 16
3.14159265
20.
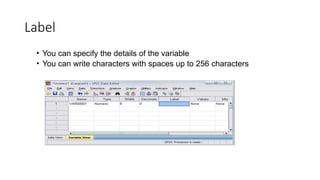
Label
• You canspecify the details of the variable
• You can write characters with spaces up to 256 characters
21.
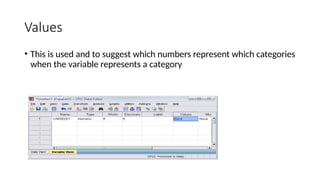
Values
• This isused and to suggest which numbers represent which categories
when the variable represents a category
22.
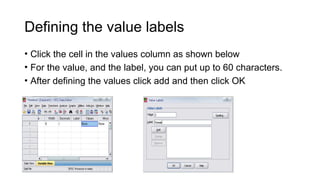
Defining the valuelabels
• Click the cell in the values column as shown below
• For the value, and the label, you can put up to 60 characters.
• After defining the values click add and then click OK
23.
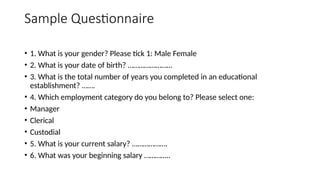
Sample Questionnaire
• 1.What is your gender? Please tick 1: Male Female
• 2. What is your date of birth? ……………………
• 3. What is the total number of years you completed in an educational
establishment? …….
• 4. Which employment category do you belong to? Please select one:
• Manager
• Clerical
• Custodial
• 5. What is your current salary? ……………….
• 6. What was your beginning salary …………..
24.
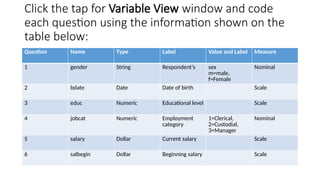
Click the tapfor Variable View window and code
each question using the information shown on the
table below:
Question Name Type Label Value and Label Measure
1 gender String Respondent’s sex
m=male,
f=Female
Nominal
2 bdate Date Date of birth Scale
3 educ Numeric Educational level Scale
4 jobcat Numeric Employment
category
1=Clerical,
2=Custodial,
3=Manager
Nominal
5 salary Dollar Current salary Scale
6 salbegin Dollar Beginning salary Scale
25.
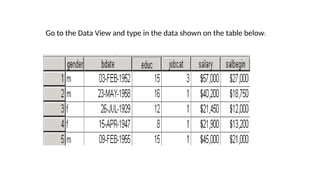
Go to theData View and type in the data shown on the table below:
26.
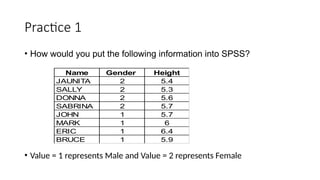
Practice 1
• Howwould you put the following information into SPSS?
• Value = 1 represents Male and Value = 2 represents Female
Name Gender Height
JAUNITA 2 5.4
SALLY 2 5.3
DONNA 2 5.6
SABRINA 2 5.7
JOHN 1 5.7
MARK 1 6
ERIC 1 6.4
BRUCE 1 5.9
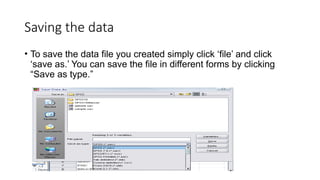
Saving the data
•To save the data file you created simply click ‘file’ and click
‘save as.’ You can save the file in different forms by clicking
“Save as type.”
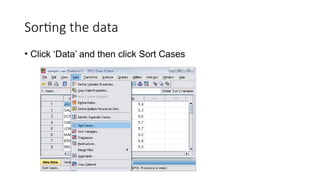
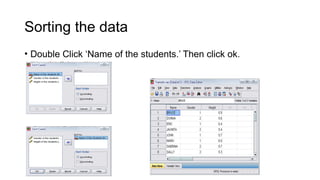
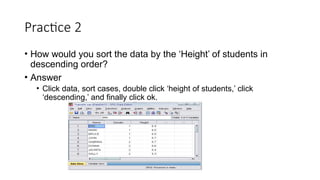
Practice 2
• Howwould you sort the data by the ‘Height’ of students in
descending order?
• Answer
• Click data, sort cases, double click ‘height of students,’ click
‘descending,’ and finally click ok.
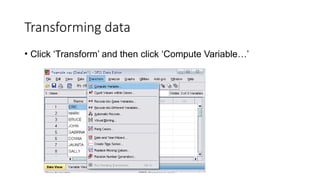
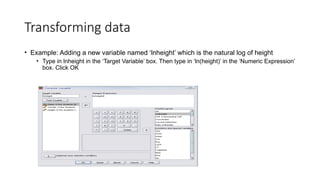
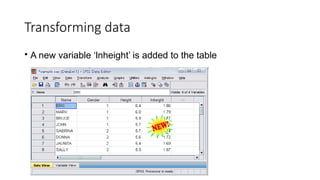
Transforming data
• Example:Adding a new variable named ‘lnheight’ which is the natural log of height
• Type in lnheight in the ‘Target Variable’ box. Then type in ‘ln(height)’ in the ‘Numeric Expression’
box. Click OK
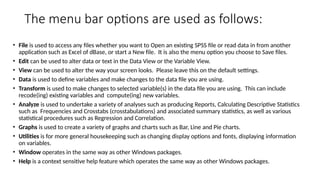
The menu baroptions are used as follows:
• File is used to access any files whether you want to Open an existing SPSS file or read data in from another
application such as Excel of dBase, or start a New file. It is also the menu option you choose to Save files.
• Edit can be used to alter data or text in the Data View or the Variable View.
• View can be used to alter the way your screen looks. Please leave this on the default settings.
• Data is used to define variables and make changes to the data file you are using.
• Transform is used to make changes to selected variable(s) in the data file you are using. This can include
recode(ing) existing variables and compute(ing) new variables.
• Analyze is used to undertake a variety of analyses such as producing Reports, Calculating Descriptive Statistics
such as Frequencies and Crosstabs (crosstabulations) and associated summary statistics, as well as various
statistical procedures such as Regression and Correlation.
• Graphs is used to create a variety of graphs and charts such as Bar, Line and Pie charts.
• Utilities is for more general housekeeping such as changing display options and fonts, displaying information
on variables.
• Window operates in the same way as other Windows packages.
• Help is a context sensitive help feature which operates the same way as other Windows packages.
39.
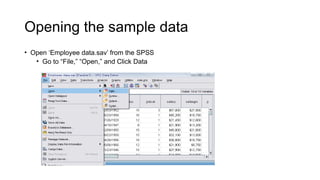
Opening the sampledata
• Open ‘Employee data.sav’ from the SPSS
• Go to “File,” “Open,” and Click Data
40.
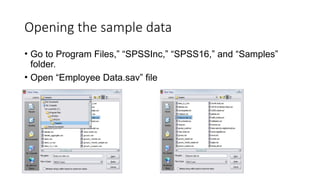
Opening the sampledata
• Go to Program Files,” “SPSSInc,” “SPSS16,” and “Samples”
folder.
• Open “Employee Data.sav” file
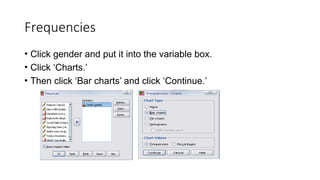
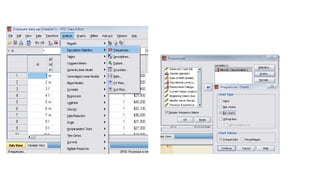
Frequencies
• Click genderand put it into the variable box.
• Click ‘Charts.’
• Then click ‘Bar charts’ and click ‘Continue.’
43.
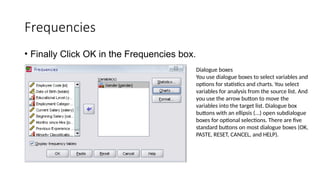
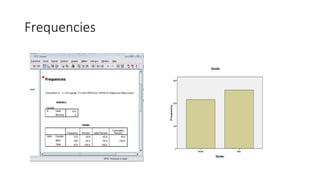
Frequencies
• Finally ClickOK in the Frequencies box.
Dialogue boxes
You use dialogue boxes to select variables and
options for statistics and charts. You select
variables for analysis from the source list. And
you use the arrow button to move the
variables into the target list. Dialogue box
buttons with an ellipsis (...) open subdialogue
boxes for optional selections. There are five
standard buttons on most dialogue boxes (OK,
PASTE, RESET, CANCEL, and HELP).
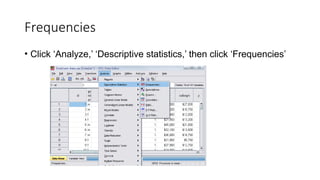
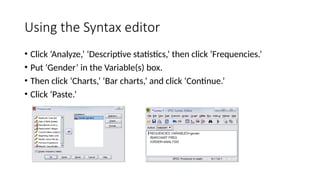
Using the Syntaxeditor
• Click ‘Analyze,’ ‘Descriptive statistics,’ then click ‘Frequencies.’
• Put ‘Gender’ in the Variable(s) box.
• Then click ‘Charts,’ ‘Bar charts,’ and click ‘Continue.’
• Click ‘Paste.’
46.
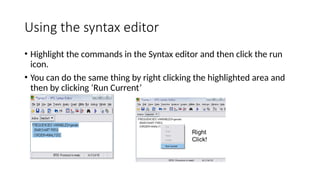
Using the syntaxeditor
• Highlight the commands in the Syntax editor and then click the run
icon.
• You can do the same thing by right clicking the highlighted area and
then by clicking ‘Run Current’
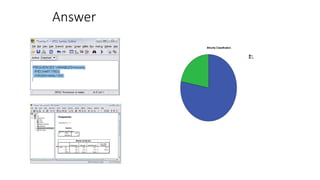
47.
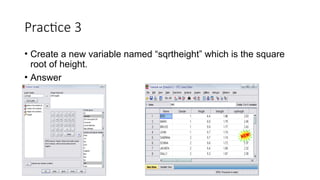
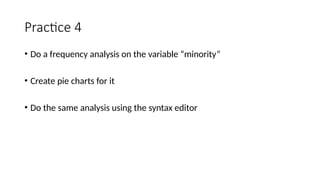
Practice 4
• Doa frequency analysis on the variable “minority”
• Create pie charts for it
• Do the same analysis using the syntax editor
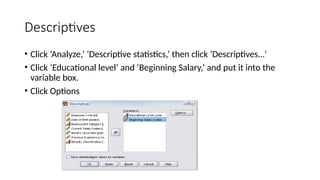
Descriptives
• Click ‘Analyze,’‘Descriptive statistics,’ then click ‘Descriptives…’
• Click ‘Educational level’ and ‘Beginning Salary,’ and put it into the
variable box.
• Click Options
51.
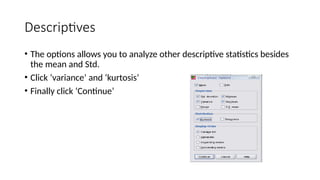
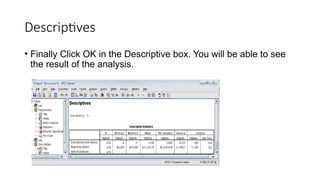
Descriptives
• The optionsallows you to analyze other descriptive statistics besides
the mean and Std.
• Click ‘variance’ and ‘kurtosis’
• Finally click ‘Continue’