Download to read offline

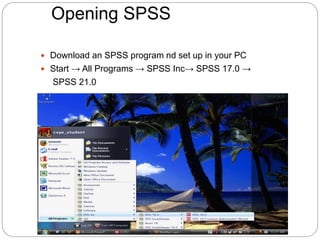
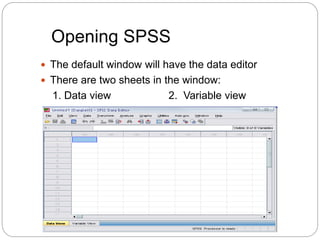
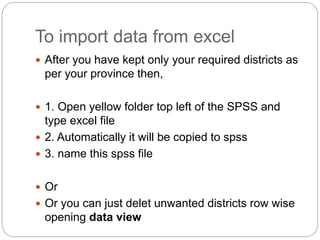
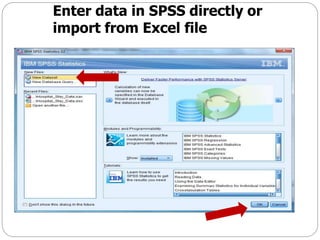
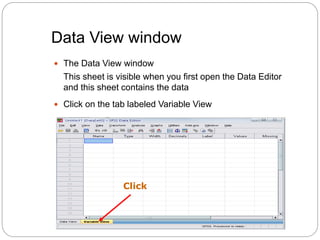
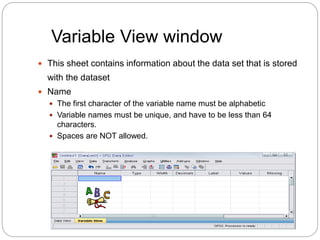
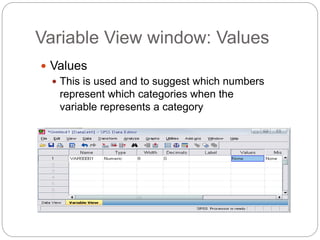
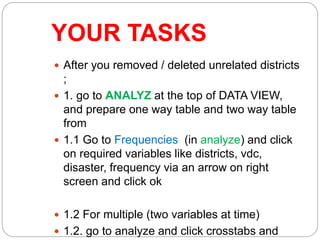
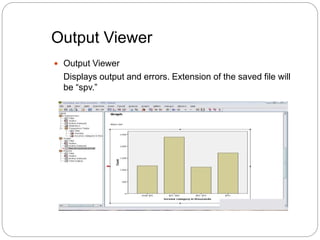
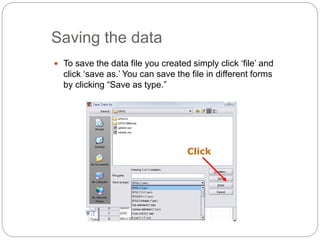
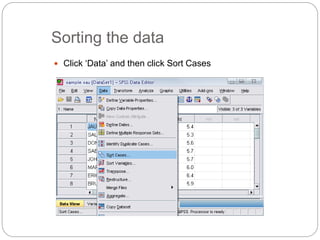
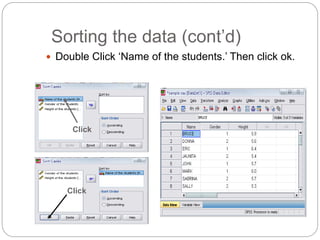
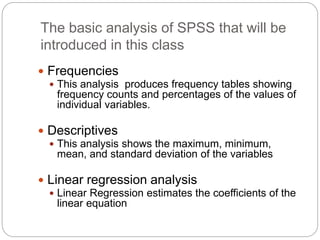
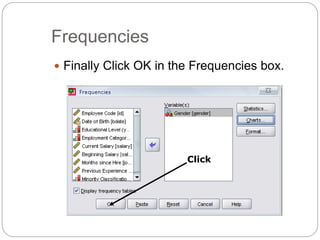
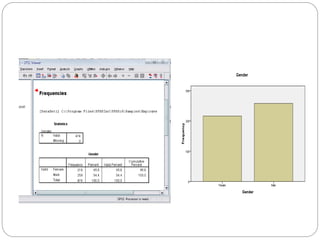
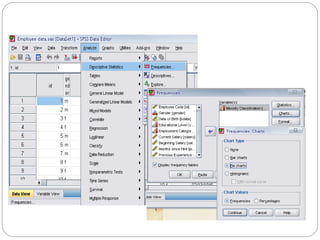

This document provides an introduction and overview of SPSS (Statistical Package for the Social Sciences). It discusses opening SPSS and the main windows, including the Data View and Variable View. It also covers importing data from Excel, entering data directly, sorting data, basic analyses like frequencies and descriptives, and saving data files. The document is intended as an introduction for learning the basics of managing and analyzing data in SPSS.


![SPSS Lecture_1 [Autosaved].pptx](https://cdn.slidesharecdn.com/ss_thumbnails/spsslecture1autosaved-231105165336-b29c7b18-thumbnail.jpg?width=640&height=640&fit=bounds)