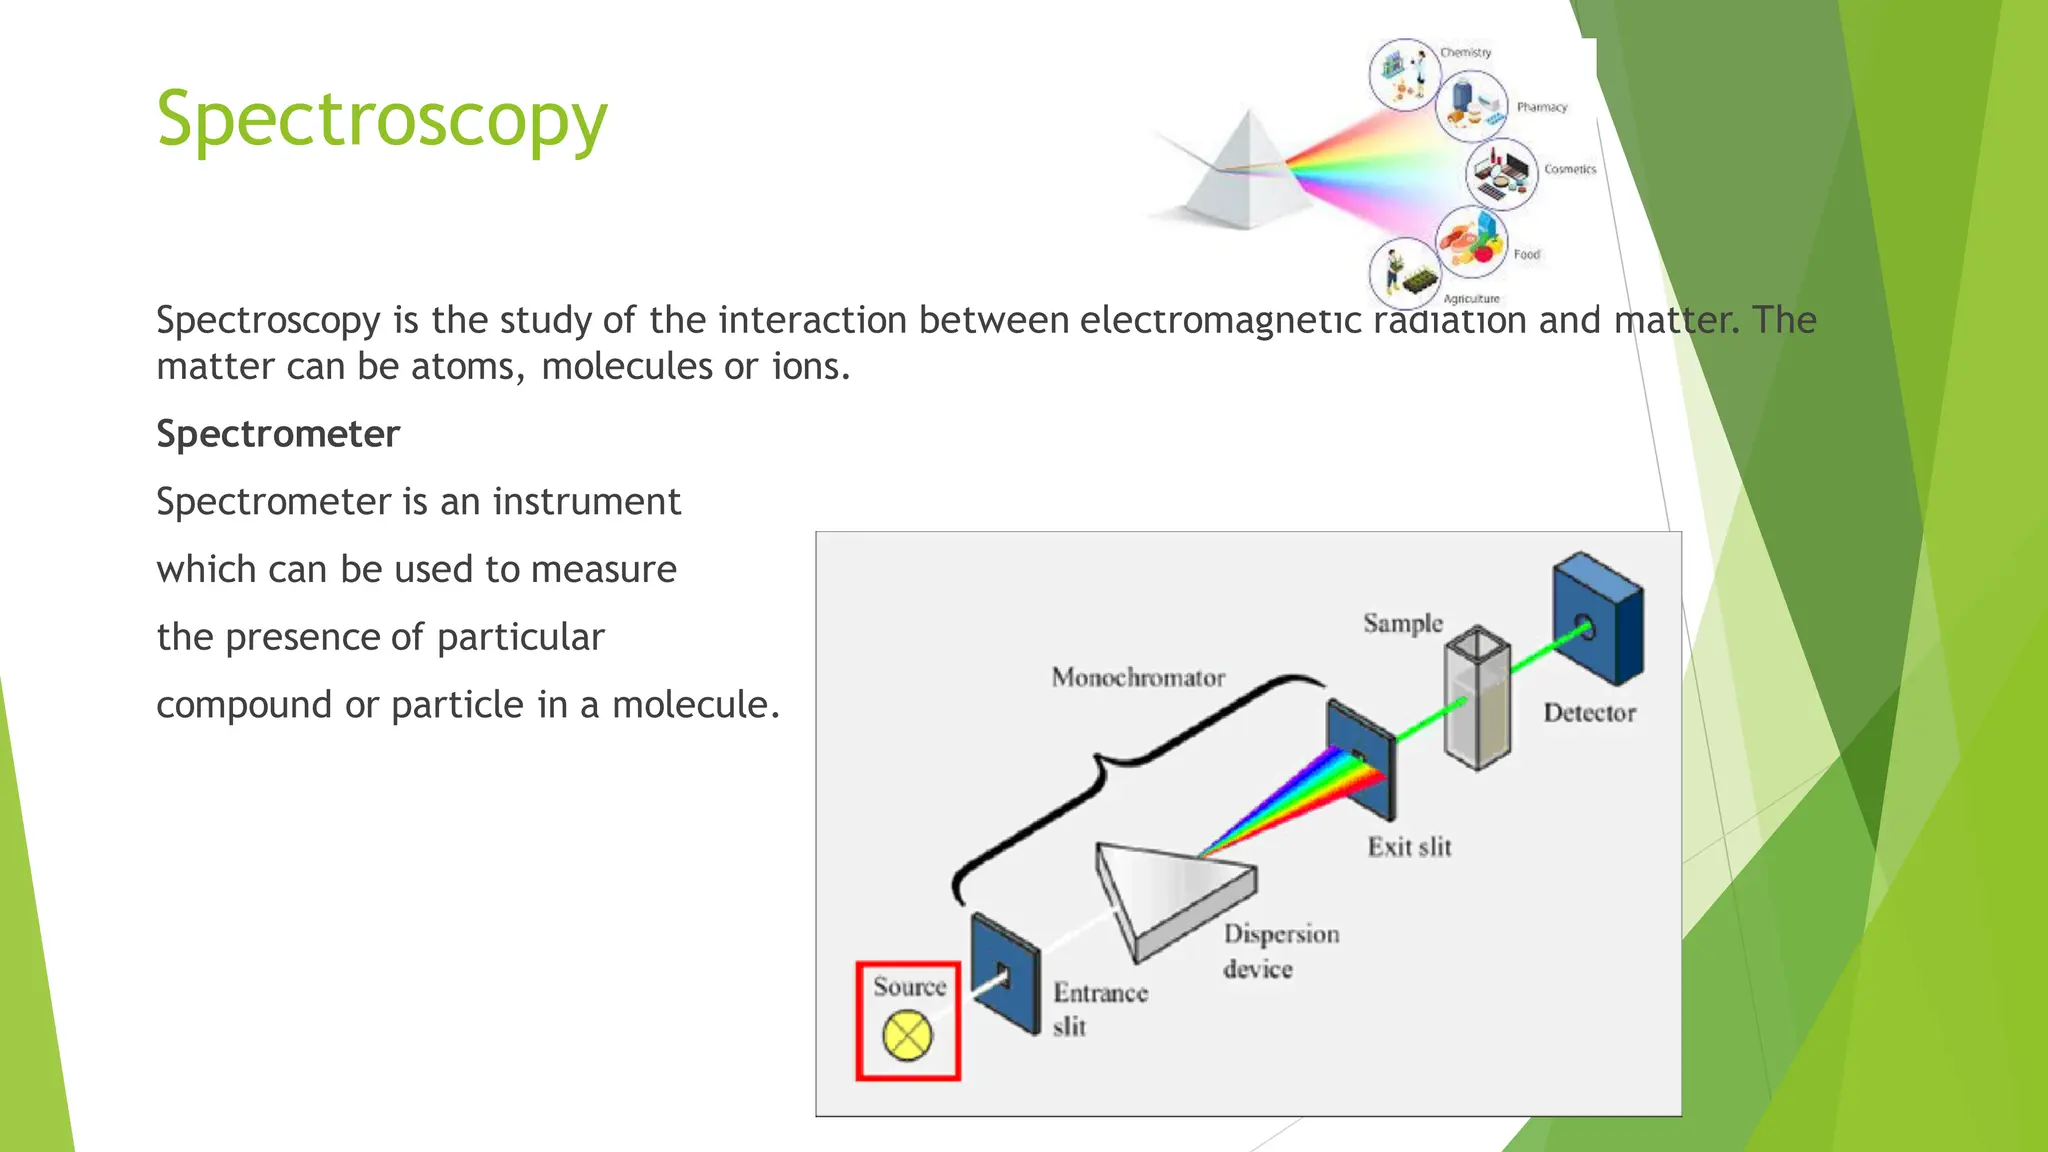
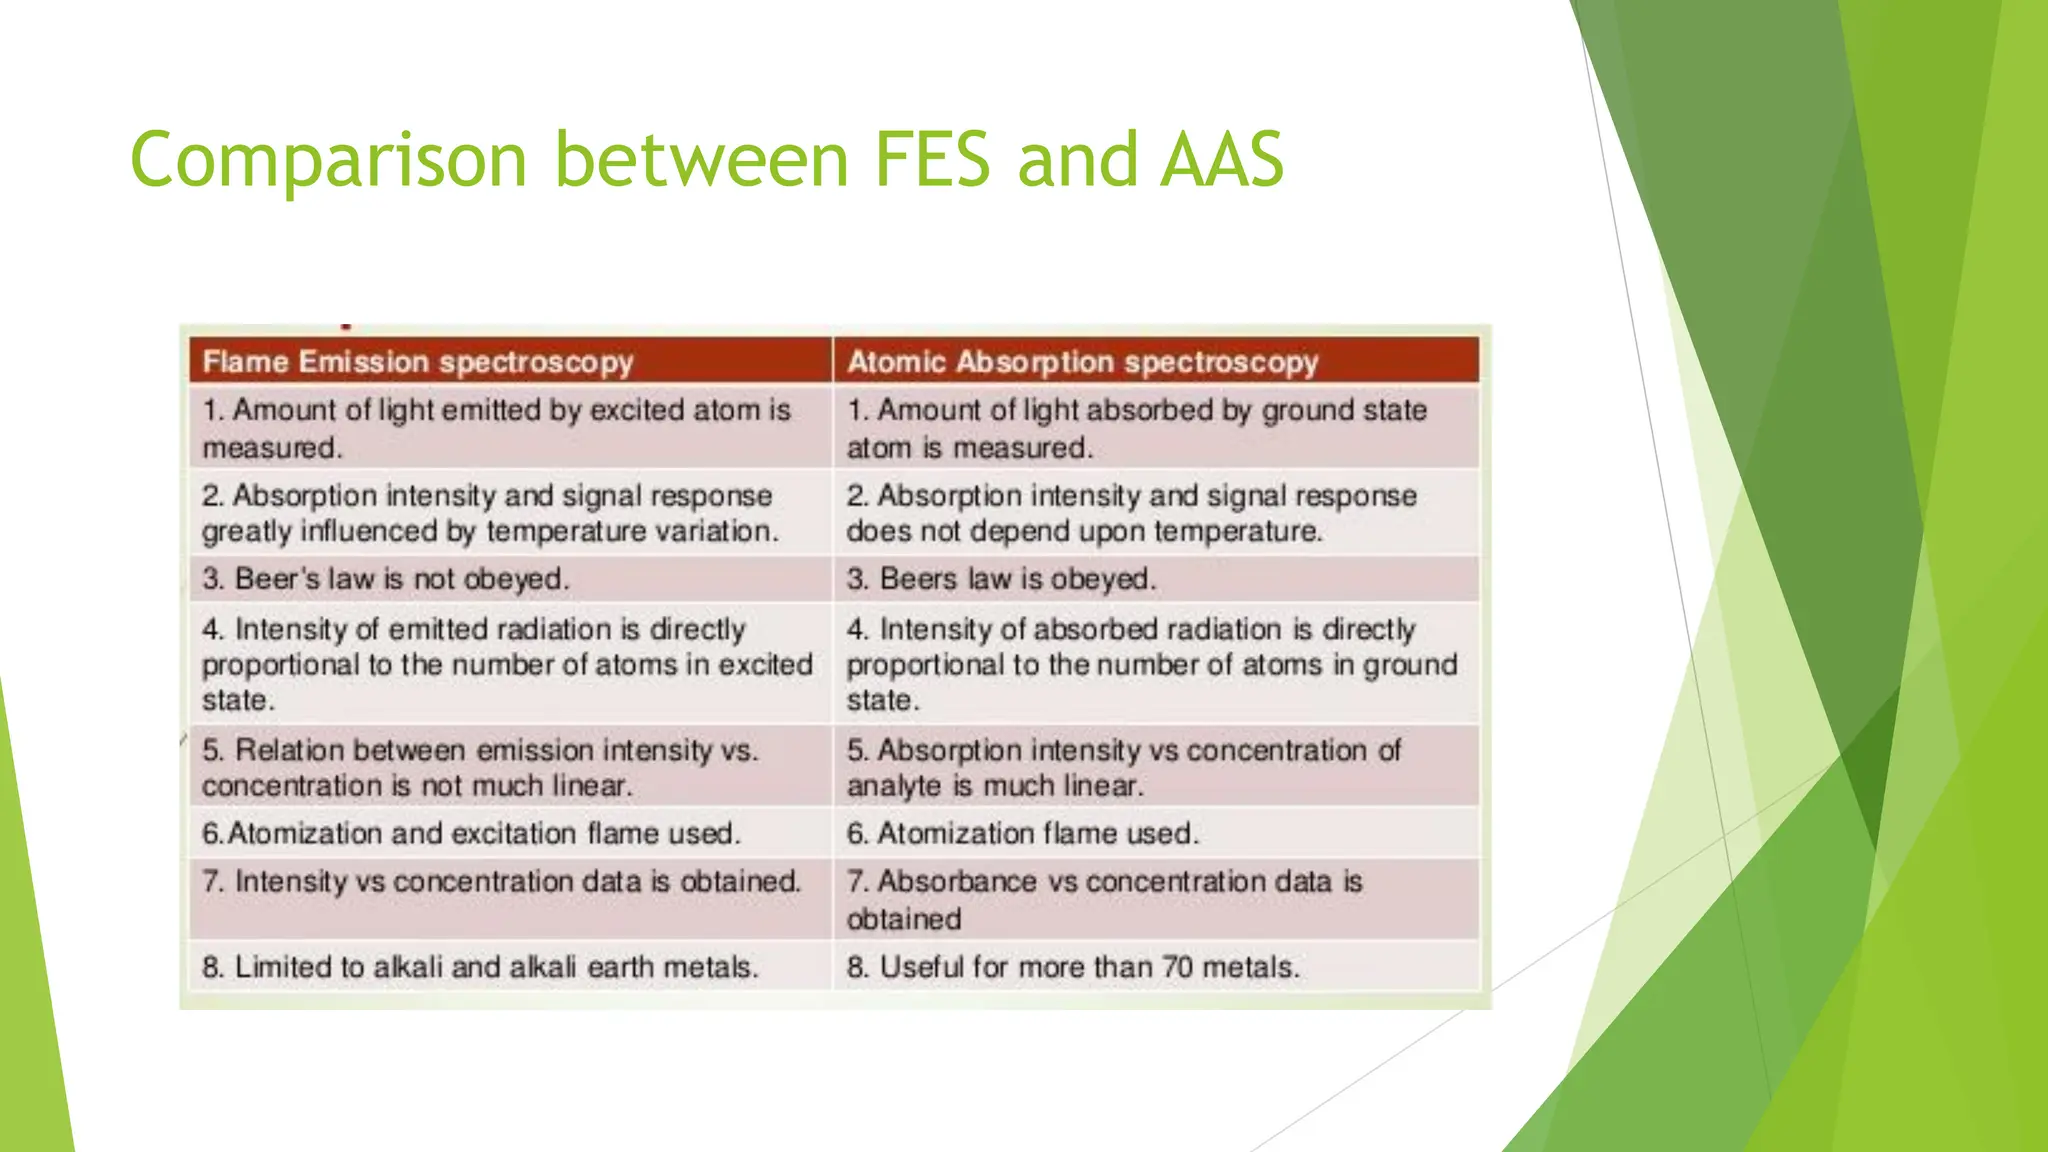
SlideShare a Scribd company logo
1 of 73
Download to read offline
Spectroscopy
Spectroscopy is the study of the interaction between electromagnetic radiation and matter. The
matter can be atoms, molecules or ions.
Spectrometer
Spectrometer is an instrument
which can be used to measure
the presence of particular
compound or particle in a molecule.
Spectrum
Spectrum is a plot of the amount of light absorbed by a sample versus the wavelength of the light
 The amount of light absorbed is called the absorbance.
Frequency: The number of waves passes through a point in each second (measured in Hz).
Wavelength (λ) :- the distance between two successive crest and trough (measured in m).
Amplitude:- is the maximum distance a wave extends beyond its middle position.
Energy α Frequency α Wavenumber α
1
𝑊𝑎𝑣𝑒𝑙𝑒𝑛𝑔ℎ𝑡
Electromagnetic radiation
 EM is a form of energy that is all around us
 EM is a form of energy and has both electrical and magnetic characteristics.
 The study of electromagnetism deals with how electrically charged particles interact
with each other and with magnetic fields.
 Electromagnetic radiation is a form of energy and has both electrical and magnetic
characteristics.
 The electric and magnetic fields in n electromagnetic wave oscillate along directions
perpendicular to the propagation direction of the wave.
Comparison between Electronic,
Vibrational and Rotational transition
Electronic Transition
Electronic transition, the electron is excited first from an initial low
energy state to a higher state by absorbing photon energy from the energy
source. If the wavelength of the incident beam has enough energy to
promote an electron to a higher level, then we can detect this in the
absorbance spectrum. Once in the excited state, the electron has higher
potential energy and will relax back to a lower state by emitting photon
energy. This is called fluorescence and can be detected in the spectrum as
well.
Excitation in molecules
δ = Sigma electrons (more stable and exist at lower energy level)
π = Pi electrons (less stable and exist at higher energy level than δ)
n = Non bonding electron (Lone pairs)
Vibrational Transition
Vibrational transition Infrared radiation falls on molecule from x, y and z
axises. So, the molecule may be excite vibration with the same axises.
 Each chemical bond in compound has a unique vibrational energy. Even a
carbon-carbon bond will be different from one compound to another
depending on what other compounds each carbon is bound to.
 Due to this unique vibrational energy due to vibrational transition, each
compound will have a unique fingerprint, or the output identifying the
peak strengths at specific vibrations. This fingerprint can be used to
determine compound structures, identify and characterize compounds,
and identify impurities. This is done by comparing the fingerprint with the
fingerprints of known compounds.
Vibrational Transition
 There are two types of vibrational spectroscopy: infrared and Raman. The main
difference between these is the types of vibrations and transitions that are
measured. Typically these two forms will be used in connection with each other in
order to get a more complete picture of the compounds.
 Vibration motion of methane
Vibrational Transition
Rotational Transition
 Rotational Molecular Spectra arises from transitions between
rotational energy states and is commonly observed in the microwave
or in far-infrared region of electromagnetic spectrum.
 Only the molecules that have permanent electric dipole moment can
absorb or emit the electromagnetic radiation in such transitions.
Commonly, the rotational spectra arise due to the absorption.
 For heteronuclear diatomic molecules such as HF, HCl , HBr ,CO etc.
The main parameter due to which the rotational spectra arise is the
permanent electric dipole.
Rotational Transition
 In polar molecules Dipole moment is a measure of
 separation of positive and negative charges.
 The Permanent Dipole occurs when two atoms a molecules have different
electronegativity that is one atom attracts electron pair more than another
becoming more negative.
 All the heteronuclear diatomic molecules with the unlike atoms have a
permanent dipole moment. During the motion of the molecule, the component
of dipole moment in a fixed direction changes periodically with the frequency of
rotation of molecule. Hence, the radiation is emitted.
 Even, in the molecules with permanent dipole moment not all the transitions
between rotational states involves radiation.
Basic Principle of spectroscopy
(1) A source of light (or other electromagnetic radiation)
(2) A disperser to separate the light into its component wavelengths
(3) A detector to sense the presence of light after dispersion
(4) Spectra can be obtained either in the form of emission spectra, which show one or more bright
lines or bands on a dark background
(5) Absorption spectra, which have a continuously bright background except for one or more dark
lines
Types of spectroscopy
1) Flame Spectrophotometers
Usually the analyte is in solution form is converted into a free gaseous
form in a multistage process (atomization). This method is used for the
identification of metallic element analytes present at very low
concentration ranges.
2) Atomic Emission Spectroscopy
 This method is excites the atom from the heat of a flame or by
electric arc to emit light. The analysis can be done with a high
resolution polychromator to produce an emission intensity vs.
wavelength spectrum to detect multiple elements simultaneously.
3) Atomic absorption spectroscopy
In this method flame of lower temperature is used so as not to excite the sample
atoms. Instead, the analyte atoms are actually excited using lamps which shine
through the flame at wavelengths adjusted according to the type of analyte
under study. The amount of analyte present in the study sample is determined
based on how much light is absorbed after passing through the flame to excite
the atom.
4)Infrared Spectroscopy (IR)
 IR spectroscopy is used to show what types of bonds are present in a sample by
measuring different types of inter-atomic bond vibrations at different frequencies. It
relies on the fact that molecules absorb specific frequencies which is dependent on
their chemical structure. This is determined by factors such as the masses of the
atoms.
 It has numerous practical applications that include: structure of organic compounds and
pharmaceuticals compounds.
5) Visible/Ultraviolet (UV)
 Ultraviolet / visible spectroscopy analyses compound using the
electromagnetic radiation spectrum from 10 nm to 700 nm. Most of the
molecules are able to emit or absorb visible/ultraviolet light. The absorption
of visible and UV radiation is associated with excitation of δ electrons, n-
electrons and π-electrons from a low energy ground state into a high energy
different mode of motion.
 UV and visible spectroscopy can be used to measure the concentration of
sample, identify the presence of the free electrons and double bonds within a
molecule.
6) Nuclear magnetic resonance
 This is a prominent method for analyzing organic compounds because it exploits the
magnetic properties of certain atomic nuclei to determine its chemical and physical
properties of these atoms that are present in molecule. It can provide extensive
information about the structure and chemical environment of atoms. Additionally,
even different functional groups are distinguishable, and identical functional groups
in differing molecular environments still give distinguishable signals.
Atomic Absorption Spectroscopy
History
The first commercial atomic absorption spectrometer was introduced in 1959.
Use
 Atomic absorption spectroscopy is a quantitative method of analysis that is applicable
to many metals and a few nonmetals.
 It is very reliable and simple to use.
 It can analyze over 62 elements.
 Atomic absorption spectroscopy is a method of elemental analysis. It is particularly
useful for determining trace metals in liquids and is most independent of molecular
form of the metal in sample.
Traceable Elements
Principle
 The technique uses basically the principle that free atoms (gas) generated in
an atomizer can absorb radiation at specific frequency.
 In atomic-absorption spectroscopy the atoms absorb ultraviolet or visible light
and make transitions to higher electronic energy levels.
 The analyte concentration is determined from the amount of absorption.
 Concentration measurements are usually determined from a working curve after
calibrating the instrument with standards known concentration.
 Atomic absorption is a very common technique for metals and metalloids in
environmental samples determined and the intensity of the light absorption is
measured.
BOLTZMANN DISTRUBUTION EQUATION
N*/No = e - ∆E/kT
 N* – number of excited atoms
 No – number of unexcited atoms
 ∆E – difference in energies of two levels
 k – Boltzmann constant
 T – temperature of the flame
AAS
Components of mass spectrometer
Light Source
 Hollow Cathode Lamp are the most common radiation source in AAS.
 It contains a tungsten anode and a hollow cylindrical cathode made of the element to be
determined.
 These are sealed in a glass tube filled with an inert gas (neon or argon ) .
Nebulizer
 Suck up liquid samples at controlled rate.
 Create a fine aerosol spray for introduction into flame.
 Mix the aerosol and fuel and oxidant thoroughly for introduction into flame.
Monochromator
 This is a very important part in an AA spectrometer. It is used to separate out all of the
thousands of lines.
 A monochromator is used to select the specific wavelength of light which is absorbed by the
sample, and to exclude other wavelengths.
 The selection of the specific light allows the determination of the selected element in the
presence of others
Detector
 The light selected by the monochromator is directed onto a detector that is
typically a photomultiplier tube, whose function is to convert the light signal into
an electrical signal proportional to the light intensity.
 The processing of electrical signal is fulfilled by a signal amplifier . The signal
could be displayed for readout , or further fed into a data station for printout by
the further fed into a data station requested format.
Application of AAS
 Determination of even small amounts of different elements like mercury,
calcium, magnesium, in different industries like Pharmaceutical industry,
Food industry.
 It is also use in environmental studies to find the conc of elements in drinking
water, ocean water and soil.
Flame emission spectroscopy
Flame emission spectroscopy / Atomic emission spectroscopy is a
method of chemical analysis that uses the intensity of light emitted
from a flame at a particular wavelength to determine the quantity of an
element in a sample.
The wavelength of the atomic spectral lines gives the identity of an
element
the intensity of the emitted light is proportional to the no. of atoms of
the element”.
Principle
 When a solution of metallic salt sprayed as fine droplets into a flame. The
heat energy (thermal energy) of the flame the solvent in the droplets dry,
leaving a fine residue. This residue convert into neutral atoms.
 This thermal energy also convert atom into exited state.
 Exited state atoms return to ground state with the emission of radiation is in
specific wavelength.
 The wavelength of the radiation emitted is specific for every element and is
used to identify the element (Qualitative Analysis).
 The intensity of emitted radiation depends upon the concentration of the
elements (Quantitative Analysis).
Components of Flame Emission spectroscopy
 Burner
 Nebulizer
 Monochromator
 Amplifier
 Detector
Flame
 The flame used in the flame photometry must possess the following
1. The ability to evaporate the liquid droplets from the sample solution,
resulting in the formation of solid residue.
2. The solid residue resulting in the formation of atoms.
3. Must have the capability to excite the atoms.
4. Cause them to emit radiant energy.
5. These processes is controlled by several factors which are summarised as
follows:
i. Type of fuel and oxidant
ii. Type of solvent
iii. Amount of solvent
iv. Type of burner
Types of Burner
 Mecker Burner
 Total Consumption Burner
 Laminar Flow Burner
 Lundergraph Burner
 Sheilded Burner
 Nitrous Oxide- Acetylene Flame
Total Consumption Burner
 Fuel and oxidant are hydrogen and oxygen.
 Liquid sample is drawn into the flame from the side tubing hydrogen and
oxygen are entering.
 Both are burning at the top of the burner to produce the flame.
 As soon as the liquid sample is drawn into the base of flame, the oxygen
aspirates sample solution leaving a solid residue.
 Atomization and excitation of the sample then follow.
 The name “Total Consumption Burner” is used because all the sample that
enters the capillary tube will enter the flame regardless of droplets size.
 It can be adjusted by proper control of fuel-to-oxidant ratio.
Candle Flame Temperature
Comparison between FES and AAS
UV-Visible Spectrophotometer
Introduction
 Ultraviolet and visible are energetic enough to promote outer electrons to
higher energy levels .
 UV- visible spectroscopy is usually applied to molecules and inorganic ions or
complexes in solution.
 The UV –visible spectra have broad features that are limited use for sample
identification but are very useful for quantities measurements .
 The concentration of an analyte in solution can be determined by measuring
the absorbance at some wavelength and applying the beer-Lambert law.
Principle
 It is the measurement of the wavelength and intensity of absorption of near –
ultraviolet and visible light by a sample to identify the presence of the free
electrons and double bonds within a molecule and find out the purity of sample.
 Beer Lambert’s Law
When a monochromatic light of initial intensity I° passes through a solution in a
transparent vessel some of the light is absorbed so that the intensity of the
transmitted light I is less than I°.
There is some loss of light intensity from scattering by particles in the solution and
reflection at the interfaces ,but mainly from absorption by the solution.
The relationship between I and I° depends on the path length of the absorbing
medium l and the concentration of the absorbing solution. these factors are related
in the laws of lambert and beer.
Where as, A = log
𝐼𝑜
𝐼
So, A = log
𝐼𝑜
𝐼
= 𝞊𝑐𝑙
← l →
Excitation
 Absorption of light in the UV/Visible part of the spectrum (210 – 900 nm)
• The transitions that result in the absorption of electromagnetic radiation in this
region of the spectrum are transitions between electronic energy levels in a
molecules.
• Generally, the most probable transition is from highest occupied molecular
orbital (HOMO) to lowest occupied molecular orbital (LUMO).
Chromophore
 The term chromophore is used to denote a functional group of some other
structural feature of which gives a color to compound.
 For example , nitro group is a chromophore because it is presence in a
compound gives yellow color to the compound .
Auxochrome
A saturated/unsaturated group with non bonding electrons when attached to
chromophore altering both wavelength as well as intensity of absorption.
Example : -OH, -NH2, -NHR, -COOH, -
CN, -Cl
Absorption and intensity Shifts
Bathochromic shift (red shift): a shift to lower energy or longer wavelength.
Hypsochromic shift (blue shift): a shift to higher energy or shorter wavelength.
Hyperchromic effect: An increase in intensity.
Hypochromic effect: A decrease in intensity
Types of transition
1. δ - δ * Transitions
An electron in a bonding s orbital is excited to the corresponding antibonding orbital. The energy
required is large. For example, methane (which has only C-H bonds, and can only undergo ó -ó *
transitions) shows an absorbance maximum at 125 nm. Absorption maxima due to ó - ó * transitions
are not seen in typical UV-Vis. spectra (200 - 700 nm).
2. n - δ * Transitions Saturated compounds containing atoms with lone pairs (non-bonding
electrons) are capable of n -ó * transitions. These transitions usually need less energy than ó - ó *
transitions. They can be initiated by light whose wavelength is in the range 150 - 250 nm. The
number of organic functional groups with n -ò * peaks in the UV region.
Types of transition
3. n -π* and π - π* Transitions.
Most absorption spectroscopy of organic compounds is based on transitions of n or pi electrons to
the pi* excited state. This is because the absorption peaks for these transitions fall in an
experimentally convenient region of the spectrum (200 - 700 nm). These transitions need an
unsaturated group in the molecule to provide the pi electrons.
Flow sheet diagram of UV/Visible
spectrophotometer
1) Source of Light
 Tungsten filament lamps and hydrogen-deuterium lamps are most widely
used and suitable light source as they cover the whole UV region.
 Tungsten filament lamps are rich in red radiations; more specifically they
emit the radiations of greater than 375nm, while the intensity of hydrogen-
deuterium lamps falls below 375nm.
2) Monochromator
Sample and reference cell
 One of the two divided beams is passed through the sample solution and
second beams passed through the reference solution.
 Both sample and reference solution are contained in the cells.
 These cells are made of either silica or quartz.
 Glass can not be used for the cells as it also absorbs light in the UV region.
Detector
 Generally two photocells serve the purpose of detector in UV spectroscopy.
 One of the photocell receives the beam from sample cell and second detector
receives the beam from the reference.
 The intensity of the radiation from the reference cell is stronger than the
beam of sample cell. This results in the generation of pulsing or alternating
currents in the photocells.
Amplifier
The alternating current generated in the photocells is transferred to the
amplifier.
The amplifier is coupled to a small servo meter.
Generally current generated in the photocells is of very low intensity, the main
purpose of amplifier is to amplify the signals many times so we can get clear and
recordable signals.
Recording Device
 Most of the time amplifier is coupled to a pen recorded which is connected to
the computer.
 Computer stores all the data generated and produces the spectrum of the
desired compound
Application Of UV/Visible spectrophotometer
Detection of Impurities
 It is one of the best methods for determination of impurities in organic molecules.
 Addition peaks can be observed due to impurities in the sample and it can be compared with
that of standard raw material.
 By also measuring the absorbed at specific wavelength, the impurities can be detected
Structure elucidation of organic compounds
 it is useful in the structure elucidation of organic molecules, such as in detecting the presence
of hetero atoms.
Structure elucidation of organic compounds
 UV absorption spectroscopy can be used for the quantitative determination of
compounds that absorb UV radiation.
 UV absorption spectroscopy can characterize those types of compounds which
absorbs UV radiation thus used in qualitative determination of compounds .
 Identification is done by comparing the absorbing spectrum with the spectra
of known compounds.
 This technique is used to detect the presence or absence of functional group
in the group. absence of a bond at particular wavelength regarded as an
evidence for absence of particular group.
Structure elucidation of organic compounds
 Kinetics of reaction can also be studied using UV spectroscopy. The UV
radiation is passed through the reaction cell and the absorbance changes can
be observed.
 Many drugs are either in the form of raw material or in the form of
formulation. They can be assayed by making a suitable solution of the drug in
a solvent and measuring the absorbance at specific wavelength.
 Molecular weights of compounds can be measured spectrophotometrically by
preparing the suitable derivatives of these compounds.
 Uv spectrophotometer may be used as a detector for HPLC.
Disadvantage
 Only those molecules are analyzed which have chromophores.
 Only liquid samples are possible to analyzed.
 Result of the absorption can be effective by pH ,temperature and impurities.
 It takes time to get ready to use it.
 Cuvette handling can affect the reading of the sample.
Infrared Spectroscopy
Introduction
 Infrared spectroscopy or vibrational spectroscopy is study of absorption of
Infrared radiations results in vibrational transitions. Infrared spectroscopy is an
important analytical technique for determining structure of both organic and
inorganic compounds.
 Lies in the wavelength range 0.8-1000 μm.
 IR region lies between visible and microwave region.
 Atoms in a molecule do not remain in fixed positions but vibrate about their
mean positions.
 On absorption of IR transition from ground vibrational level to excited
vibrational level give rise to closely packed absorption spectrum.
 IR spectrum is obtained by plotting absorbance v/s wavelength.
Region present in IR
Principle
 When infrared 'light' or radiation hits a molecule, the bonds in the molecule absorb
the energy of the infrared and respond by vibrating.
Types of Vibration
Stretching vibration
1. Stretching vibration Involves a continuous change in the inter atomic distance along
the axis of the bond between two atoms.
2.It requires more energy so appear at shorter wavelength.
3. Stretching vibration Involves a continuous change in the inter atomic distance along
the axis of the bond b/w 2 atoms.
Bending vibrations
1. Bending vibrations are characterized by a change in the
angle b/w two bonds.
2. It requires less energy so appear at longer wavelength.
3. Bending vibrations are characterized by a change in the
angle b/w two bonds
Theory of Infrared Spectroscopy
In a molecule after absorption of IR, the vibrations or rotations within a
molecule must cause a net change in the dipole moment of the molecule.
The alternating electrical field of the radiation (remember that
electromagnetic radiation consists of an oscillating electrical field and an
oscillating magnetic field, perpendicular to each other) interacts with
fluctuations in the dipole moment of the molecule.
Theory of Infrared Spectroscopy
 If the frequency of the radiation matches the vibrational frequency of the
molecule then radiation will be absorbed, causing a change in the amplitude
of molecular vibration.
Absorption of radiation
The frequency is affected by
1. The masses of the atoms in the bond
2. The strength of the bond
The lower the mass, the higher the vibrational frequency.
Stretching frequencies for bonds to carbon: C-H > C-C > C-N > C-O
The stronger the bond, the higher the vibrational frequency
Stretching frequencies
• C≡C > C=C > C-C
• C≡N > C=N > C-N
• C≡O > C=O > C-O
• spC-H > sp2C-H > sp3C-H
Region in Infrared Spectroscopy
Functional Group Region
Absorption Value of different Functional
Group
Infrared Spectrum of Ethanol
Infrared Spectrum of Acetic Acid
Infrared Spectrum of Acetone

More Related Content

Similar to Spectroscopy 1.pdf, atomic absorption spectroscopy

12 02-09-12-24-23-1390-sampathkumar
12 02-09-12-24-23-1390-sampathkumar12 02-09-12-24-23-1390-sampathkumar
12 02-09-12-24-23-1390-sampathkumarDONIKAMARKANDE
 
Gas Chromatograph-Mass Spectrometer.pptx
Gas Chromatograph-Mass Spectrometer.pptxGas Chromatograph-Mass Spectrometer.pptx
Gas Chromatograph-Mass Spectrometer.pptxBhanu Yadav
 
Microwave and infrared spectroscopy of polyatomic molecules
Microwave and infrared spectroscopy of polyatomic moleculesMicrowave and infrared spectroscopy of polyatomic molecules
Microwave and infrared spectroscopy of polyatomic moleculesAreebaWarraich1
 
Ms infrared spectroscopy
Ms infrared  spectroscopyMs infrared  spectroscopy
Ms infrared spectroscopyMISHUSINGH1
 
B.tech. ii engineering chemistry unit-5 B spectroscopic techniques
B.tech. ii engineering chemistry unit-5 B spectroscopic techniquesB.tech. ii engineering chemistry unit-5 B spectroscopic techniques
B.tech. ii engineering chemistry unit-5 B spectroscopic techniquesRai University
 
Uv/visible spectroscopy
Uv/visible spectroscopyUv/visible spectroscopy
Uv/visible spectroscopySavitaBhatt2
 
Basics of spectroscopy
Basics of spectroscopyBasics of spectroscopy
Basics of spectroscopyJenson Samraj
 
sepectroscopy.intro.pptx
sepectroscopy.intro.pptxsepectroscopy.intro.pptx
sepectroscopy.intro.pptxJaved Iqbal
 
introduction to spectroscopy
 introduction to spectroscopy introduction to spectroscopy
introduction to spectroscopyMicrobiology
 
Structure of atom- discovery of proton, electron & neutron
Structure of atom- discovery of proton, electron & neutronStructure of atom- discovery of proton, electron & neutron
Structure of atom- discovery of proton, electron & neutronBathla Tuition Centre
 
Chem 1 unit 4 presentation
Chem 1 unit 4 presentationChem 1 unit 4 presentation
Chem 1 unit 4 presentationbobcatchemistry
 
UV-Visible Spectroscopy
UV-Visible SpectroscopyUV-Visible Spectroscopy
UV-Visible SpectroscopySudha Reddy
 
Molecular spectroscopy 1
Molecular spectroscopy 1Molecular spectroscopy 1
Molecular spectroscopy 1Dewal Deshmukh
 
atomic absorption spectroscopy and mass spectroscopy
atomic absorption spectroscopy and mass spectroscopyatomic absorption spectroscopy and mass spectroscopy
atomic absorption spectroscopy and mass spectroscopyvanitha gopal
 
Uv visible spectroscopy with Instrumentation
Uv visible spectroscopy with InstrumentationUv visible spectroscopy with Instrumentation
Uv visible spectroscopy with InstrumentationSHIVANEE VYAS
 

Similar to Spectroscopy 1.pdf, atomic absorption spectroscopy (20)

Mass Spectrometry
Mass SpectrometryMass Spectrometry
Mass Spectrometry
 
Spectroscpoic techniques
Spectroscpoic techniquesSpectroscpoic techniques
Spectroscpoic techniques
 
12 02-09-12-24-23-1390-sampathkumar
12 02-09-12-24-23-1390-sampathkumar12 02-09-12-24-23-1390-sampathkumar
12 02-09-12-24-23-1390-sampathkumar
 
Gas Chromatograph-Mass Spectrometer.pptx
Gas Chromatograph-Mass Spectrometer.pptxGas Chromatograph-Mass Spectrometer.pptx
Gas Chromatograph-Mass Spectrometer.pptx
 
Microwave and infrared spectroscopy of polyatomic molecules
Microwave and infrared spectroscopy of polyatomic moleculesMicrowave and infrared spectroscopy of polyatomic molecules
Microwave and infrared spectroscopy of polyatomic molecules
 
Ms infrared spectroscopy
Ms infrared  spectroscopyMs infrared  spectroscopy
Ms infrared spectroscopy
 
B.tech. ii engineering chemistry unit-5 B spectroscopic techniques
B.tech. ii engineering chemistry unit-5 B spectroscopic techniquesB.tech. ii engineering chemistry unit-5 B spectroscopic techniques
B.tech. ii engineering chemistry unit-5 B spectroscopic techniques
 
Uv/visible spectroscopy
Uv/visible spectroscopyUv/visible spectroscopy
Uv/visible spectroscopy
 
Uv
UvUv
Uv
 
Basics of spectroscopy
Basics of spectroscopyBasics of spectroscopy
Basics of spectroscopy
 
sepectroscopy.intro.pptx
sepectroscopy.intro.pptxsepectroscopy.intro.pptx
sepectroscopy.intro.pptx
 
introduction to spectroscopy
 introduction to spectroscopy introduction to spectroscopy
introduction to spectroscopy
 
Structure of atom- discovery of proton, electron & neutron
Structure of atom- discovery of proton, electron & neutronStructure of atom- discovery of proton, electron & neutron
Structure of atom- discovery of proton, electron & neutron
 
Chem 1 unit 4 presentation
Chem 1 unit 4 presentationChem 1 unit 4 presentation
Chem 1 unit 4 presentation
 
UV-Visible Spectroscopy
UV-Visible SpectroscopyUV-Visible Spectroscopy
UV-Visible Spectroscopy
 
Molecular spectroscopy 1
Molecular spectroscopy 1Molecular spectroscopy 1
Molecular spectroscopy 1
 
atomic absorption spectroscopy and mass spectroscopy
atomic absorption spectroscopy and mass spectroscopyatomic absorption spectroscopy and mass spectroscopy
atomic absorption spectroscopy and mass spectroscopy
 
U V Visible Spectroscopy
U V Visible SpectroscopyU V Visible Spectroscopy
U V Visible Spectroscopy
 
Uv visiblr spectroscopy
Uv visiblr spectroscopyUv visiblr spectroscopy
Uv visiblr spectroscopy
 
Uv visible spectroscopy with Instrumentation
Uv visible spectroscopy with InstrumentationUv visible spectroscopy with Instrumentation
Uv visible spectroscopy with Instrumentation
 

Recently uploaded

Accessible Digital Futures project (20/03/2024)
Accessible Digital Futures project (20/03/2024)Accessible Digital Futures project (20/03/2024)
Accessible Digital Futures project (20/03/2024)Jisc
 
FSB Advising Checklist - Orientation 2024
FSB Advising Checklist - Orientation 2024FSB Advising Checklist - Orientation 2024
FSB Advising Checklist - Orientation 2024Elizabeth Walsh
 
Interdisciplinary_Insights_Data_Collection_Methods.pptx
Interdisciplinary_Insights_Data_Collection_Methods.pptxInterdisciplinary_Insights_Data_Collection_Methods.pptx
Interdisciplinary_Insights_Data_Collection_Methods.pptxPooja Bhuva
 
dusjagr & nano talk on open tools for agriculture research and learning
dusjagr & nano talk on open tools for agriculture research and learningdusjagr & nano talk on open tools for agriculture research and learning
dusjagr & nano talk on open tools for agriculture research and learningMarc Dusseiller Dusjagr
 
NO1 Top Black Magic Specialist In Lahore Black magic In Pakistan Kala Ilam Ex...
NO1 Top Black Magic Specialist In Lahore Black magic In Pakistan Kala Ilam Ex...NO1 Top Black Magic Specialist In Lahore Black magic In Pakistan Kala Ilam Ex...
NO1 Top Black Magic Specialist In Lahore Black magic In Pakistan Kala Ilam Ex...Amil baba
 
Jamworks pilot and AI at Jisc (20/03/2024)
Jamworks pilot and AI at Jisc (20/03/2024)Jamworks pilot and AI at Jisc (20/03/2024)
Jamworks pilot and AI at Jisc (20/03/2024)Jisc
 
OSCM Unit 2_Operations Processes & Systems
OSCM Unit 2_Operations Processes & SystemsOSCM Unit 2_Operations Processes & Systems
OSCM Unit 2_Operations Processes & SystemsSandeep D Chaudhary
 
REMIFENTANIL: An Ultra short acting opioid.pptx
REMIFENTANIL: An Ultra short acting opioid.pptxREMIFENTANIL: An Ultra short acting opioid.pptx
REMIFENTANIL: An Ultra short acting opioid.pptxDr. Ravikiran H M Gowda
 
Basic Intentional Injuries Health Education
Basic Intentional Injuries Health EducationBasic Intentional Injuries Health Education
Basic Intentional Injuries Health EducationNeilDeclaro1
 
Towards a code of practice for AI in AT.pptx
Towards a code of practice for AI in AT.pptxTowards a code of practice for AI in AT.pptx
Towards a code of practice for AI in AT.pptxJisc
 
Graduate Outcomes Presentation Slides - English
Graduate Outcomes Presentation Slides - EnglishGraduate Outcomes Presentation Slides - English
Graduate Outcomes Presentation Slides - Englishneillewis46
 
General Principles of Intellectual Property: Concepts of Intellectual Proper...
General Principles of Intellectual Property: Concepts of Intellectual  Proper...General Principles of Intellectual Property: Concepts of Intellectual  Proper...
General Principles of Intellectual Property: Concepts of Intellectual Proper...Poonam Aher Patil
 
On National Teacher Day, meet the 2024-25 Kenan Fellows
On National Teacher Day, meet the 2024-25 Kenan FellowsOn National Teacher Day, meet the 2024-25 Kenan Fellows
On National Teacher Day, meet the 2024-25 Kenan FellowsMebane Rash
 
How to Create and Manage Wizard in Odoo 17
How to Create and Manage Wizard in Odoo 17How to Create and Manage Wizard in Odoo 17
How to Create and Manage Wizard in Odoo 17Celine George
 
FICTIONAL SALESMAN/SALESMAN SNSW 2024.pdf
FICTIONAL SALESMAN/SALESMAN SNSW 2024.pdfFICTIONAL SALESMAN/SALESMAN SNSW 2024.pdf
FICTIONAL SALESMAN/SALESMAN SNSW 2024.pdfPondicherry University
 
Google Gemini An AI Revolution in Education.pptx
Google Gemini An AI Revolution in Education.pptxGoogle Gemini An AI Revolution in Education.pptx
Google Gemini An AI Revolution in Education.pptxDr. Sarita Anand
 
How to setup Pycharm environment for Odoo 17.pptx
How to setup Pycharm environment for Odoo 17.pptxHow to setup Pycharm environment for Odoo 17.pptx
How to setup Pycharm environment for Odoo 17.pptxCeline George
 
Sensory_Experience_and_Emotional_Resonance_in_Gabriel_Okaras_The_Piano_and_Th...
Sensory_Experience_and_Emotional_Resonance_in_Gabriel_Okaras_The_Piano_and_Th...Sensory_Experience_and_Emotional_Resonance_in_Gabriel_Okaras_The_Piano_and_Th...
Sensory_Experience_and_Emotional_Resonance_in_Gabriel_Okaras_The_Piano_and_Th...Pooja Bhuva
 
Beyond_Borders_Understanding_Anime_and_Manga_Fandom_A_Comprehensive_Audience_...
Beyond_Borders_Understanding_Anime_and_Manga_Fandom_A_Comprehensive_Audience_...Beyond_Borders_Understanding_Anime_and_Manga_Fandom_A_Comprehensive_Audience_...
Beyond_Borders_Understanding_Anime_and_Manga_Fandom_A_Comprehensive_Audience_...Pooja Bhuva
 
Philosophy of china and it's charactistics
Philosophy of china and it's charactisticsPhilosophy of china and it's charactistics
Philosophy of china and it's charactisticshameyhk98
 

Recently uploaded (20)

Accessible Digital Futures project (20/03/2024)
Accessible Digital Futures project (20/03/2024)Accessible Digital Futures project (20/03/2024)
Accessible Digital Futures project (20/03/2024)
 
FSB Advising Checklist - Orientation 2024
FSB Advising Checklist - Orientation 2024FSB Advising Checklist - Orientation 2024
FSB Advising Checklist - Orientation 2024
 
Interdisciplinary_Insights_Data_Collection_Methods.pptx
Interdisciplinary_Insights_Data_Collection_Methods.pptxInterdisciplinary_Insights_Data_Collection_Methods.pptx
Interdisciplinary_Insights_Data_Collection_Methods.pptx
 
dusjagr & nano talk on open tools for agriculture research and learning
dusjagr & nano talk on open tools for agriculture research and learningdusjagr & nano talk on open tools for agriculture research and learning
dusjagr & nano talk on open tools for agriculture research and learning
 
NO1 Top Black Magic Specialist In Lahore Black magic In Pakistan Kala Ilam Ex...
NO1 Top Black Magic Specialist In Lahore Black magic In Pakistan Kala Ilam Ex...NO1 Top Black Magic Specialist In Lahore Black magic In Pakistan Kala Ilam Ex...
NO1 Top Black Magic Specialist In Lahore Black magic In Pakistan Kala Ilam Ex...
 
Jamworks pilot and AI at Jisc (20/03/2024)
Jamworks pilot and AI at Jisc (20/03/2024)Jamworks pilot and AI at Jisc (20/03/2024)
Jamworks pilot and AI at Jisc (20/03/2024)
 
OSCM Unit 2_Operations Processes & Systems
OSCM Unit 2_Operations Processes & SystemsOSCM Unit 2_Operations Processes & Systems
OSCM Unit 2_Operations Processes & Systems
 
REMIFENTANIL: An Ultra short acting opioid.pptx
REMIFENTANIL: An Ultra short acting opioid.pptxREMIFENTANIL: An Ultra short acting opioid.pptx
REMIFENTANIL: An Ultra short acting opioid.pptx
 
Basic Intentional Injuries Health Education
Basic Intentional Injuries Health EducationBasic Intentional Injuries Health Education
Basic Intentional Injuries Health Education
 
Towards a code of practice for AI in AT.pptx
Towards a code of practice for AI in AT.pptxTowards a code of practice for AI in AT.pptx
Towards a code of practice for AI in AT.pptx
 
Graduate Outcomes Presentation Slides - English
Graduate Outcomes Presentation Slides - EnglishGraduate Outcomes Presentation Slides - English
Graduate Outcomes Presentation Slides - English
 
General Principles of Intellectual Property: Concepts of Intellectual Proper...
General Principles of Intellectual Property: Concepts of Intellectual  Proper...General Principles of Intellectual Property: Concepts of Intellectual  Proper...
General Principles of Intellectual Property: Concepts of Intellectual Proper...
 
On National Teacher Day, meet the 2024-25 Kenan Fellows
On National Teacher Day, meet the 2024-25 Kenan FellowsOn National Teacher Day, meet the 2024-25 Kenan Fellows
On National Teacher Day, meet the 2024-25 Kenan Fellows
 
How to Create and Manage Wizard in Odoo 17
How to Create and Manage Wizard in Odoo 17How to Create and Manage Wizard in Odoo 17
How to Create and Manage Wizard in Odoo 17
 
FICTIONAL SALESMAN/SALESMAN SNSW 2024.pdf
FICTIONAL SALESMAN/SALESMAN SNSW 2024.pdfFICTIONAL SALESMAN/SALESMAN SNSW 2024.pdf
FICTIONAL SALESMAN/SALESMAN SNSW 2024.pdf
 
Google Gemini An AI Revolution in Education.pptx
Google Gemini An AI Revolution in Education.pptxGoogle Gemini An AI Revolution in Education.pptx
Google Gemini An AI Revolution in Education.pptx
 
How to setup Pycharm environment for Odoo 17.pptx
How to setup Pycharm environment for Odoo 17.pptxHow to setup Pycharm environment for Odoo 17.pptx
How to setup Pycharm environment for Odoo 17.pptx
 
Sensory_Experience_and_Emotional_Resonance_in_Gabriel_Okaras_The_Piano_and_Th...
Sensory_Experience_and_Emotional_Resonance_in_Gabriel_Okaras_The_Piano_and_Th...Sensory_Experience_and_Emotional_Resonance_in_Gabriel_Okaras_The_Piano_and_Th...
Sensory_Experience_and_Emotional_Resonance_in_Gabriel_Okaras_The_Piano_and_Th...
 
Beyond_Borders_Understanding_Anime_and_Manga_Fandom_A_Comprehensive_Audience_...
Beyond_Borders_Understanding_Anime_and_Manga_Fandom_A_Comprehensive_Audience_...Beyond_Borders_Understanding_Anime_and_Manga_Fandom_A_Comprehensive_Audience_...
Beyond_Borders_Understanding_Anime_and_Manga_Fandom_A_Comprehensive_Audience_...
 
Philosophy of china and it's charactistics
Philosophy of china and it's charactisticsPhilosophy of china and it's charactistics
Philosophy of china and it's charactistics
 

Spectroscopy 1.pdf, atomic absorption spectroscopy

  • 1. Spectroscopy Spectroscopy is the study of the interaction between electromagnetic radiation and matter. The matter can be atoms, molecules or ions. Spectrometer Spectrometer is an instrument which can be used to measure the presence of particular compound or particle in a molecule.
  • 2. Spectrum Spectrum is a plot of the amount of light absorbed by a sample versus the wavelength of the light  The amount of light absorbed is called the absorbance. Frequency: The number of waves passes through a point in each second (measured in Hz). Wavelength (λ) :- the distance between two successive crest and trough (measured in m). Amplitude:- is the maximum distance a wave extends beyond its middle position. Energy α Frequency α Wavenumber α 1 𝑊𝑎𝑣𝑒𝑙𝑒𝑛𝑔ℎ𝑡
  • 3. Electromagnetic radiation  EM is a form of energy that is all around us  EM is a form of energy and has both electrical and magnetic characteristics.  The study of electromagnetism deals with how electrically charged particles interact with each other and with magnetic fields.  Electromagnetic radiation is a form of energy and has both electrical and magnetic characteristics.  The electric and magnetic fields in n electromagnetic wave oscillate along directions perpendicular to the propagation direction of the wave.
  • 4. Comparison between Electronic, Vibrational and Rotational transition
  • 5.
  • 6. Electronic Transition Electronic transition, the electron is excited first from an initial low energy state to a higher state by absorbing photon energy from the energy source. If the wavelength of the incident beam has enough energy to promote an electron to a higher level, then we can detect this in the absorbance spectrum. Once in the excited state, the electron has higher potential energy and will relax back to a lower state by emitting photon energy. This is called fluorescence and can be detected in the spectrum as well.
  • 7. Excitation in molecules δ = Sigma electrons (more stable and exist at lower energy level) π = Pi electrons (less stable and exist at higher energy level than δ) n = Non bonding electron (Lone pairs)
  • 8. Vibrational Transition Vibrational transition Infrared radiation falls on molecule from x, y and z axises. So, the molecule may be excite vibration with the same axises.  Each chemical bond in compound has a unique vibrational energy. Even a carbon-carbon bond will be different from one compound to another depending on what other compounds each carbon is bound to.  Due to this unique vibrational energy due to vibrational transition, each compound will have a unique fingerprint, or the output identifying the peak strengths at specific vibrations. This fingerprint can be used to determine compound structures, identify and characterize compounds, and identify impurities. This is done by comparing the fingerprint with the fingerprints of known compounds.
  • 9. Vibrational Transition  There are two types of vibrational spectroscopy: infrared and Raman. The main difference between these is the types of vibrations and transitions that are measured. Typically these two forms will be used in connection with each other in order to get a more complete picture of the compounds.  Vibration motion of methane
  • 11. Rotational Transition  Rotational Molecular Spectra arises from transitions between rotational energy states and is commonly observed in the microwave or in far-infrared region of electromagnetic spectrum.  Only the molecules that have permanent electric dipole moment can absorb or emit the electromagnetic radiation in such transitions. Commonly, the rotational spectra arise due to the absorption.  For heteronuclear diatomic molecules such as HF, HCl , HBr ,CO etc. The main parameter due to which the rotational spectra arise is the permanent electric dipole.
  • 12. Rotational Transition  In polar molecules Dipole moment is a measure of  separation of positive and negative charges.  The Permanent Dipole occurs when two atoms a molecules have different electronegativity that is one atom attracts electron pair more than another becoming more negative.  All the heteronuclear diatomic molecules with the unlike atoms have a permanent dipole moment. During the motion of the molecule, the component of dipole moment in a fixed direction changes periodically with the frequency of rotation of molecule. Hence, the radiation is emitted.  Even, in the molecules with permanent dipole moment not all the transitions between rotational states involves radiation.
  • 13. Basic Principle of spectroscopy (1) A source of light (or other electromagnetic radiation) (2) A disperser to separate the light into its component wavelengths (3) A detector to sense the presence of light after dispersion (4) Spectra can be obtained either in the form of emission spectra, which show one or more bright lines or bands on a dark background (5) Absorption spectra, which have a continuously bright background except for one or more dark lines
  • 15. 1) Flame Spectrophotometers Usually the analyte is in solution form is converted into a free gaseous form in a multistage process (atomization). This method is used for the identification of metallic element analytes present at very low concentration ranges.
  • 16. 2) Atomic Emission Spectroscopy  This method is excites the atom from the heat of a flame or by electric arc to emit light. The analysis can be done with a high resolution polychromator to produce an emission intensity vs. wavelength spectrum to detect multiple elements simultaneously.
  • 17. 3) Atomic absorption spectroscopy In this method flame of lower temperature is used so as not to excite the sample atoms. Instead, the analyte atoms are actually excited using lamps which shine through the flame at wavelengths adjusted according to the type of analyte under study. The amount of analyte present in the study sample is determined based on how much light is absorbed after passing through the flame to excite the atom.
  • 18. 4)Infrared Spectroscopy (IR)  IR spectroscopy is used to show what types of bonds are present in a sample by measuring different types of inter-atomic bond vibrations at different frequencies. It relies on the fact that molecules absorb specific frequencies which is dependent on their chemical structure. This is determined by factors such as the masses of the atoms.  It has numerous practical applications that include: structure of organic compounds and pharmaceuticals compounds.
  • 19. 5) Visible/Ultraviolet (UV)  Ultraviolet / visible spectroscopy analyses compound using the electromagnetic radiation spectrum from 10 nm to 700 nm. Most of the molecules are able to emit or absorb visible/ultraviolet light. The absorption of visible and UV radiation is associated with excitation of δ electrons, n- electrons and π-electrons from a low energy ground state into a high energy different mode of motion.  UV and visible spectroscopy can be used to measure the concentration of sample, identify the presence of the free electrons and double bonds within a molecule.
  • 20. 6) Nuclear magnetic resonance  This is a prominent method for analyzing organic compounds because it exploits the magnetic properties of certain atomic nuclei to determine its chemical and physical properties of these atoms that are present in molecule. It can provide extensive information about the structure and chemical environment of atoms. Additionally, even different functional groups are distinguishable, and identical functional groups in differing molecular environments still give distinguishable signals.
  • 22. History The first commercial atomic absorption spectrometer was introduced in 1959. Use  Atomic absorption spectroscopy is a quantitative method of analysis that is applicable to many metals and a few nonmetals.  It is very reliable and simple to use.  It can analyze over 62 elements.  Atomic absorption spectroscopy is a method of elemental analysis. It is particularly useful for determining trace metals in liquids and is most independent of molecular form of the metal in sample.
  • 24. Principle  The technique uses basically the principle that free atoms (gas) generated in an atomizer can absorb radiation at specific frequency.  In atomic-absorption spectroscopy the atoms absorb ultraviolet or visible light and make transitions to higher electronic energy levels.  The analyte concentration is determined from the amount of absorption.  Concentration measurements are usually determined from a working curve after calibrating the instrument with standards known concentration.  Atomic absorption is a very common technique for metals and metalloids in environmental samples determined and the intensity of the light absorption is measured.
  • 25. BOLTZMANN DISTRUBUTION EQUATION N*/No = e - ∆E/kT  N* – number of excited atoms  No – number of unexcited atoms  ∆E – difference in energies of two levels  k – Boltzmann constant  T – temperature of the flame
  • 26. AAS
  • 27. Components of mass spectrometer Light Source  Hollow Cathode Lamp are the most common radiation source in AAS.  It contains a tungsten anode and a hollow cylindrical cathode made of the element to be determined.  These are sealed in a glass tube filled with an inert gas (neon or argon ) .
  • 28. Nebulizer  Suck up liquid samples at controlled rate.  Create a fine aerosol spray for introduction into flame.  Mix the aerosol and fuel and oxidant thoroughly for introduction into flame.
  • 29. Monochromator  This is a very important part in an AA spectrometer. It is used to separate out all of the thousands of lines.  A monochromator is used to select the specific wavelength of light which is absorbed by the sample, and to exclude other wavelengths.  The selection of the specific light allows the determination of the selected element in the presence of others
  • 30. Detector  The light selected by the monochromator is directed onto a detector that is typically a photomultiplier tube, whose function is to convert the light signal into an electrical signal proportional to the light intensity.  The processing of electrical signal is fulfilled by a signal amplifier . The signal could be displayed for readout , or further fed into a data station for printout by the further fed into a data station requested format.
  • 31. Application of AAS  Determination of even small amounts of different elements like mercury, calcium, magnesium, in different industries like Pharmaceutical industry, Food industry.  It is also use in environmental studies to find the conc of elements in drinking water, ocean water and soil.
  • 32. Flame emission spectroscopy Flame emission spectroscopy / Atomic emission spectroscopy is a method of chemical analysis that uses the intensity of light emitted from a flame at a particular wavelength to determine the quantity of an element in a sample. The wavelength of the atomic spectral lines gives the identity of an element the intensity of the emitted light is proportional to the no. of atoms of the element”.
  • 33. Principle  When a solution of metallic salt sprayed as fine droplets into a flame. The heat energy (thermal energy) of the flame the solvent in the droplets dry, leaving a fine residue. This residue convert into neutral atoms.  This thermal energy also convert atom into exited state.  Exited state atoms return to ground state with the emission of radiation is in specific wavelength.  The wavelength of the radiation emitted is specific for every element and is used to identify the element (Qualitative Analysis).  The intensity of emitted radiation depends upon the concentration of the elements (Quantitative Analysis).
  • 34.
  • 35. Components of Flame Emission spectroscopy  Burner  Nebulizer  Monochromator  Amplifier  Detector
  • 36. Flame  The flame used in the flame photometry must possess the following 1. The ability to evaporate the liquid droplets from the sample solution, resulting in the formation of solid residue. 2. The solid residue resulting in the formation of atoms. 3. Must have the capability to excite the atoms. 4. Cause them to emit radiant energy. 5. These processes is controlled by several factors which are summarised as follows: i. Type of fuel and oxidant ii. Type of solvent iii. Amount of solvent iv. Type of burner
  • 37. Types of Burner  Mecker Burner  Total Consumption Burner  Laminar Flow Burner  Lundergraph Burner  Sheilded Burner  Nitrous Oxide- Acetylene Flame
  • 38. Total Consumption Burner  Fuel and oxidant are hydrogen and oxygen.  Liquid sample is drawn into the flame from the side tubing hydrogen and oxygen are entering.  Both are burning at the top of the burner to produce the flame.  As soon as the liquid sample is drawn into the base of flame, the oxygen aspirates sample solution leaving a solid residue.  Atomization and excitation of the sample then follow.  The name “Total Consumption Burner” is used because all the sample that enters the capillary tube will enter the flame regardless of droplets size.  It can be adjusted by proper control of fuel-to-oxidant ratio.
  • 42. Introduction  Ultraviolet and visible are energetic enough to promote outer electrons to higher energy levels .  UV- visible spectroscopy is usually applied to molecules and inorganic ions or complexes in solution.  The UV –visible spectra have broad features that are limited use for sample identification but are very useful for quantities measurements .  The concentration of an analyte in solution can be determined by measuring the absorbance at some wavelength and applying the beer-Lambert law.
  • 43. Principle  It is the measurement of the wavelength and intensity of absorption of near – ultraviolet and visible light by a sample to identify the presence of the free electrons and double bonds within a molecule and find out the purity of sample.  Beer Lambert’s Law When a monochromatic light of initial intensity I° passes through a solution in a transparent vessel some of the light is absorbed so that the intensity of the transmitted light I is less than I°. There is some loss of light intensity from scattering by particles in the solution and reflection at the interfaces ,but mainly from absorption by the solution. The relationship between I and I° depends on the path length of the absorbing medium l and the concentration of the absorbing solution. these factors are related in the laws of lambert and beer.
  • 44. Where as, A = log 𝐼𝑜 𝐼 So, A = log 𝐼𝑜 𝐼 = 𝞊𝑐𝑙 ← l →
  • 45. Excitation  Absorption of light in the UV/Visible part of the spectrum (210 – 900 nm) • The transitions that result in the absorption of electromagnetic radiation in this region of the spectrum are transitions between electronic energy levels in a molecules. • Generally, the most probable transition is from highest occupied molecular orbital (HOMO) to lowest occupied molecular orbital (LUMO).
  • 46. Chromophore  The term chromophore is used to denote a functional group of some other structural feature of which gives a color to compound.  For example , nitro group is a chromophore because it is presence in a compound gives yellow color to the compound . Auxochrome A saturated/unsaturated group with non bonding electrons when attached to chromophore altering both wavelength as well as intensity of absorption. Example : -OH, -NH2, -NHR, -COOH, - CN, -Cl
  • 47. Absorption and intensity Shifts Bathochromic shift (red shift): a shift to lower energy or longer wavelength. Hypsochromic shift (blue shift): a shift to higher energy or shorter wavelength. Hyperchromic effect: An increase in intensity. Hypochromic effect: A decrease in intensity
  • 48. Types of transition 1. δ - δ * Transitions An electron in a bonding s orbital is excited to the corresponding antibonding orbital. The energy required is large. For example, methane (which has only C-H bonds, and can only undergo ó -ó * transitions) shows an absorbance maximum at 125 nm. Absorption maxima due to ó - ó * transitions are not seen in typical UV-Vis. spectra (200 - 700 nm). 2. n - δ * Transitions Saturated compounds containing atoms with lone pairs (non-bonding electrons) are capable of n -ó * transitions. These transitions usually need less energy than ó - ó * transitions. They can be initiated by light whose wavelength is in the range 150 - 250 nm. The number of organic functional groups with n -ò * peaks in the UV region.
  • 49. Types of transition 3. n -π* and π - π* Transitions. Most absorption spectroscopy of organic compounds is based on transitions of n or pi electrons to the pi* excited state. This is because the absorption peaks for these transitions fall in an experimentally convenient region of the spectrum (200 - 700 nm). These transitions need an unsaturated group in the molecule to provide the pi electrons.
  • 50. Flow sheet diagram of UV/Visible spectrophotometer
  • 51. 1) Source of Light  Tungsten filament lamps and hydrogen-deuterium lamps are most widely used and suitable light source as they cover the whole UV region.  Tungsten filament lamps are rich in red radiations; more specifically they emit the radiations of greater than 375nm, while the intensity of hydrogen- deuterium lamps falls below 375nm. 2) Monochromator
  • 52. Sample and reference cell  One of the two divided beams is passed through the sample solution and second beams passed through the reference solution.  Both sample and reference solution are contained in the cells.  These cells are made of either silica or quartz.  Glass can not be used for the cells as it also absorbs light in the UV region.
  • 53. Detector  Generally two photocells serve the purpose of detector in UV spectroscopy.  One of the photocell receives the beam from sample cell and second detector receives the beam from the reference.  The intensity of the radiation from the reference cell is stronger than the beam of sample cell. This results in the generation of pulsing or alternating currents in the photocells.
  • 54. Amplifier The alternating current generated in the photocells is transferred to the amplifier. The amplifier is coupled to a small servo meter. Generally current generated in the photocells is of very low intensity, the main purpose of amplifier is to amplify the signals many times so we can get clear and recordable signals.
  • 55. Recording Device  Most of the time amplifier is coupled to a pen recorded which is connected to the computer.  Computer stores all the data generated and produces the spectrum of the desired compound
  • 56. Application Of UV/Visible spectrophotometer Detection of Impurities  It is one of the best methods for determination of impurities in organic molecules.  Addition peaks can be observed due to impurities in the sample and it can be compared with that of standard raw material.  By also measuring the absorbed at specific wavelength, the impurities can be detected Structure elucidation of organic compounds  it is useful in the structure elucidation of organic molecules, such as in detecting the presence of hetero atoms.
  • 57. Structure elucidation of organic compounds  UV absorption spectroscopy can be used for the quantitative determination of compounds that absorb UV radiation.  UV absorption spectroscopy can characterize those types of compounds which absorbs UV radiation thus used in qualitative determination of compounds .  Identification is done by comparing the absorbing spectrum with the spectra of known compounds.  This technique is used to detect the presence or absence of functional group in the group. absence of a bond at particular wavelength regarded as an evidence for absence of particular group.
  • 58. Structure elucidation of organic compounds  Kinetics of reaction can also be studied using UV spectroscopy. The UV radiation is passed through the reaction cell and the absorbance changes can be observed.  Many drugs are either in the form of raw material or in the form of formulation. They can be assayed by making a suitable solution of the drug in a solvent and measuring the absorbance at specific wavelength.  Molecular weights of compounds can be measured spectrophotometrically by preparing the suitable derivatives of these compounds.  Uv spectrophotometer may be used as a detector for HPLC.
  • 59. Disadvantage  Only those molecules are analyzed which have chromophores.  Only liquid samples are possible to analyzed.  Result of the absorption can be effective by pH ,temperature and impurities.  It takes time to get ready to use it.  Cuvette handling can affect the reading of the sample.
  • 61. Introduction  Infrared spectroscopy or vibrational spectroscopy is study of absorption of Infrared radiations results in vibrational transitions. Infrared spectroscopy is an important analytical technique for determining structure of both organic and inorganic compounds.  Lies in the wavelength range 0.8-1000 μm.  IR region lies between visible and microwave region.  Atoms in a molecule do not remain in fixed positions but vibrate about their mean positions.  On absorption of IR transition from ground vibrational level to excited vibrational level give rise to closely packed absorption spectrum.  IR spectrum is obtained by plotting absorbance v/s wavelength.
  • 63. Principle  When infrared 'light' or radiation hits a molecule, the bonds in the molecule absorb the energy of the infrared and respond by vibrating. Types of Vibration Stretching vibration 1. Stretching vibration Involves a continuous change in the inter atomic distance along the axis of the bond between two atoms. 2.It requires more energy so appear at shorter wavelength. 3. Stretching vibration Involves a continuous change in the inter atomic distance along the axis of the bond b/w 2 atoms.
  • 64. Bending vibrations 1. Bending vibrations are characterized by a change in the angle b/w two bonds. 2. It requires less energy so appear at longer wavelength. 3. Bending vibrations are characterized by a change in the angle b/w two bonds
  • 65. Theory of Infrared Spectroscopy In a molecule after absorption of IR, the vibrations or rotations within a molecule must cause a net change in the dipole moment of the molecule. The alternating electrical field of the radiation (remember that electromagnetic radiation consists of an oscillating electrical field and an oscillating magnetic field, perpendicular to each other) interacts with fluctuations in the dipole moment of the molecule.
  • 66. Theory of Infrared Spectroscopy  If the frequency of the radiation matches the vibrational frequency of the molecule then radiation will be absorbed, causing a change in the amplitude of molecular vibration.
  • 67.
  • 68. Absorption of radiation The frequency is affected by 1. The masses of the atoms in the bond 2. The strength of the bond The lower the mass, the higher the vibrational frequency. Stretching frequencies for bonds to carbon: C-H > C-C > C-N > C-O The stronger the bond, the higher the vibrational frequency Stretching frequencies • C≡C > C=C > C-C • C≡N > C=N > C-N • C≡O > C=O > C-O • spC-H > sp2C-H > sp3C-H
  • 69. Region in Infrared Spectroscopy Functional Group Region
  • 70. Absorption Value of different Functional Group
  • 72. Infrared Spectrum of Acetic Acid