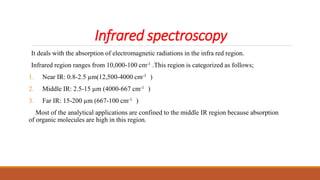
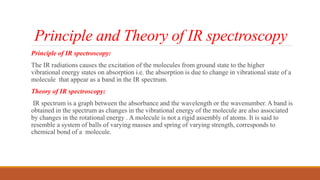
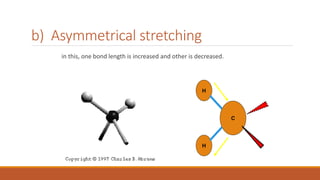
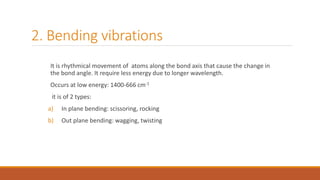
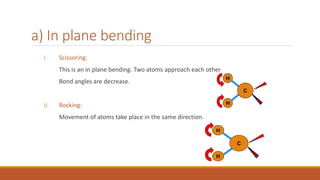
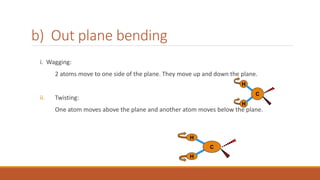
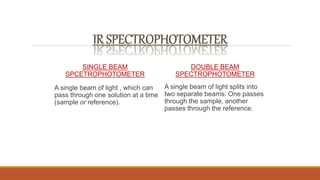
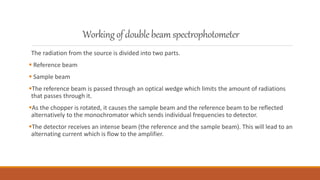
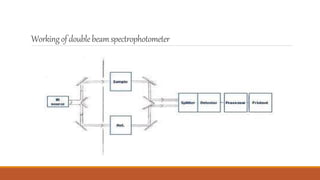
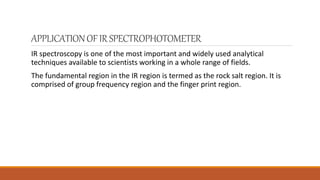
2. Objectives
Introduction
Principle of IR Spectroscopy
Theory of IR Spectroscopy
Molecular vibrations
Instrumentationof IR Spectroscopy
Applications of IR Spectroscopy
3. Infrared spectroscopy
It deals with the absorption of electromagnetic radiations in the infra red region.
Infrared region ranges from 10,000-100 cm-1 .This region is categorized as follows;
1. Near IR: 0.8-2.5 µm(12,500-4000 cm-1 )
2. Middle IR: 2.5-15 µm (4000-667 cm-1 )
3. Far IR: 15-200 µm (667-100 cm-1 )
Most of the analytical applications are confined to the middle IR region because absorption
of organic molecules are high in this region.
4. Principle and Theory of IR spectroscopy
Principle of IR spectroscopy:
The IR radiations causes the excitation of the molecules from ground state to the higher
vibrational energy states on absorption i.e. the absorption is due to change in vibrational state of a
molecule that appear as a band in the IR spectrum.
Theory of IR spectroscopy:
IR spectrum is a graph between the absorbance and the wavelength or the wavenumber. A band is
obtained in the spectrum as changes in the vibrational energy of the molecule are also associated
by changes in the rotational energy . A molecule is not a rigid assembly of atoms. It is said to
resemble a system of balls of varying masses and spring of varying strength, corresponds to
chemical bond of a molecule.
5. Theory of Infrared Absorption
Spectroscopy
For a molecule to absorb IR, the vibrations or rotations within a molecule must cause a net
change in the dipole moment of the molecule.
If the frequency of the radiation matches the vibrational frequency of the molecule then radiation
will be absorbed, causing a change in the amplitude of molecular vibration. Although the IR
spectrum is characteristics of a whole molecule, certain functional groups give rise to absorption
bands at the same frequency regardless of the structure of the rest of the molecules. Therefore IR
spectroscopy useful for identification of functional groups.
6. Molecular vibrations
There are two types of molecular vibrations.
1. Fundamental (if vibration are associated with the functional group).
2. Non fundamental
Fundamental is further classified as
Stretching vibrations
Bending vibrations
Stretching vibrations
These occur along the bond axis, where interatomic distance increases or decreases but atomic
position remain as such. It require more energy as compare to bending due to shorter wavelength.
Two types of stretching vibrations are possible –
I. Symmetrical stretching
II. Asymmetrical stretching
10. 2. Bending vibrations
It is rhythmical movement of atoms along the bond axis that cause the change in
the bond angle. It require less energy due to longer wavelength.
Occurs at low energy: 1400-666 cm-1
it is of 2 types:
a) In plane bending: scissoring, rocking
b) Out plane bending: wagging, twisting
11. a) In plane bending
i. Scissoring:
This is an in plane bending. Two atoms approach each other
Bond angles are decrease.
ii. Rocking:
Movement of atoms take place in the same direction.
H
H
CC
H
H
CC
12. b) Out plane bending
i. Wagging:
2 atoms move to one side of the plane. They move up and down the plane.
ii. Twisting:
One atom moves above the plane and another atom moves below the plane.
H
H
CC
H
H
CC
13. For linear (3n-5)degree of freedom represent fundamental vibrations
For non linear (3n-6)degree of freedom represent fundamental vibrations
For a molecule containing n number of atom s has 3n degree of freedom
Each atom has 3 degree of freedom depend on x , y ,z
Fundamental vibration of molecule depend on degree of freedom
14. It gives the relation between frequency of oscillation , atomic mass , force constant of the bond .
Thus vibrational frequency is
C = velocity of light
F = force constant
Mx= mass of atom x
My = mass of atom y
15. NON-
FUNDAMENTAL
OVER TONES:
These are
observed at
twice the
frequency of
strong band.
Ex:
carbonyl group.
COMBINATION
TONES:
Weak bands that
appear
occasionally at
frequencies that
are sum/difference
of 2 or more
fundamental
bands.
FERMI
RESONANCE:
Interaction b/w
fundamental
vibration &
overtones or
combination
tones.
Ex:CO2
Non fundamental vibrations
16. Coupled interactions
Interactions between vibrations can occur (Coupling) if the vibrating bonds are joined to
a single, central atom.
This is because there is mechanical coupling interaction between the oscillators.
Example:
C=O (both symmetric and asymmetric stretching vibrations).
17. The main parts of IR spectrometer are as follows:
1. radiation source
2. Sample cell
3. Monochromator
4. Detectors
5. Recorder
18. INSTRUMENTATION
SOURCE:
Two types of the source is used.
a) Globar b)Nernst glower
Globar: a rod of silicon carbide is heated to approximately 1300 degree centigrade to produce the
radiant energy from 1-40micron.
Nernst glower: a rod of zirconium and yittrium is heated to approximately 1500 degree centigrade
to produce the radiant energy from 0.4-20micron.
19.
20. INSTRUMENTATION
Monochromator:
it is same like UV spectrophotometer but it is used to isolate the IR radiation of specific wavelength.
Sample cells:
For gas samples:
The spectrum of a gas can be obtained by permitting the sample to expand into an evacuated cell,
also called a cuvette.
For solution sample:
Infrared solution cells consists of two windows
of pressed salt sealed. Samples that are liquid at
room temperature are usually analyzed in pure
form or in solution. The most common solvents are
Carbon Tetrachloride (CCl4) and Carbon Disulfide
(CS2).
21. SAMPLING OF SOLIDS
Generally 4 techniques are employed for preparing solid samples:
1. Solids run in solution.
2. Solid Films.
3. Mull technique.
4. Pressed pellet technique.
22. SOLIDS RUN IN SOLUTION
Solids may be dissolved in non-aqueous inert solvent and a drop of
this solution is placed on an alkali metal disc and solvent is allowed
to evaporate, leaving a thin film of solute (or the entire solution is
placed in a liquid sample cell) which is then mounted in
spectrometer.
If the solution of solid can be prepared in a suitable solvent then the
solution is run in concentration of cells for liquids.
Some solvents used are chloroform, carbon tetrachloride, acetone,
Cyclohexane etc.
23. If a solid is polymer resins & amorphous solids, the sample is dissolved
in any reasonable volatile solvent & this solution is poured on a rock
salt plate (Nacl or KBr) & solvent is evaporated by gentle heating.
If solid is non-crystalline, a thin homogenous film is deposited on the
plate which can be mounted and scanned directly.
Sometimes polymers can be “hot pressed” onto plates.
SOLID FILMS
24. MULLTECHNIQUE
In this technique a small quantity of sample is thoroughly ground in a clean mortar
until the powder is very fine.
After grinding, the mulling agent (mineral oil or Nujol) is introduced in small
quantities just sufficient to take up the powder (mixture approximates the
consistency of a toothpaste).
The mixture is then transferred to the mull plates & the plates are squeezed
together to adjust the thickness of the sample between IR transmitting windows.
This is then mounted in a path of IR beam and the spectrum is run.
25. Pressed pellet technique
In this technique a small amount of finely ground solid sample is
intimately mixed with about 100 times its weight of powdered
Potassium bromide, in a vibrating ball mill.
This finely ground mixture is then pressed under very high
pressure in evacuable die or minipress to form a small pellet (about
1-2 mm thick and 1cm in diameter).
The resulting pellet is transparent to IR radiation and is run as such.
27. Pressed pellet technique (continue…)
The powder (KBr + sample) is introduced in between the
2 bolts and the upper screw A is tightened until the
powder is compressed to a thin disc.
After compressing the sample bolts are removed and a
steel cylinder with pellet inside it is placed in path of the
beam of IR spectrometer and a blank KBr pellet of
identical thickness is kept in the path of reference beam.
28. Advantages of this technique over mull technique
The use of KBr eliminates the problem of bands which appear in IR spectrum due
to the mulling agent as in this case no such bands appear.
KBr pellets can be stored for longer periods of time.
As concentration of the sample can be suitably adjusted in pellets, it can be used
for quantitative analysis.
The resolution of spectrum in KBr is superior to that obtained with mulls.
29. DETECTORS
The measurement of infrared radiation is difficult as a result of low intensity of available source
and low energy of the infrared photons. As a consequence of these properties, the electrical
signal from the infrared detector is small and its measurement requires large amplification.
Two types of IR detectors are used
•Thermal detector
•Non thermal detector
30.
31. TYPES OF THERMAL DETECTOR
There are four types of thermal detector.
Bolometers
Thermocouple and thermopile
Pyro electric detector
Golay cell
32. BOLOMETER
Bolometer is derived from a Greek word (bolometron)
Bolo = for something thrown
Metron = measure
A bolometer consists of an absorptive element, such as a thin layer of metal.
Most bolometers use semiconductor or superconductor absorptive elements rather than
metals.
These material exhibit a relatively large change in resistance as a function of
temperature.
33. Working
Step No 1
Thin layer of
metal
connected to a
reservoir
Step No 2
Any radiation on the
absorptive element
raises its
temperature above
that of the reservoir.
Step no 3
The temperature
change can be
measured directly
with an attached
thermometer.
34. Temperature changes Potential difference changes
Thermocouples consist of a pair of junctions of different metals; for example, two pieces
of bismuth fused to either end of a piece of antimony. Whenever IR radiation fall at the
junction, it causes the change in temperature and also a change in the potential
difference that causes the production of electrical signal.
35. Thermopile
A thermopile is the combination of six thermocouples connected in series. Half
the junction are considered as hot and other half as cold which are thermally
bonded to the substrate and maintains the stable temperature.
The entire assembly is mounted in an evacuated enclosure with an IR
transmitting window made up of KBr so as to minimize the heat loss.
Thermopiles are one of the most simple and direct means of converting radiant
energy into an electrical energy.
36. Pyro electric Detector
• Single crystalline wafer of a pyro electric material, such as triglycerine sulphate.
• Pyro electric Infrared Detectors (PIR) convert the changes in incoming infrared light
to electric signals.
37. GOLAYCell
It consist of a small metal cylinder closed by a rigid blackened metal plate at one end and
flexible silvered diaphragm at other end. The whole chamber is filled with xenon gas.
Exposure to IR radiation through a radiation transmitting window causes the gas to expand
and diaphragm to deform. Motion of the diaphragm changes the output of cell and
detected in the form of signal.
38. Non Thermal Detectors
Photon detectors:
Photoelectric detectors consists of a semiconducting material deposited on a glass surface,
sealed in an evacuated envelop.
Absorption of an IR promotes the nonconducting valence electron to a higher, conducting state.
The electrical resistance of the semiconductor decreases.
39. SINGLE BEAM
SPCETROPHOTOMETER
DOUBLE BEAM
SPECTROPHOTOMETER
A single beam of light , which can
pass through one solution at a time
(sample or reference).
A single beam of light splits into
two separate beams. One passes
through the sample, another
passes through the reference.
40. Workingofdoublebeamspectrophotometer
The radiation from the source is divided into two parts.
Reference beam
Sample beam
The reference beam is passed through an optical wedge which limits the amount of radiations
that passes through it.
As the chopper is rotated, it causes the sample beam and the reference beam to be reflected
alternatively to the monochromator which sends individual frequencies to detector.
The detector receives an intense beam (the reference and the sample beam). This will lead to an
alternating current which is flow to the amplifier.
42. APPLICATIONOFIRSPECTROPHOTOMETER
IR spectroscopy is one of the most important and widely used analytical
techniques available to scientists working in a whole range of fields.
The fundamental region in the IR region is termed as the rock salt region. It is
comprised of group frequency region and the finger print region.
43. GROUP FREQUENCY
REGION
FINGERPRINT REGION
consisting of the absorption bands
of the functional groups.
frequency = 4000-1300cm-¹
wavelength = 2.5-8
IR spectra is called “fingerprints”
because no other chemical
species will have similar IR
spectrum.
Single bonds give their absorption
bands in this region.
Frequency=1300-650cm-1
Wavelength=8-15.4
44.
45. IdentificationofSubstances
The finger print region is mostly used to compare the identity of a compound. Because
small differences in structure & constitution of molecule result in significant changes in
the peaks in this region.
Hence this region helps to identify an unknown compound.
• Criteria: Sample and reference must be tested in identical conditions, like physical state,
temperature, solvent, etc
46. DeterminationofMolecularStructure
Used along with other spectroscopic techniques.
Identification is done based on position of absorption bands in the spectrum.
Eg: C=O at 1717 cm-1.
Absence of band of a particular group indicates absence of that group in the compd.
47. DetectionofImpurities
The presence of absorption bands at positions where
compound is not expected to absorb indicates the presence of
impurities.
Determined by comparing sample spectrum with the spectrum
of pure reference compound.
48. Studyingthe progress of reaction
The progress of a reaction can be followed by examining the IR Spectra.
Observing rate of disappearance of characteristic absorption band in reactants; or
Rate of increasing absorption bands in products of a particular product.
Example: Oxidation of secondary alcohol to ketone can be detected by disappearance of OH band
and appearance of C=O band.
O—H = 3600-3650 cm-1
C=O = 1680-1760 cm-1
49. Molecularshapeorsymmetrydetermination
The shape or symmetry of a molecule can be determined by the IR
spectroscopy.
For example: If linear --> only 2 bands should be present.
If bent --> 3 bands should be present.
Actual spectrum shows 3 peaks at 750, 1323 and 1616 cm-1.
51. FOURIERTRANSFORMIRSPECTROPHOTOMETER
It is the most advance IR spectrophotometer . In this a laser beam is
used, which is allowed to fall on an interferometer. This photometer
has advantage of fast speed of analysis, so very accurate values of
molecular parameters are found with FTIR. A computer is also linked
to get the store data.